
TagPies: Comparative Visualization of Textual Data
Stefan J
¨
anicke
1
, Judith Blumenstein
2
, Michaela R
¨
ucker
2
, Dirk Zeckzer
1
and Gerik Scheuermann
1
1
Image and Signal Processing Group, Leipzig University, Leipzig, Germany
2
Faculty of History, Arts and Oriental Studies, Leipzig University, Leipzig, Germany
Keywords:
Tag Clouds, Pie Charts, TagPies, Text Visualization, Text Comparison, Digital Humanities.
Abstract:
A TagPie is a novel tag cloud layout that arranges the tags belonging to multiple data categories in a pie chart
manner. Motivated from research in classical philology, TagPies were designed to support the comparative
analysis of classical terminology. In this scenario, the data categories represent the co-occurrences of different
searched keywords, so that the comparison of the contexts in which these keywords were used becomes pos-
sible using TagPies. This paper illustrates the iterative development of TagPies, which aid as a distant reading
view on a text corpus for humanities scholars. We outline various steps of our collaborative digital humanities
project, and we emphasize the utility of the proposed design by outlining various usage scenarios representing
current research questions in classical philology.
1 MOTIVATION
Traditionally, humanities scholars read texts on pa-
per in order to generate and verify hypotheses about
precisely formulated research questions. As a re-
sult of mass digitization, nowadays, the scholars have
access to large digital libraries containing numerous
texts. This on demand availability of texts changes
the traditional workflows of the scholars in different
ways. First, the retrieval of text passages gets eas-
ier, usually, by querying a text corpus using a typi-
cal keyword-based search. The drawback of this ap-
proach is that the quality of results is usually not sat-
isfying. Often, the humanities scholars receive too
many results, which they cannot process individually.
Consequently, it is impossible to generate useful hy-
potheses. On the other hand, the precision can be
low so that many found text passages are irrelevant to
the given research question. Especially in that case,
picking text passages related to the observed topic
is a laborious task. Second, the access to vast tex-
tual data brought forth new research methodologies in
the humanities, introduced by Franco Moretti as dis-
tant reading (Moretti, 2005). Before the digital age it
was inconceivable to generate hypotheses about texts
without explicitly reading them; Moretti presented re-
search questions that were impossible to investigate
with the traditional close reading technique.
In our digital humanities projecteXChange,
1
the
1
http://exchange-projekt.de/
collaborating humanities scholars—six historians and
classical philologists—wanted to explore medical
concepts in classical texts, which required workflows
that include distant as well as close readings. Work-
ing with the project’s large text corpus, the humanities
scholars are interested in the co-occurrences of med-
ical terms. For instance, they look for terms describ-
ing medical conditions, associated terms for symp-
toms, body parts, etc., in order to explore what ancient
writers knew about the medical concept. The mis-
sion of the corresponding digital humanities project
was investigating novel research questions in classi-
cal philology—the comparison of medical concepts.
For instance, a humanities scholar hypothesized that
the terms morbus comitialis and morbus sacer like-
wise were used to denote epilepsy (a discussion of this
example can be found in Section 5.2).
In order to support the comparative analysis of
medical concepts in classical texts, we developed Tag-
Pies in close collaboration to the humanities scholars
of our project. This paper outlines the steps of the iter-
ative development and the final TagPies layout algo-
rithm that includes a tailored tag sorting mechanism
and design features applied to visually separate shared
and individual contexts of terms. To meet the needs
of the humanities scholars, we embedded TagPies as
a distant reading visualization into a visual interface
that is linked to a close reading view, which enable the
inspection of individual text passages in order to as-
sess their relevancy to the observed medical concept.
40
Jänicke, S., Blumenstein, J., Rücker, M., Zeckzer, D. and Scheuermann, G.
TagPies: Comparative Visualization of Textual Data.
DOI: 10.5220/0006548000400051
In Proceedings of the 13th Inter national Joint Conference on Computer Vision, Imaging and Computer Graphics Theory and Applications (VISIGRAPP 2018) - Volume 3: IVAPP, pages 40-51
ISBN: 978-989-758-289-9
Copyright © 2018 by SCITEPRESS – Science and Technology Publications, Lda. All rights reserved

We emphasize the utility of this visual interface for
the humanities scholars by providing various usage
scenarios. In a storytelling style, each scenario ex-
emplifies how TagPies support verifying and generat-
ing hypotheses concerning philological matters. Ad-
ditionally, we report collaboration experiences gained
during our digital humanities project. This includes
the iterative evaluation of TagPies with the humani-
ties scholars, and limitations of our approach.
2 RELATED WORK
Widely used and perceived as being fun, tag clouds
are important components in the social web to visu-
alize summaries of textual data. Many works present
layout methods developed to consolidate the use and
validity of tag clouds for specific purposes. Below,
we outline general information about tag clouds, their
use in digital humanities applications, and we take a
look at various tag cloud layout approaches that sup-
port the visualization of multiple data categories.
2.1 Tag Cloud Visualizations
The primary purpose of tag clouds is to present a vi-
sual summary of textual data (Sinclair and Cardew-
Hall, 2008). First introduced by Stanley Milgram’s
mental map of Paris (Milgram and Jodelet, 1976)
in 1976, tag clouds later became popular in the so-
cial web community. Although originally used for
non-specific information discovery, tag clouds can
also be used to support analytical tasks such as the
examination of text collections (Viegas and Watten-
berg, 2008). Furthermore, tag clouds obtained wide
acceptance as interfaces for navigation purposes on
databases (Hearst and Rosner, 2008). Traditionally, a
tag cloud is a simple list of words placed on multi-
ple lines, either ordered alphabetically or by the im-
portance of a tag, which is encoded by variable font
size (Murugesan, 2007). Portals such as ManyEyes
can be used to create such kind of tag cloud visualiza-
tions on demand (Viegas et al., 2007). A user study
on the utility of tag clouds revealed that the usual al-
phabetic order is not obvious for the observer, but tag
clouds are generally seen as a popular social com-
ponent (Hearst and Rosner, 2008). Potentially, this
was one of the reasons that later more sophisticated
tag cloud layout approaches were developed, which
rather emphasized aesthetics than meaningful order-
ings. A representative technique is Wordle (Viegas
et al., 2009), a popular web-based tool for visualiz-
ing tag clouds used for a wide range of applications.
Wordle produces compact aesthetic layouts with tags
in different colors and orientations, but both features
do not transfer any additional information. The tag
cloud design presented in this paper is based on the
Wordle algorithm. It places the tags similarly using
an Archimedean spiral, but, additionally, we use the
features color and position to visually express the be-
longing of individual tags to and their significance for
various data categories.
2.2 Tag Clouds in Digital Humanities
Visualizations in general are widely applied in dig-
ital humanities projects to explore cultural heritage
datasets (J
¨
anicke et al., 2015). Tag clouds in par-
ticular are frequently used to encode the number of
word occurrences within a selected section of a text,
a whole document or an entire text corpus (Vuille-
mot et al., 2009; Fankhauser et al., 2014). For ex-
ample, the VarifocalReader (Koch et al., 2014) uses
tag clouds “to give a visually appealing overview of
a section of text,” which points out the importance
of aesthetics when designing visualizations for dig-
ital humanities scholars. By applying significance
measures, the visualization can be limited to display-
ing only characteristic tags, e.g., the most signifi-
cant tags of a selected time period (Eisenstein et al.,
2014) or the most frequently mentioned commodoties
in a text corpus after filtering (Hinrichs et al., 2015).
Topic modeling approaches gain more and more ac-
ceptance in digital humanities applications. Here, tag
clouds help to illustrate the most descriptive tags of
topics (Binder and Jennings, 2014; Montague et al.,
2015). When analyzing the evolution of topics over
time (Cui et al., 2011; Cui et al., 2014), tag clouds
serve to explore the temporal change of a topic’s ter-
minology. In contrast, some tag cloud approaches il-
lustrate trends in a text corpus. Parallel Tag Clouds
generate alphabetically ordered tag lists as columns
for a number of time slices and highlight the temporal
evolution of a tag placed in various columns on mouse
interaction (Collins et al., 2009). SparkClouds attach
a graph showing the tag’s evolution over time (Lee
et al., 2010). Hinrichs links tag clouds to a classifi-
cation schema in the form of a tree structure to help
humanities scholars getting access to texts of a specu-
lative fiction anthology corpus (Hinrichs et al., 2016).
The tag cloud approach presented in this paper was
developed in order to support humanities scholar in
comparing the co-occurrences of different classical
terms to each other. That tag clouds are appropriate
visualization to illustrate a word’s co-occurrences is
already shown by Beaven (Beavan, 2008). A basic
visualization that contrasts the co-occurrences of two
words is outlined by Beaven (Beavan, 2011).
TagPies: Comparative Visualization of Textual Data
41

2.3 Visualizing Categories in Tag
Clouds
Gleicher gives an overview of comparative visual-
ization techniques for different scenarios (Gleicher
et al., 2011). A radial comparative overview of top-
ics whose words are represented by dots is illus-
trated by Havre (Havre et al., 2001). For the com-
parative visualization of tags, various approaches en-
deavor to place related tags close to each other in vi-
sual groups, in the following called data categories.
Thematically clustered tag clouds or semantic tag
clouds support the detection of tags belonging to a
certain topic (Lohmann et al., 2009). As shown by
Schrammel et al. (Schrammel et al., 2009), these tag
cloud designs were often preferred by users for spe-
cific search tasks as they raise the attention towards
small tags compared to other designs. For traditional
tag lists, semantically related tags of a data category
can be placed subsequently (Schrammel and Tsche-
ligi, 2014), for more sophisticated layouts the usage
of force directed approaches is quite popular. Here,
semantically close terms attract each other (Cui et al.,
2010; Wu et al., 2011; Liu et al., 2014). GMap is a
force directed approach that delivers a segmentation
of a graph into color-coded neighborhoods (Gansner
et al., 2010). Other methods try to preserve seman-
tic relationships in tag clouds by placing the related
tags of each data category in non-overlapping areas
individually. Afterwards, multiple tag clouds are vi-
sually combined to a single one. The Star Forest
method (Barth et al., 2014) initially calculates the lay-
out for the tags of each data category independently.
Then, it uses a force directed method to pack the vari-
ous clouds to gain a unified tag cloud. In ProjClouds,
a tag cloud layout for each cluster of a document
collection is computed within its assigned polygo-
nal space in the plane (Paulovich et al., 2012). All
above mentioned methods pack multiple tag clouds
together, thus, they can be seen as sophisticated small
multiples approaches since the tag clouds for all data
categories are computed independent of each other.
As a consequence, large in-between whitespaces oc-
cur when composing these clouds to a visual entity.
Words Storms is a rather traditional small multiples
approach computing a tag cloud for each document
of a corpus to support the visual comparison of doc-
uments (Castell
`
a and Sutton, 2014). Here, a signif-
icant tag for multiple documents appearing in mul-
tiple clouds is placed at similar locations with same
color and orientation. RadCloud visualizes tags be-
longing to various data categories in a shared ellip-
tical area (Burch et al., 2014), but it also suffers
from whitespaces. In Compare Clouds, tags of me-
dia frames are comparatively visualized in a single
tag cloud (Diakopoulos et al., 2015), but the design is
limited to visualizing two data categories. TagSpheres
arrange tags hierarchically on several circular discs to
transmit the notion of distance in tag clouds using a
different color for every hierarchy level (J
¨
anicke and
Scheuermann, 2016). Furthermore, the TagSpheres
layout can be used to visualize tree structures (J
¨
anicke
and Scheuermann, 2017).
3 DIGITAL HUMANITIES
BACKGROUND
This research bears on research in classical philology,
a field of the humanities that is concerned with an-
alyzing Latin and ancient Greek texts written in the
classical period. In the following, we outline project
goals and collaboration aspects at project start that led
to designing the proposed TagPies layout.
Project Idea. The purpose of the digital humanities
project eXChange was the development of new work-
flows in order to analyze and to compare medical con-
cepts in classic texts. Due to the digitization era, hu-
manities scholars are now able to browse digital li-
braries using a simple keyword search as a standard
technique to discover related text passages. The cor-
pus of our project combines a multitude of existing
sources such as the Perseus Digital Library
2
and the
Bibliotheca Teubneriana Latina.
3
Working with that
corpus, the humanities scholars faced the problem of
retrieving too many results, e.g., a search for morbus
(disease) returned 1,558 text passages. Reading all
text passages and combining the gained insights, es-
pecially, comparing different result sets was not pos-
sible. In close collaboration to humanities scholars
using the project’s text corpus, our mission in the
project was designing an interface, consistent of a
distant reading visualization—TagPies—and a close
reading view, that supports the dynamic exploration
of the results of various keyword-based search queries
in order to facilitate the comparison of various medi-
cal concepts.
Project Start. To ensure designing a valuable, power-
ful tool that supports investigating the posed research
questions, we adopted several suggestions made by
Munzner (Munzner, 2009) for the implementation of
our project. Also, we considered collaboration expe-
riences (J
¨
anicke et al., 2016b) reported by visualiza-
2
Perseus Digital Library, Ed. Gregory R. Crane. Tufts
University. http://www.perseus.tufts.edu
3
Bibliotheca Teubneriana Latina. Walter de Gruyter.
http://www.degruyter.com/db/btl
IVAPP 2018 - International Conference on Information Visualization Theory and Applications
42

tion scholars involved in digital humanities projects
to avoid typical pitfalls when working together with
humanities scholars. We furthermore worked through
related works in the digital humanities providing valu-
able suggestions and guidelines for designing inter-
faces for humanities scholars (Gibbs and Owens,
2012; J
¨
anicke, 2016). To avoid making assumptions
for the design of a visual interface that is hard to com-
prehend and does not support the concerned philo-
logical research questions, we initially discussed the
needs of the humanities scholars and their faced chal-
lenges in the targeted domain in several meetings.
The humanities scholars explained their usual work-
flows, for example, how they use online digital li-
braries for research purposes. On the other hand,
we presented and discussed related text visualization
techniques in order to convey an impression of the
capabilities and challenges within our research field.
This get together turned out to be important to un-
derstand each others mindsets, and to define a set of
workflows to compare medical concepts that the visu-
alization shall support.
Requirement Analysis. Having a large text corpus
and the project idea at hand, we began without a
clear visualization idea. We needed several interdis-
ciplinary meetings at the beginning of the project to
specify the research goals of the humanities scholars
and their requirements concerning the visual interface
to be implemented. Initially, the humanities schol-
ars wanted to comparatively analyze classic medical
terminology. They explained, how they would ap-
proach this research task using common workflows:
by reading the text passages that contain specific key-
words. Thus, for a comparative analysis of classic
medical terminology the contexts in which the key-
word terms occur need to be compared to each other.
In a first workshop, we presented an overview of text
visualization techniques, and we discussed their po-
tential to support the given research task. It turned out
that some scholars were familiar with the idea of tag
clouds, and basic bar charts were also seen as an ap-
propriate method for comparing word frequencies. As
some of the humanities scholars never worked with
visualizations before, and most of them were not used
to work with complex tools, it was necessary to de-
velop a system, which is easy to understand. De-
spite known theoretical problems (Viegas and Wat-
tenberg, 2008), designing a tag cloud visualization
was the means of choice as they are intuitive, widely
used metaphors to display summaries of textual data.
Moreover, tag clouds have been successfully applied
in digital humanities applications before to analyze
the context of words (Beavan, 2008; Beavan, 2011).
In the following meeting, we discussed a list of re-
quirements of a tag cloud layout to be valuable for
the collaborating humanities scholars. The tag cloud
should (1) support the analysis of the context of a sin-
gle keyword and the comparison of the contexts of
various keywords, (2) communicate the relevancy of
a tag to the keyword it co-occurs with and its rele-
vancy concerning all keywords, and (3) to reflect the
proportion of tags from different categories. In a sec-
ond workshop, the humanities scholars worked with
several existing tag cloud visualizations we adapted
to the project corpus. For each queried keyword, we
summarized the frequencies of the co-occurrences.
First, we provided small multiples of Wordle tag
clouds (Viegas et al., 2009), which were seen as aes-
thetic and a good solution to analyze the context of
a single keyword, but a comparative analysis was not
easy as tags co-occurring with various keywords were
hard to find. Working with RadCloud (Burch et al.,
2014) yielded exact opposite results: the discovery
of tags co-occurring with various keywords was easy,
but the analysis of a single keyword’s context was
crucial. Here, the approach of visualizing word fre-
quencies in two concurring manners (bar, tag’s font
size) was confusing for the humanities scholars. Par-
allel Tag Clouds (Collins et al., 2009) were unexpect-
edly not favored, although their basic design is simi-
lar to word lists, with which humanities scholars are
used to work. The major issues were the heights of
the tag clouds, which forced the humanities scholars
to vertically scroll many times during the exploration
process. Also, the required interaction to gain addi-
tional information was seen problematic. The human-
ities scholars stated they want to see several informa-
tion “at the first glance.” When developing TagPies,
we took the feedback during the second workshop
as well as the importance of aesthetics—often men-
tioned by the humanities scholars—into account. As
postulated by Oelke and Gurevych, we designed Tag-
Pies based upon the above listed requirements derived
from the needs of the targeted user group (Oelke and
Gurevych, 2014).
4 TAGPIES LAYOUT
Given are n data categories d
1
, . . . , d
n
(n search re-
sult sets), each containing the co-occurrences for the
queried search terms T
1
, . . . , T
n
in the form of tags.
The general TagPies idea is to place the tags belong-
ing to a data category in a specific circular sector,
forcing vocabulary shared by several data categories
to be placed in the center, and tags unique to a sin-
gle category to be placed in the outer regions of the
tag cloud. With the resultant tag cloud subdivision,
TagPies: Comparative Visualization of Textual Data
43

the final TagPie layout is visually comparable to a
pie chart, which helps the observer to compare the
tag sets of various data categories and to assess their
relative proportions. According to the actual propor-
tions (the number of occurrences of the main terms in
the database) and a maximum number of tags to be
displayed (for the examples in this paper we chose a
maximum of 500 tags), we select the top co-occurring
terms (tags) for each data category. If the relative pro-
portion of a data category is too small, we leave a
minimum of five tags to be displayed.
For each data category d
i
, we need to position
the category’s main tag T
i
(the search term) and the
tags t
i
1
, . . . ,t
i
|d
i
|
(d
i
= {t
i
k
|1 ≤ k ≤ |d
i
|}), which are co-
occurrences of T
i
. F(T
i
) encodes the number of oc-
currences of T
i
in the database, F(t
i
k
) denotes how
often t
i
k
co-occurs with T
i
. The relevancy R(t
i
k
) of a
tag t
i
k
for data category i is defined by
R(t
i
k
) =
F(t
i
k
)
F(T
i
)
.
In the following, we distinguish between shared
tags and unique tags. A shared tag t
i
s
has multiple
instances in the TagPie, which are placed in different
sectors. These instances are defined as
I(t
i
s
) = {t
i
s
} ∪ {t
j
s
|1 ≤ j ≤ n, i 6= j,t
i
s
= t
j
s
},
and |I(t
i
s
)| denotes the number of instances. A unique
tag t
i
u
occurs only once in the TagPie as a tag of the
i-th data category, so that I(t
i
u
) = {t
i
u
} and |I(t
i
u
)| = 1.
4.1 Layout Algorithm
In preparation, we order the data categories d
1
, . . . , d
n
according to their similarity aiming to place as many
similar tags as possible close to each other. The simi-
larity s(d
i
, d
j
) is defined by the number of shared tags
in proportion to the number of unique tags between
two data categories d
i
and d
j
as the Jaccard index
s(d
i
, d
j
) =
|d
i
∩ d
j
|
|d
i
∪ d
j
|
.
Initially, we put the two most similar data categories
next to each other in a double-ended queue. Then,
we iteratively determine the data category d
i
with the
highest similarity to either the first (then, we insert d
i
at the start of the queue) or the last element in the
queue (then, we insert d
i
at the end of the queue).
With the resultant ordering at hand, we estimate the
amount of space required to place all tags of a data
category. This is achieved by mapping the tags in
the corresponding font sizes dependent on their fre-
quencies, and by adding up the bounding boxes for
Figure 1: Defining circular tag cloud sectors.
all tags. So, we obtain an approximate space require-
ment for each data category. Based on that proportion,
we define the angles ϕ
1
, . . . , ϕ
n
of circular sectors for
d
1
, . . . , d
n
that subdivide a Cartesian coordinate sys-
tem at it’s center (0, 0) as shown in Figure 1.
Main Tag Placement. At first, we position the main
tags T
1
, . . . , T
n
in the centers of their corresponding
TagPie sectors. To define these centers, we need to es-
timate the radius r of the TagPie before actually com-
puting it’s layout. Therefore, we compute a Wordle
tag cloud without sectors containing all tags. Using
the obtained radius of this tag cloud as expected ra-
dius r for the TagPie, we can place the main tag T
i
of a data category d
i
in the TagPie’s corresponding
sector at position p(T
i
) = (x
i
, y
i
) as illustrated in Fig-
ure 1. Starting with the orientation s, p(T
i
) is defined
by
x
i
= γ · r · cos(π +
i−1
∑
k=0
ϕ
k
+
ϕ
i
2
)
and
y
i
= γ · r · sin(π +
i−1
∑
k=0
ϕ
k
+
ϕ
i
2
).
With γ = 0.5, we position T
i
at the center of the sec-
tor. Especially when several small sectors are adja-
cent, the corresponding main tags can occlude. To
avoid these occlusions, we automatically decrease or
increase γ in such cases.
Tag Sorting. The idea of the sorting method is to
place tags with a high relevancy to all data categories
in the center of the TagPie. The farther away from the
center a tag is placed, the more relevant it is to the
corresponding data category. Thus, unique tags shall
be placed in the outer regions of TagPie sectors. To
obtain this ordering, one of the following conditions
need to be fulfilled for arbitrary adjacent tags X and Y
in a correctly sorted tag list {. . . , X,Y, . . . }:
C1: |I(X)| > |I(Y )|,
C2: |I(X)| = |I(Y )| and U(X) < U(Y ), or
C3: |I(X )| = |I(Y )|, U(X) = U (Y ) and F(X ) ≥
F(Y ).
IVAPP 2018 - International Conference on Information Visualization Theory and Applications
44

With C1, shared tags belonging to all data categories
move to the beginning of the tag list, and unique tags
move to the end. In case of even numbers of instances,
tags with low uniqueness values are treated before
tags with high uniqueness values (C2). The unique-
ness of a tag X is defined by the quotient of the two
most frequent occurrence totals of X among all data
categories as
U(X) =
max
X
1
∈I(X)
R(X
1
)
max
X
2
∈I(X)\X
1
R(X
2
)
.
The more characteristic a tag X is for a certain data
category compared to the other data categories shar-
ing X, the higher gets U (X). In case of even numbers
of instances and even uniqueness values, C3 ensures
that more frequent tags are processed earlier than less
frequent ones. A final step slightly reorders the tags
according to the proportions of the data categories in
the TagPie. As (unique) tags of small data categories
are usually less frequent than (unique) tags belonging
to larger data categories, they are placed at the end of
the tag list after sorting according to the above men-
tioned conditions. In order to ensure that all TagPie
sectors are uniformly filled with tags, this slight re-
ordering guarantees that tags belonging to small data
categories are treated earlier during the layout algo-
rithm.
With the final tag ordering, we iteratively position
all tags following an Archimedean spiral originating
from the tag cloud center at position (0, 0). A tag is
placed if the determined position on the spiral lies in
the sector that is assigned to the corresponding data
category, and if the tag does not occlude other tags.
Otherwise, the tag will be placed in following turns
of the spiral farther away from (0, 0).
4.2 Design
To avoid whitespaces, a problem addressed in (Seifert
et al., 2008), the above outlined layout algorithm is
based on the Wordle algorithm, which permits over-
lapping tag bounding boxes if the letters do not oc-
clude. Thus, uniform, aesthetic tag clouds capable
of visualizing much information compactly inside a
small region are obtained.
Tag design. We use several well-established design
features for the TagPie layout. Evaluated as being the
most powerful property in (Bateman et al., 2008), we
use font size to encode the number of occurrences of
each tag. The visualization of main tags, which are
placed in the center of their assigned sectors, super-
sedes an additional legend, and furthermore it serves
the purpose of accentuating the belonging of related
tags to their category. Main tags are salient due to
bold font style and underlinings. Stated in (Wald-
ner et al., 2013), users perceive rotated tags as “un-
structured, unattractive, and hardly readable.” There-
fore, we do not rotate tags to keep the layout eas-
ily readable to provide an interface that is beneficial
for the collaborating humanities scholars. Also sug-
gested in (Waldner et al., 2013), color is the best
choice for distinguishing categories. Hence, we use
qualitative color maps to assign distinctive colors to
d
1
, . . . , d
n
. For this purpose, we use those qualita-
tive color maps provided by ColorBrewer (Harrower
and Brewer, 2003) that contain solely saturated col-
ors. Here, we consider not to assign red and green
hues as well as colors with similar hues to data cate-
gories of adjacent TagPie sectors.
To visually separate two concurring tag groupings
in TagPies, we considered the Gestalt theory (Ware,
2013). On the one hand, the differentiation between
shared and unique tags was necessary for exploration
purposes, on the other hand, all tags that belong to
a certain data category shall be visual unity. To fa-
cilitate perceiving the former grouping, shared tags
receive a black color while unique tags retain the cor-
responding data category’s color, thus, implementing
the Gestalt principle of similarity. In order to achieve
that the now differently colored tags of a data category
d
i
form a visual unity, we applied the Gestalt principle
of enclosure by adding a background shape—colored
in a less saturated version of the color assigned to d
i
—
that encloses all tags of d
i
.
Computing Background Shapes. In order to deter-
mine background shapes for the data categories, we
compute a Delaunay triangulation like illustrated in
Figure 2. Iteratively, we insert the centroids of tag
bounding boxes, and finally, we receive a triangula-
tion of the tag distribution that contains three different
triangle types. Either a triangle connects three tags
belonging to the same data category, tags of two or
tags of three data categories. Triangles of the former
type are not required for computing background shape
Figure 2: Delaunay triangulation to determine back-
grounds.
TagPies: Comparative Visualization of Textual Data
45
borders as they lie completely inside the correspond-
ing TagPie sector. When two tags of a triangle belong
to the same data category, we interpolate a line seg-
ment between the bounding boxes as shown in Fig-
ure 2a. For triangles containing dummy nodes of the
super triangle, we do not interpolate line segments,
instead, we link the exterior vertices of the bounding
boxes (see Figure 2b). When all three tags of a tri-
angle belong to different data categories, we generate
three line segments each originating from the triangle
centroid as can be seen in Figure 2c. Finally, the bor-
der of a data category d
i
—drawn as a Bezier spline—
is composed of the line segments of all triangles that
either contain one or two tags of d
i
.
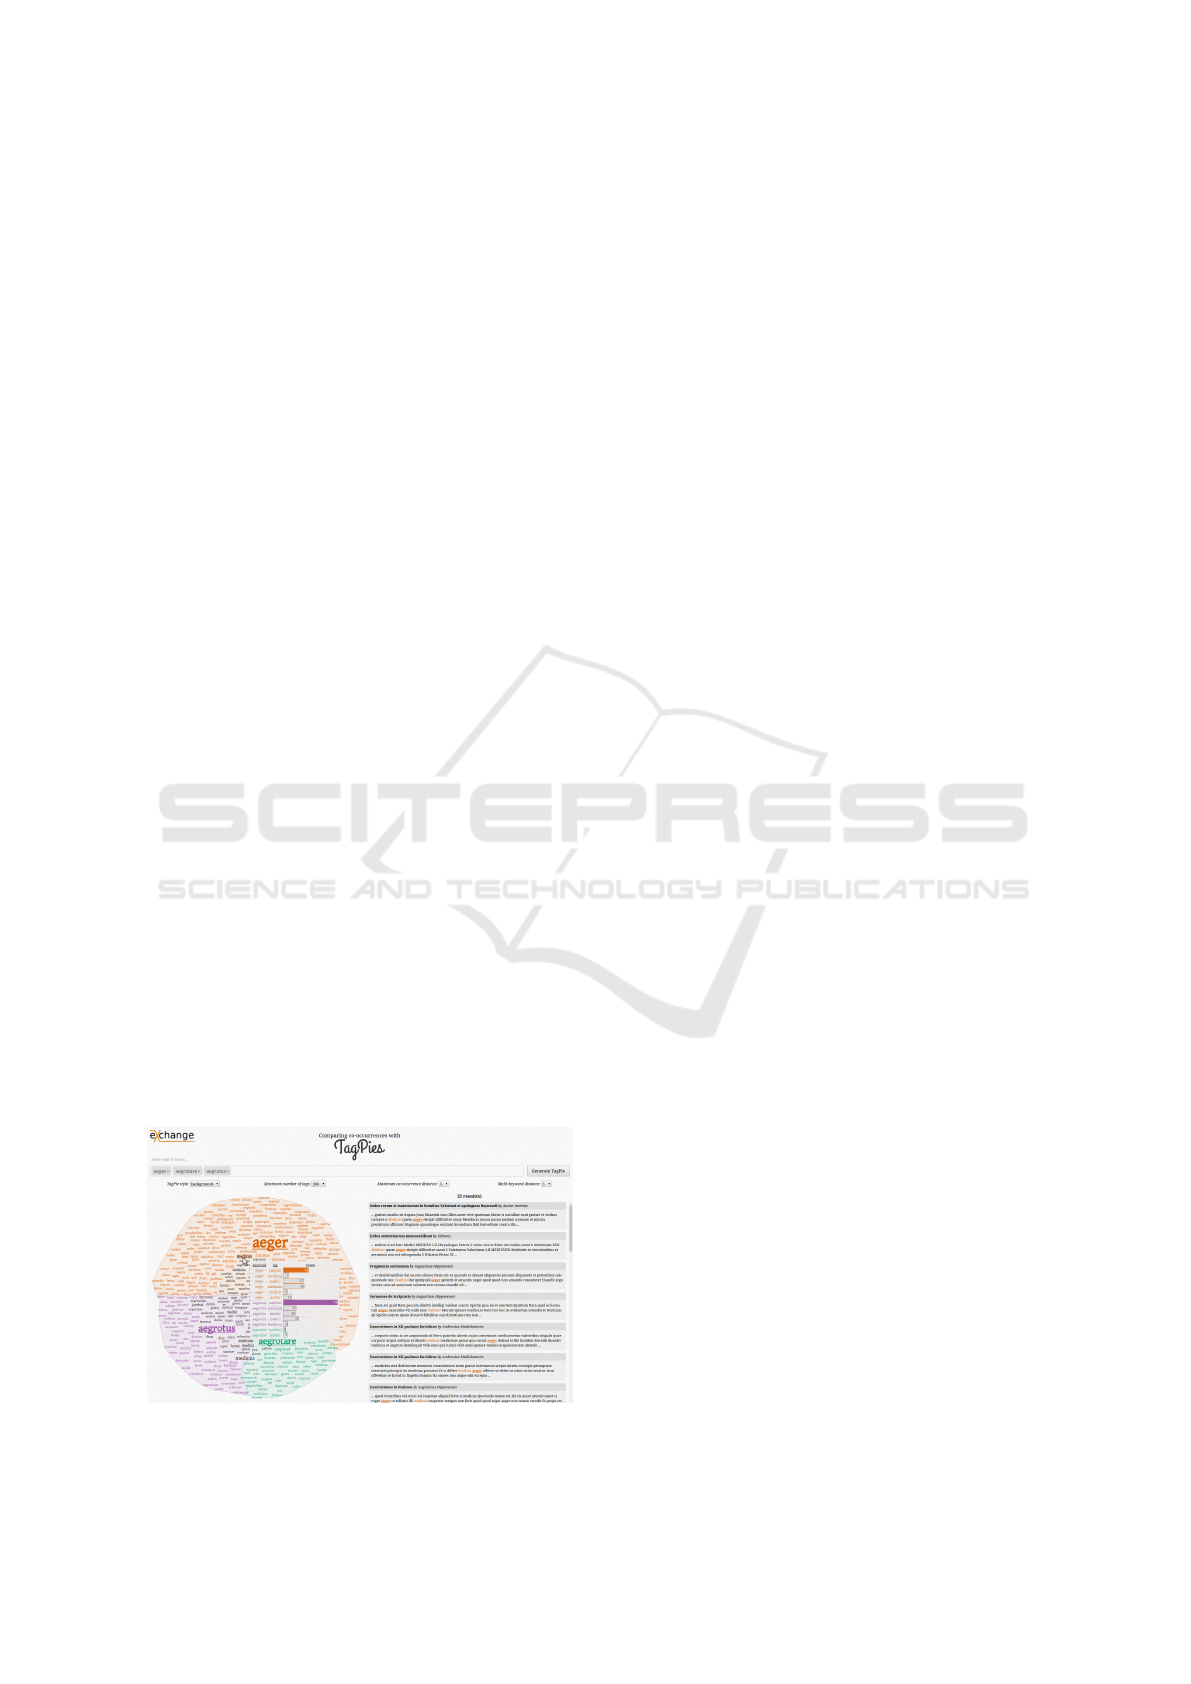
5 USAGE SCENARIOS
TagPies were designed during the digital humanities
project eXChange to support the comparative analy-
sis of medical concepts in classical texts. Figure 3
shows a screenshot of the web-based user interface
the humanities scholars work with. TagPies are em-
bedded as a distant reading visualization that con-
trasts the co-occurrences of various keywords. The
scholar can configure TagPies by choosing the num-
ber of tags to be shown, and by defining the maxi-
mum distance between a searched keyword term and
considered co-occurrences. After retrieving the re-
sults, stopwords are removed according to stopword
lists provided by the humanities scholars. The re-
maining co-occurrences are visualized in the TagPie.
To facilitate navigation and exploration abilities, we
enhanced TagPies by basic means of interaction ac-
cording to the humanities scholars’ wishes. Of par-
ticular interest was highlighting spelling variants of
words, which are provided by the backend of the re-
search platform. With mouse interaction, we enable
the scholar to detect related tags more quickly. Hov-
Figure 3: Screenshot of the TagPies user interface. The
co-occurrence medicus (doctor) of aeger (sick) is selected.
ering a tag highlights the remaining shared tags and
spelling variants. Additionally, all related tags are
listed in a tooltip (shown on mouse click) that illus-
trates the distribution using a bar chart. By clicking
a tag, a close reading view lists previews of text pas-
sages containing the selected co-occurrence and the
corresponding keyword. The humanities scholars de-
sired this connection to the underlying texts in order
to quickly inspect interesting word relationships.
In the following, we emphasize the benefit of Tag-
Pies for investigating novel research questions in the
humanities that demand distant reading arguments.
We illustrate three usage scenarios provided by col-
laborating humanities scholars, for whom TagPies
turned out to be heuristically valuable for philologi-
cal matters.
5.1 Comparing gibbus and gibbosus
Looking for the term “humpy” in Latin dictionar-
ies, the synonyms gibbus and gibbosus are found.
The first example illustrates how a humanities scholar
used TagPies to verify this synonymity. To do so,
she constructed two keyword-based search queries in-
cluding all declensions of the two terms:
gibbus:
gibbus|gibbum|gibba|gibbi|gibbo|gibbe|
gibbae|gibbam|gibbas|gibbis|gibbos|
gibbarum|gibborum
gibbosus:
gibbosus|gibbosum|gibbosam|gibbosas|
gibbosae|gibbosis|gibbosos|gibbosa|
gibbosi|gibboso|gibbose|gibbosarum|
gibbosorum
The resulting TagPie (Figure 4) provides an overview
of the co-occurrences of both terms. It contains
198 text passages for gibbus and 88 text passages
for gibbosus. The group of black colored, shared
tags in the center of the TagPie illustrates a syn-
onymous usage of the terms concerning the (human)
body, e.g., as they both co-occur with body parts like
pede (foot) or manu (hand), or they are used in the
context of diseases like eye diseases (albuginem, lip-
pus) or broken bones (fracto). More physical terms,
e.g., dorso (back), caput (head) and cerebri (brain),
co-occur only with gibbus. In contrast, numerous
terms related to the field of Christian morality co-
occur with gibbosus, e.g., cupiditatis (lust), avarum
(stingy), modestia (moderation) and glorietur (boast).
In combination with close reading several text pas-
sages, the humanities scholar hypothesized that gib-
bus was rather used to describe physical features, and
gibbosus was mostly used in moral contexts. The hu-
manities scholar stated that dictionaries like the The-
IVAPP 2018 - International Conference on Information Visualization Theory and Applications
46
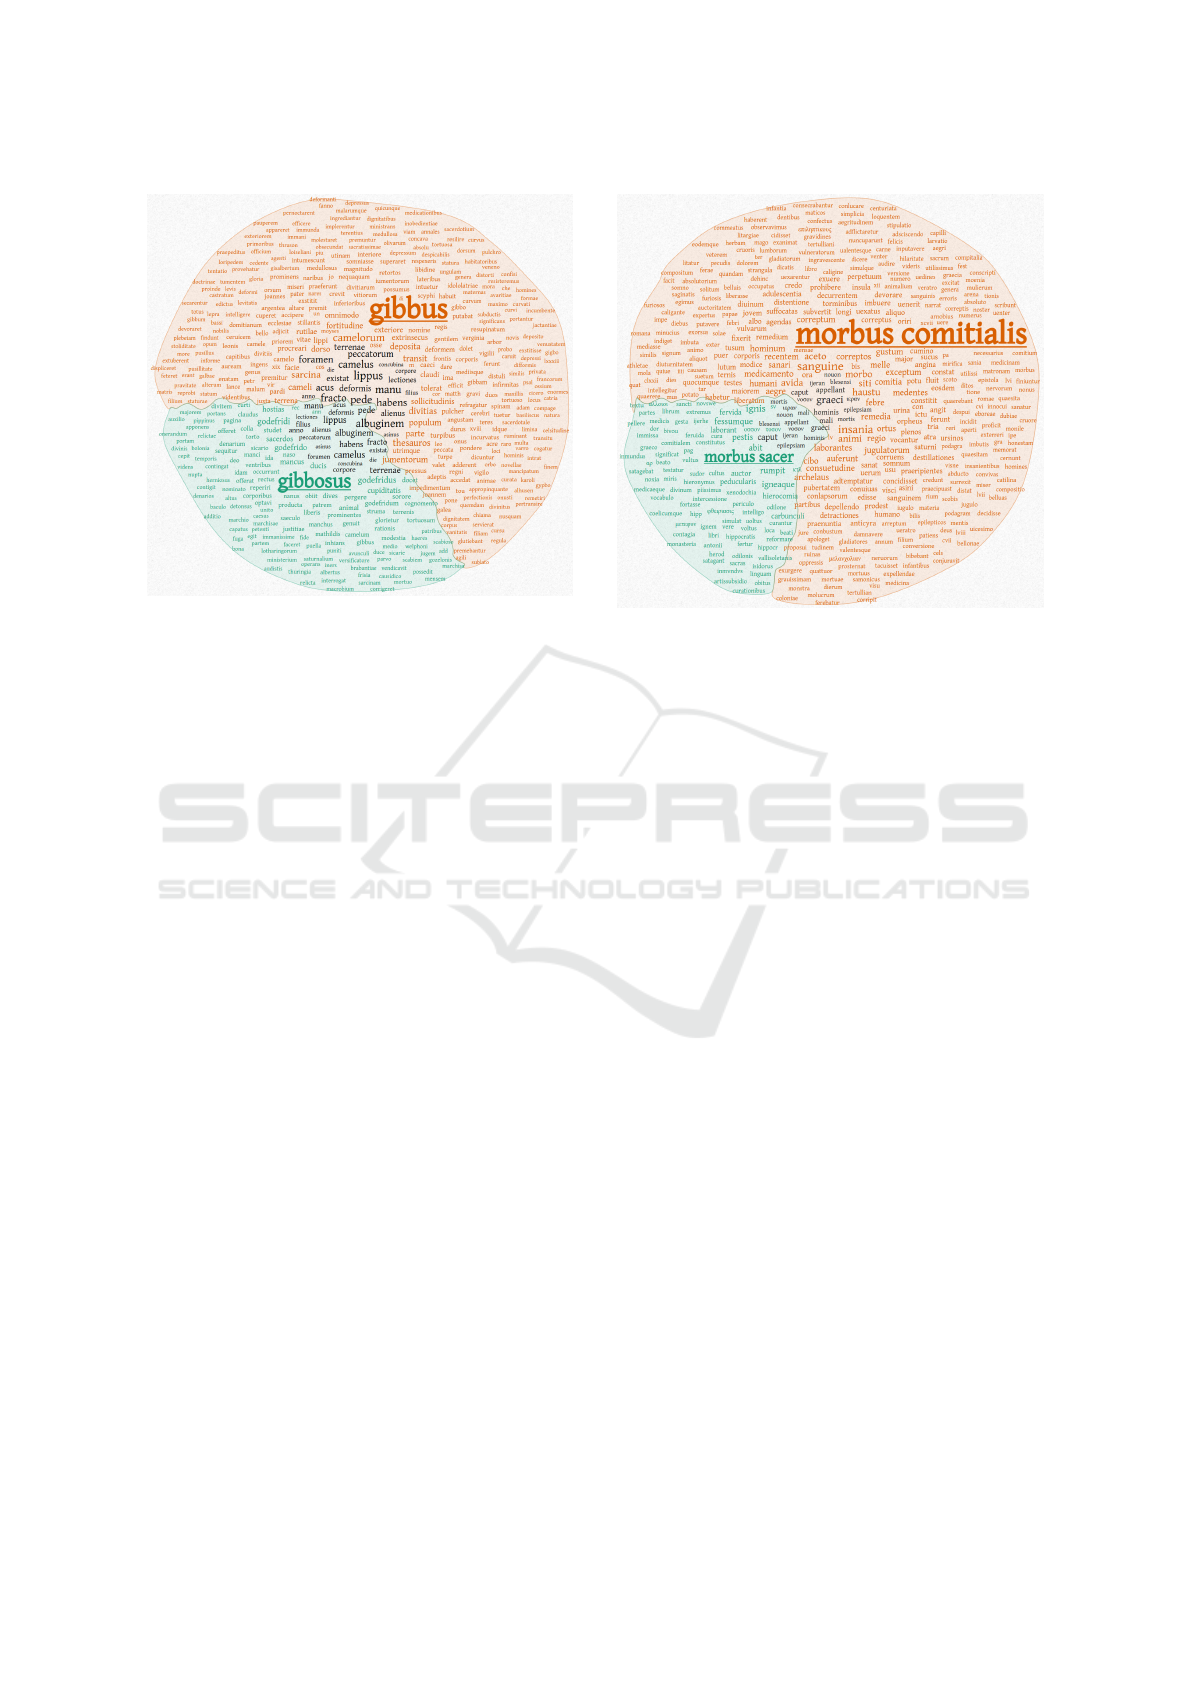
Figure 4: Comparing gibbus and gibbosus.
saurus Linguae Latinae communicate that both terms
were used in the actual physical meaning of “humpy”
as well as in a figurative sense. But, as opposed to
TagPies, dictionaries do not report about frequencies
and a tendency in which contexts either of the terms
was used. In that scenario, using TagPies was ben-
eficial as it surpasses the reconstructive character of
dictionaries by referring back to the actual usage of
terms in text corpora.
5.2 Comparing morbus comitialis and
morbus sacer
The second example narrates an unexpected insight
for a humanities scholar who wanted to verify her hy-
pothesis that the terms morbus comitialis and morbus
sacer were both similarly used to describe the disease
epilepsy. Two keyword-based search queries included
all possible cases:
morbus comitialis:
morbus&comitialis|morbi&comitialis|
morbo&comitiali|morbum&comitialem
morbus sacer:
morbus&sacer|morbi&sacri|morbo&sacro|
morbum&sacrum
The TagPie for the posed queries (Figure 5) supported
the scholar in examining three research questions:
• What is the semantic relationship between
both terms? In the center of the cloud the shared
tags graeci – appellant – ιεραν – νοσον, form-
ing the phrase “the Greeks – call it – holy – dis-
ease,” can be seen. This relationship indicates that
both terms were actually used as synonyms for
epilepsy in the classical period.
Figure 5: Comparing morbus comitialis and morbus sacer.
• Were the terms used to describe the dis-
ease in it’s medical or metaphorical meaning?
Whereas morbus sacer, literally translated as
“holy disease,” was rather used as an euphemistic
pseudonym for epilepsy, the co-occurrences of
morbus comitialis instead hypothesize a medi-
cal disease, e.g., shown by remedia (medicine),
medici (doctor), and medentes (curing).
• How was the overall knowledge about the dis-
ease at that time? The co-occurrences for both
terms, e.g., caput (head), insania (insanity), animi
(mind), corporis (body), nervorum (nerves), mor-
tis (death), and abit (died), indicate that epilepsy
was seen as a potentially lethal insanity with phys-
ical symptoms.
In order to generate these hypotheses, the scholar
often used the close reading functionality. When ex-
amining the last research question, the scholar dis-
covered that Maurus Servius Honoratus, a popular
grammarian in the 5th century, mistakenly conceived
epilepsy as a feverish disease, shown by co-occurring
terms of morbus sacer like ignis (fire) or carbunculi
(burning ulcer). As, in the first century, Pliny the El-
der already ascertained that fever is not a symptom of
epilepsy, the humanities scholar denoted this discov-
ery as not intutive, so that it would have never been
found using traditional methods.
5.3 Comparing τεχνη, υγιεια and νοσος
The third example investigates the meaning of art
in antiquity, a concept hard to describe nowadays.
The idea at that time was that art can be taught as
TagPies: Comparative Visualization of Textual Data
47
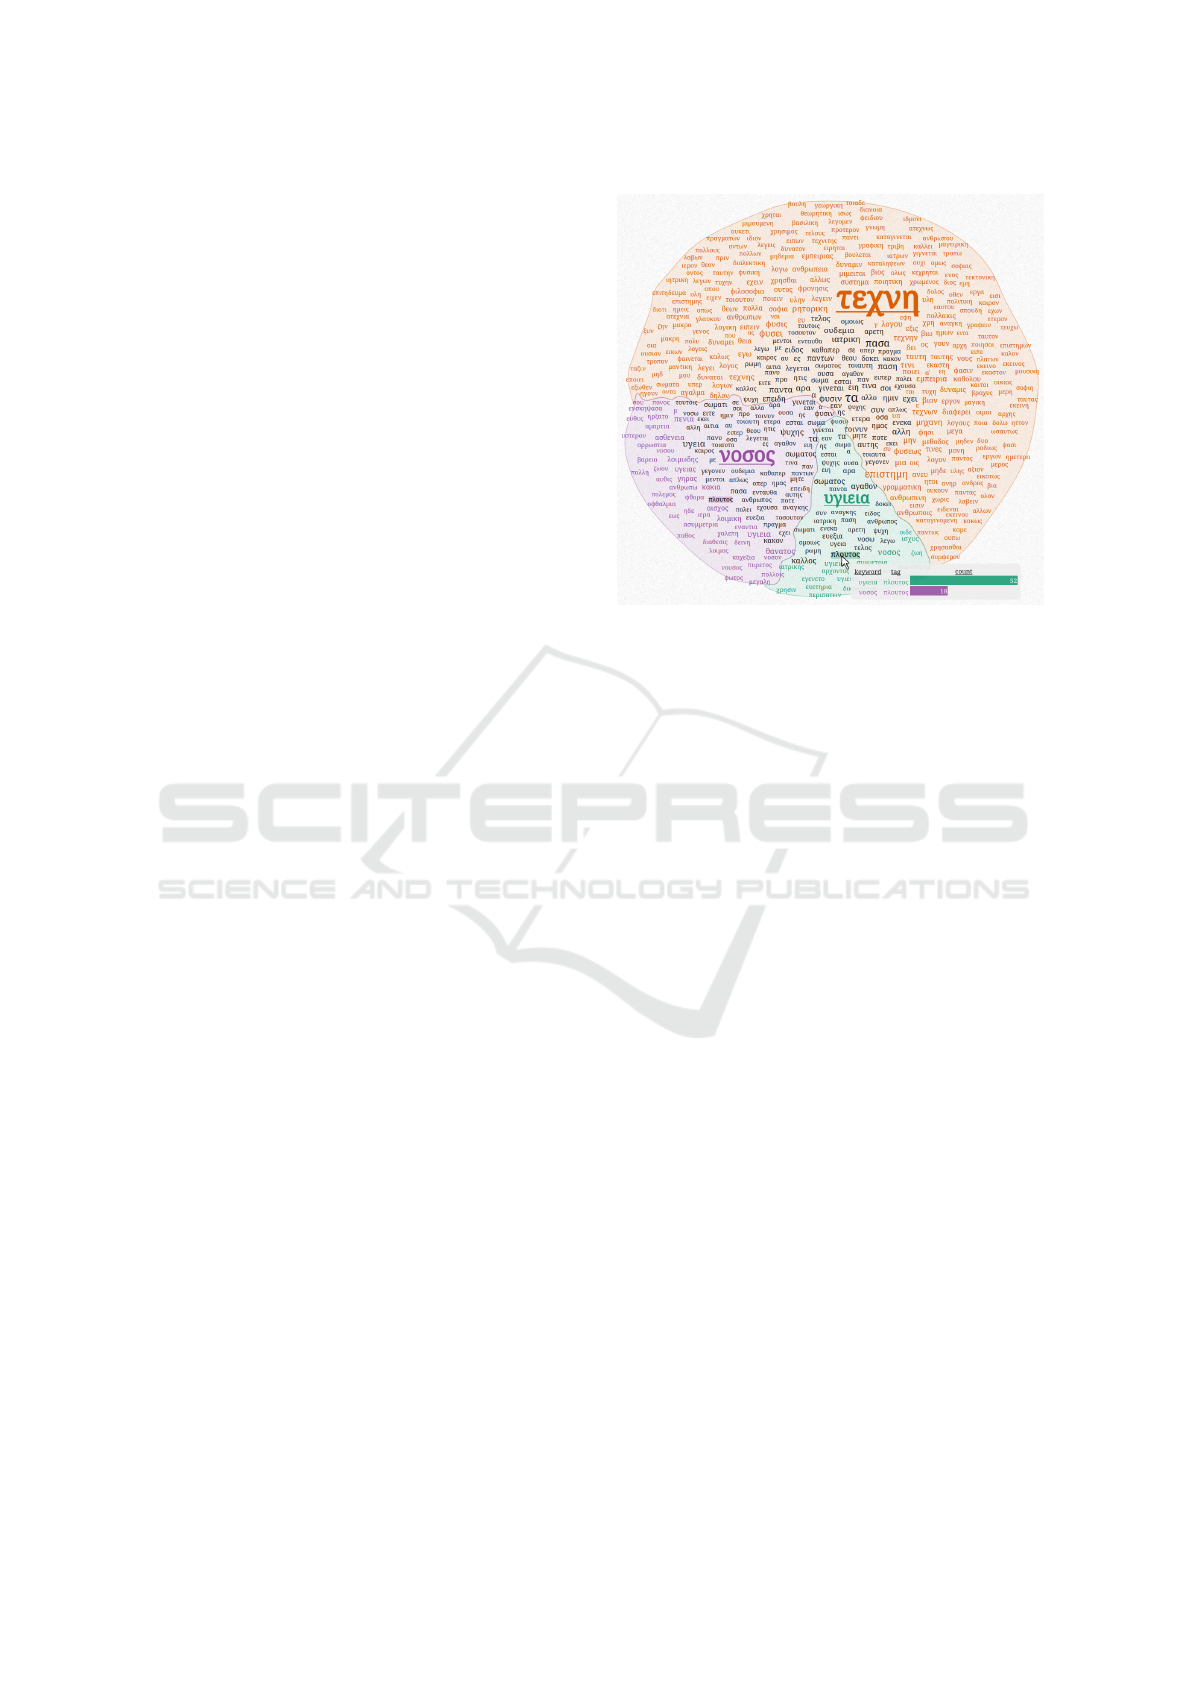
it includes knowledge. Therefore, art is related to
many fields in ancient Greek texts (Allen, 1999). Ex-
pectedly, the number of text passages for the ancient
Greek term for art, τεχνη, is enormous (6,216). The
fields of art are visible in the corresponding TagPie
shown in Figure 6 as co-occurrences: φυσικη (natu-
ral science), μαντικη (art of prophecy), γραμματικη
(grammar), ανθρωπινη (human art), διαλεκτικη (di-
alectic), ρητορικη (rhetoric), ποιητικη (poetics), ια-
τρικη (medicine), μαγικη (magic) etc.
The analysis of the general term τεχνη compared
to the more specific ancient Greek terms for health
(υγιεια) and disease (νοσος) composing the art of
physicians—medicine—was of particular interest for
one of the humanities scholars. So, she added two
further sections to the TagPie representing 1,013 text
passages for υγιεια and 2,092 text passages for νοσος.
In contrast to the diverse terms surrounding τεχνη, the
co-occurrences here are closely related to their main
terms. Both terms co-occur with parts of the body,
e.g., σωμα (body) and ψυχη (breath, life). Further-
more, υγιεια is related to positive terms like καλλος
(beauty), ισχυς (strength) or ηδονη (enjoyment),
whereas νοσος occurs together with rather negative
terms like λοιμικη (plague), ασθενεια (weakness),
γηρας (senility) or θανατος (death). Also, one of the
known reasons of diseases, poverty (πενια), co-occurs
71 times.
This scenario illustrates the capability of TagPies
for non-specific information discovery in a distant
reading manner; around 9,000 text passages are sum-
marized and dynamically accessible by clicking co-
occurring terms. This way, new hypotheses can be
generated and verified—impossible using only tradi-
tional close reading means. For example, the human-
ities scholar discovered a frequent usage of πλουτος
(wealth) in connection with υγιεια (52 times). Look-
ing at the references, five text passages in the biog-
raphy of Zeno of Elea (Vitae philosophorum, written
by Diogenes Laertius) are listed among others. In this
text, various things are denoted as good or bad. Zeno
of Elea categorizes neither health nor wealth as good,
since both terms can be used also in a negative con-
text. This example reveals another aspect of υγιεια in
a philosophical rather than a medical context. The hu-
manities scholar expected a correlation between med-
ical art and wealth as a consequence of the medical
profession after the 5th century BC in the context of
τεχνη, but πλουτος does not co-occur significantly.
Figure 6: Comparing τεχνη, υγιεια and νοσος.
6 DISCUSSION
The proposed tag cloud layout TagPies was designed
to support answering a novel type of research question
in classical philology. Some aspects of the collabora-
tive work are outlined below.
Evaluation. When developing TagPies and the user
interface for the eXChange project, we closely collab-
orated with six humanities scholars—three postdoc-
toral reseachers and three PhD students—who itera-
tively evaluated current prototypes. At first, we pro-
vided an interface consistent of a tag cloud showing
the co-occurrences of a single keyword search and
a basic close reading view in order to assess if the
methodology can work for the targeted comparative
approach. After positive feedback, we designed a first
circular layout according to the approach outlined in
Section 4. In that version, coloring the tags in depen-
dency on their category was one of the few design
criteria. Tough the humanities scholars were keen
working with the proposed visualization, they had
problems separating unique from shared terminology.
In the following, we prepared and discussed various
design variants, e.g., using different font styles or
adding bar glyphs to shared tags, without finding a
favorite solution. This situation pushed us to inves-
tigate further on the perception of objects as visual
groups. Finally, following the principles of Gestalt
theory yielded the agreed-upon TagPies design pre-
sented in this paper. In addition to design features,
which also included the selection of an appropriate
font family, the sorting method changed gradually,
so that tags with a particular relevance to an individ-
IVAPP 2018 - International Conference on Information Visualization Theory and Applications
48

ual data category move to the outer regions of a Tag-
Pie, and shared tags with a similar relevance to mul-
tiple categories are positioned in the center. All in
all, the collaborating humanities scholars of the eX-
Change project evaluated TagPies as comprehensible
and aesthetic, especially the pie chart style was per-
ceived as a suitable metaphor. In addition, we re-
ceived positive feedback from scholars using TagPies
to comparatively visualize textual data for investigat-
ing research questions in other domains. In that con-
text, one scholar rated TagPies as a visualization with
a “broad relevance to the entire field of digital human-
ities.”
Limitations. Our main objective was generating aes-
thetic, uniformly looking tag clouds that support in-
vestigating the given research tasks. To gain unifor-
mity, we start the Archimedean spiral to determine all
tag positions at the tag cloud origin. Especially, if a
TagPie consists of many data categories, an adjacent
placement of shared tags cannot be guaranteed. Then,
highlighting shared tags placed far apart requires us-
ing the provided interaction functionality. We ex-
perimented with moving the spiral origin to already
placed instances of shared tags or to borders between
TagPie sectors that share tags, but these approaches
destroyed the intended unity. Sometimes, humanities
scholars are interested in rare cases. TagPies aim to
visualize the most significant co-occurrences of the
given search terms. The more occurrences of a search
term exist, the more co-occurrences need to be dis-
played. Then, rare but potentially interesting cases
may be not shown due to the limited number of tags
positioned in a TagPie. Humanities scholars usually
compare a limited number of data categories (up to
five). In order to assess the scalability of our ap-
proach, we tried examples with more data categories.
Then, pie sectors become very small, so that tags are
hard to position. As a consequence, a sector might
decompose into several components, which destroys
the intended uniformity. Furthermore, effective, qual-
itative color maps are hard to define for a large num-
ber of data categories. Even though the gained re-
sults were satisfactory, TagPies produce best layouts
for few data categories.
7 CONCLUSION
For the humanities, the digital age brought changes
to the scholars’ research workflows. The ability to
query digital libraries in order to receive text passages
containing specific keywords on demand quickens hy-
potheses generation, but often, vast numbers of re-
sults are hard to process as text passages need to be
checked individually. Tag clouds can be used to facili-
tate the access to search results by aggregating the co-
occurrences of a searched keyword, so that frequent
collacates get salient and the context that defines the
meaning of a keyword gets visible. TagPies extend
this idea by arranging the co-occurrences of different
keyword searches in a pie chart manner, so that the
contexts in which different keywords occur can be an-
alyzed and compared to each other. This comparative
analysis was the desired capability of TagPies in the
corresponding digital humanities project.
During the development, we closely collaborated
with humanities scholars, who state that the resul-
tant visual interface, consistent of TagPies as a dis-
tant reading view for the results of several keyword
searches and a close reading view for the text pas-
sages, is a valuable analysis instrument that serves a
novel type of research interest that requires distant
reading arguments—the comparison of concepts in
classic texts—and provokes new research questions.
Furthermore, the humanities scholars mentioned that
they have a much more intuitive and dynamic access
to search results when using TagPies in comparison to
working with traditional result lists.
Besides their application to compare the co-
occurrences of words, TagPies are also used to sup-
port investigating other types of research questions
in the eXChange project, e.g., for exploring con-
cept search results of classical terminology (Cheema
et al., 2016a), or to facilitate the close reading of
texts (Cheema et al., 2016b). Furthermore, TagPies
are embedded in the Corpus Explorer
4
to support cor-
pus linguists in analyzing political texts. In order to
enable a wide applicability, we designed TagPies the
way that it can easily be adapted to textual data of
any domain. Representative examples are outlined by
J
¨
anicke (J
¨
anicke et al., 2016a), and some can be found
on the TagPies homepage.
5
ACKNOWLEDGEMENTS
The authors thank all humanities scholars involved in
the TagPies design process. We are furthermore in-
debted to Thomas Efer for maintaining the eXChange
project backend, and for providing interfaces required
to generate TagPies. This research was funded by the
German Federal Ministry of Education and Research.
4
Corpus Explorer: https://goo.gl/gKWJSX
5
http://tagpies.vizcovery.org/
TagPies: Comparative Visualization of Textual Data
49

REFERENCES
Allen, J. (1999). s.v. Kunst. Der Neue Pauly (DNP), Bd.
6:Sp. 915–919.
Barth, L., Kobourov, S., and Pupyrev, S. (2014). Experi-
mental Comparison of Semantic Word Clouds. In Ex-
perimental Algorithms, volume 8504 of Lecture Notes
in Computer Science, pages 247–258. Springer Inter-
national Publishing.
Bateman, S., Gutwin, C., and Nacenta, M. (2008). Seeing
Things in the Clouds: The Effect of Visual Features
on Tag Cloud Selections. In Proceedings of the Nine-
teenth ACM Conference on Hypertext and Hyperme-
dia, HT ’08, pages 193–202. ACM.
Beavan, D. (2008). Glimpses though the clouds: collocates
in a new light. In Proceedings of the Digital Humani-
ties 2008.
Beavan, D. (2011). ComPair: Compare and Visualise the
Usage of Language. In Proceedings of the Digital Hu-
manities 2011.
Binder, J. M. and Jennings, C. (2014). Visibility and mean-
ing in topic models and 18th-century subject indexes.
Literary and Linguistic Computing, 29(3):405–411.
Burch, M., Lohmann, S., Beck, F., Rodriguez, N., Di Sil-
vestro, L., and Weiskopf, D. (2014). RadCloud: Vi-
sualizing Multiple Texts with Merged Word Clouds.
In Information Visualisation (IV), 2014 18th Interna-
tional Conference on, pages 108–113.
Castell
`
a, Q. and Sutton, C. (2014). Word Storms: Multi-
ples of Word Clouds for Visual Comparison of Docu-
ments. In Proceedings of the 23rd International Con-
ference on World Wide Web, WWW ’14, pages 665–
676. ACM.
Cheema, M. F., J
¨
anicke, S., Blumenstein, J., and Scheuer-
mann, G. (2016a). A Directed Concept Search En-
vironment to Visually Explore Texts Related to User-
defined Concept Models. In Proceedings of the 11th
Joint Conference on Computer Vision, Imaging and
Computer Graphics Theory and Applications, pages
72–83.
Cheema, M. F., J
¨
anicke, S., and Scheuermann, G. (2016b).
AnnotateVis: Combining Traditional Close Reading
with Visual Text Analysis. In Workshop on Visual-
ization for the Digital Humanities, IEEE VIS 2016,
Baltimore, Maryland, USA.
Collins, C., Viegas, F., and Wattenberg, M. (2009). Par-
allel Tag Clouds to explore and analyze faceted text
corpora. In Visual Analytics Science and Technology,
2009. VAST 2009. IEEE Symposium on, pages 91–98.
Cui, W., Liu, S., Tan, L., Shi, C., Song, Y., Gao, Z., Qu,
H., and Tong, X. (2011). TextFlow: Towards Better
Understanding of Evolving Topics in Text. Visualiza-
tion and Computer Graphics, IEEE Transactions on,
17(12):2412–2421.
Cui, W., Liu, S., Wu, Z., and Wei, H. (2014). How Hier-
archical Topics Evolve in Large Text Corpora. Visu-
alization and Computer Graphics, IEEE Transactions
on, 20(12):2281–2290.
Cui, W., Wu, Y., Liu, S., Wei, F., Zhou, M., and Qu, H.
(2010). Context preserving dynamic word cloud vi-
sualization. In Pacific Visualization Symposium (Paci-
ficVis), 2010 IEEE, pages 121–128.
Diakopoulos, N., Elgesem, D., Salway, A., Zhang, A., and
Hofland, K. (2015). Compare Clouds: Visualizing
Text Corpora to Compare Media Frames. In Proc. of
IUI Workshop on Visual Text Analytics.
Eisenstein, J., Sun, I., and Klein, L. F. (2014). Ex-
ploratory Thematic Analysis for Historical Newspaper
Archives. In Proceedings of the Digital Humanities
2014.
Fankhauser, P., Kermes, H., and Teich, E. (2014). Combin-
ing Macro- and Microanalysis for Exploring the Con-
strual of Scientific Disciplinarity. In Proceedings of
the Digital Humanities 2014.
Gansner, E. R., Hu, Y., and Kobourov, S. (2010). Gmap: Vi-
sualizing graphs and clusters as maps. In 2010 IEEE
Pacific Visualization Symposium (PacificVis), pages
201–208.
Gibbs, F. and Owens, T. (2012). Building Better Digital Hu-
manities Tools: Toward broader audiences and user-
centered designs. Digital Humanities Quarterly, 6(2).
Gleicher, M., Albers, D., Walker, R., Jusufi, I., Hansen,
C. D., and Roberts, J. C. (2011). Visual Comparison
for Information Visualization. Information Visualiza-
tion, 10(4):289–309.
Harrower, M. and Brewer, C. A. (2003). ColorBrewer.org:
An Online Tool for Selecting Colour Schemes for
Maps. The Cartographic Journal, 40(1):27–37.
Havre, S., Hetzler, E., Perrine, K., Jurrus, E., and Miller, N.
(2001). Interactive Visualization of Multiple Query
Results. In Proceedings of the IEEE Symposium on
Information Visualization 2001 (INFOVIS’01), INFO-
VIS ’01, pages 105–, Washington, DC, USA. IEEE
Computer Society.
Hearst, M. and Rosner, D. (2008). Tag Clouds: Data Anal-
ysis Tool or Social Signaller? In Hawaii International
Conference on System Sciences, Proceedings of the
41st Annual, pages 160–160.
Hinrichs, U., Alex, B., Clifford, J., Watson, A., Quigley, A.,
Klein, E., and Coates, C. M. (2015). Trading Con-
sequences: A Case Study of Combining Text Mining
and Visualization to Facilitate Document Exploration.
Digital Scholarship in the Humanities.
Hinrichs, U., Forlini, S., and Moynihan, B. (2016). Spec-
ulative Practices: Utilizing InfoVis to Explore Un-
tapped Literary Collections. Visualization and Com-
puter Graphics, IEEE Transactions on, 22(1):429–
438.
J
¨
anicke, S. (2016). Valuable Research for Visualization and
Digital Humanities: A Balancing Act. In Workshop
on Visualization for the Digital Humanities, IEEE VIS
2016, Baltimore, Maryland, USA.
J
¨
anicke, S., Efer, T., Blumenstein, J., W
¨
ockener-Gade, E.,
Schubert, C., and Scheuermann, G. (2016a).
¨
Uber die
Nutzung von TagPies zur vergleichenden Analyse von
Textdaten. In Konferenzabstracts der Digital Human-
ities im deutschsprachigen Raum 2016.
J
¨
anicke, S., Franzini, G., Cheema, M. F., and Scheuermann,
G. (2015). On Close and Distant Reading in Digi-
tal Humanities: A Survey and Future Challenges. In
IVAPP 2018 - International Conference on Information Visualization Theory and Applications
50

Borgo, R., Ganovelli, F., and Viola, I., editors, Eu-
rographics Conference on Visualization (EuroVis) -
STARs. The Eurographics Association.
J
¨
anicke, S., Franzini, G., Cheema, M. F., and Scheuermann,
G. (2016b). Visual Text Analysis in Digital Humani-
ties. Computer Graphics Forum.
J
¨
anicke, S. and Scheuermann, G. (2016). TagSpheres: Visu-
alizing Hierarchical Relations in Tag Clouds. In Pro-
ceedings of the 11th Joint Conference on Computer
Vision, Imaging and Computer Graphics Theory and
Applications, pages 15–26.
J
¨
anicke, S. and Scheuermann, G. (2017). On the Visual-
ization of Hierarchical Relations and Tree Structures
with TagSpheres. In Braz, J., Magnenat-Thalmann,
N., Richard, P., Linsen, L., Telea, A., Battiato, S., and
Imai, F., editors, Computer Vision, Imaging and Com-
puter Graphics Theory and Applications: 11th Inter-
national Joint Conference, VISIGRAPP 2016, Rome,
Italy, February 27 – 29, 2016, Revised Selected Pa-
pers, pages 199–219. Springer International Publish-
ing, Cham.
Koch, S., John, M., Worner, M., Muller, A., and Ertl, T.
(2014). VarifocalReader – In-Depth Visual Analysis
of Large Text Documents. Visualization and Com-
puter Graphics, IEEE Transactions on, 20(12):1723–
1732.
Lee, B., Riche, N., Karlson, A., and Carpendale, S. (2010).
SparkClouds: Visualizing Trends in Tag Clouds. Visu-
alization and Computer Graphics, IEEE Transactions
on, 16(6):1182–1189.
Liu, X., Shen, H.-W., and Hu, Y. (2014). Supporting mul-
tifaceted viewing of word clouds with focus+context
display. Information Visualization.
Lohmann, S., Ziegler, J., and Tetzlaff, L. (2009). Compari-
son of Tag Cloud Layouts: Task-Related Performance
and Visual Exploration. In Human-Computer Interac-
tion - INTERACT 2009, volume 5726 of Lecture Notes
in Computer Science, pages 392–404. Springer Berlin
Heidelberg.
Milgram, S. and Jodelet, D. (1976). Psychological Maps of
Paris. Environmental Psychology, pages 104–124.
Montague, J., Simpson, J., Rockwell, G., Ruecker, S., and
Brown, S. (2015). Exploring Large Datasets with
Topic Model Visualizations. In Proceedings of the
Digital Humanities 2015.
Moretti, F. (2005). Graphs, Maps, Trees: Abstract Models
for a Literary History. Verso.
Munzner, T. (2009). A Nested Model for Visualization
Design and Validation. Visualization and Computer
Graphics, IEEE Transactions on, 15(6):921–928.
Murugesan, S. (2007). Understanding Web 2.0. IT Profes-
sional, 9(4):34–41.
Oelke, D. and Gurevych, I. (2014). A Study on Human-
Generated Tag Structures to Inform Tag Cloud Lay-
out. In Proceedings of the 2014 International Work-
ing Conference on Advanced Visual Interfaces (AVI
2014), pages 297–304. ACM.
Paulovich, F. V., Toledo, F., Telles, G. P., Minghim, R.,
and Nonato, L. G. (2012). Semantic Wordification of
Document Collections. In Computer Graphics Forum,
volume 31, pages 1145–1153. Wiley Online Library.
Schrammel, J., Leitner, M., and Tscheligi, M. (2009).
Semantically Structured Tag Clouds: An Empirical
Evaluation of Clustered Presentation Approaches. In
Proceedings of the SIGCHI Conference on Human
Factors in Computing Systems, CHI ’09, pages 2037–
2040. ACM.
Schrammel, J. and Tscheligi, M. (2014). Patterns in the
Clouds - The Effects of Clustered Presentation on Tag
Cloud Interaction. In Building Bridges: HCI, Visu-
alization, and Non-formal Modeling, Lecture Notes
in Computer Science, pages 124–132. Springer Berlin
Heidelberg.
Seifert, C., Kump, B., Kienreich, W., Granitzer, G., and
Granitzer, M. (2008). On the Beauty and Usability
of Tag Clouds. In Information Visualisation, 2008. IV
’08. 12th International Conference, pages 17–25.
Sinclair, J. and Cardew-Hall, M. (2008). The folksonomy
tag cloud: when is it useful? Journal of Information
Science, 34(1):15–29.
Viegas, F. and Wattenberg, M. (2008). TIMELINES: Tag
Clouds and the Case for Vernacular Visualization. in-
teractions, 15(4):49–52.
Viegas, F., Wattenberg, M., and Feinberg, J. (2009).
Participatory Visualization with Wordle. Visualiza-
tion and Computer Graphics, IEEE Transactions on,
15(6):1137–1144.
Viegas, F., Wattenberg, M., van Ham, F., Kriss, J., and
McKeon, M. (2007). ManyEyes: a Site for Visual-
ization at Internet Scale. Visualization and Computer
Graphics, IEEE Transactions on, 13(6):1121–1128.
Vuillemot, R., Clement, T., Plaisant, C., and Kumar, A.
(2009). What’s being said near ”Martha”? Explor-
ing name entities in literary text collections. In Visual
Analytics Science and Technology, 2009. VAST 2009.
IEEE Symposium on, pages 107–114.
Waldner, M., Schrammel, J., Klein, M., Kristj
´
ansd
´
ottir, K.,
Unger, D., and Tscheligi, M. (2013). FacetClouds:
Exploring Tag Clouds for Multi-dimensional Data.
In Proceedings of Graphics Interface 2013, GI ’13,
pages 17–24. Canadian Information Processing Soci-
ety.
Ware, C. (2013). Information Visualization: Perception for
Design. Elsevier.
Wu, Y., Provan, T., Wei, F., Liu, S., and Ma, K.-L. (2011).
Semantic-Preserving Word Clouds by Seam Carving.
In Computer Graphics Forum, volume 30, pages 741–
750. Wiley Online Library.
TagPies: Comparative Visualization of Textual Data
51
