
Automatic Identification of Macular Edema in Optical Coherence
Tomography Images
Gabriela Samagaio
1
, Aída Estévez
4
, Joaquim de Moura
1,2
, Jorge Novo
1,2
, Marcos Ortega
1,2
and María Isabel Fernández
3,4,5
1
Department of Computing, University of A Coruña, A Coruña, Spain
2
CITIC- Research Center of Information and Communication Technologies, University of A Coruña, A Coruña, Spain
3
Instituto Oftalmológico Gómez-Ulla, Santiago de Compostela, Spain
4
Department of Ophthalmology, Complejo Hospitalario Universitario de Santiago, Santiago de Compostela, Spain
5
University of Santiago de Compostela, Santiago de Compostela, Spain
Keywords:
Computer Aided Diagnosis, Retinal Imaging, Optical Coherence Tomography, Macular Edema.
Abstract:
This paper proposes a novel system for the simultaneous identification and characterization of the three types
of Macular Edema (ME) in Optical Coherence Tomography (OCT). These MEs are clinically defined, by the
reference classification of the field, as: Serous Retinal Detachment (SRD), Diffuse Retinal Thickening (DRT)
and Cystoid Macular Edema (CME). Our system uses multilevel image thresholding approaches to identify
the SRD and CME cases and a learning approach for the DRT identification. The system provided promising
results with F-Measures of 83.35% and 81.95% for the DRT and CME detections, respectively. It was also
efficient in detecting all the SRD cases included in the testing image dataset. The system was able to identify
individually the different types of ME on the OCT images but it was also capable to detect simultaneously the
existence of the three ME cases when they appeared merged in the lower retinal layers.
1 INTRODUCTION
According to the World Health Organization, 9.6% of
the European citizens are affected by blindness dise-
ases, situation that is even worse in developing coun-
tries. As reference, in Sub-Saharan Africa, it can re-
ach until 50% of the population. For the last ten years,
cataracts have remained as the main cause of visual
impairment, followed by macular disorders (WHO,
2012). One of the most relevant of them is the Ma-
cular Edema (ME), defined as intraretinal fluid accu-
mulation that affects the central retinal vision, suffe-
ring morphological alterations in the retinal structures
(Trichonas and Kaiser, 2014).
To diagnose these retinal diseases, ophthalmolo-
gists normally support their clinical evaluations in the
analysis of different types of eye fundus images. One
of the most widely used in this field is the OCT image
modality. This technique allows a non-invasive and
contactless evaluation of the in vivo histopathology
(Helmy and Allah, 2013). Based on this image mo-
dality, in (Otani et al., 1999), a clinical classifica-
tion was established for the different types of ME
that can be identified. This classification is the re-
ference of the field, being clinically used worldwide
by specialists. Intraretinal fluid accumulation was de-
fined in three types based on clinical characteristics
of the images, mainly properties as retinal thickness,
reflectivity or area of the abnormalities. These three
types are: Serous Retinal Detachment (SRD), Dif-
fuse Retinal Thickening (DRT) and Cystoid Macu-
lar Edema (CME). Posteriorly, in the work of (Pa-
nozzo et al., 2004), they also characterized each type
by the definition of 5 parameters: retinal thickness,
diffusion, volume, morphology and epiretinal traction
(Baamonde et al., 2017).
Figure 1 illustrates the presence of the three types
of MEs, where the SRD and the CME cases are hypo-
reflective fluid regions with a specific swollen shape
within the retinal layers, as described by the authors.
Usually, the SRD edemas appear as a dome-shape in
the outer retina while the CME typically appears as
a circular shape in the inner retina, (Joussen et al.,
2010). In the case of the DRT edemas, they are ty-
Samagaio, G., Estévez, A., Moura, J., Novo, J., Ortega, M. and Fernández, M.
Automatic Identification of Macular Edema in Optical Coherence Tomography Images.
DOI: 10.5220/0006544105330540
In Proceedings of the 13th International Joint Conference on Computer Vision, Imaging and Computer Graphics Theory and Applications (VISIGRAPP 2018) - Volume 4: VISAPP, pages
533-540
ISBN: 978-989-758-290-5
Copyright © 2018 by SCITEPRESS – Science and Technology Publications, Lda. All rights reserved
533

pically characterized by a "sponge-like" swelling ap-
pearance that results from the spread of fluid in the
outer retina.
To diagnose these types of diseases, in the recent
years, computational systems have been broadly used
by ophthalmologists as useful tools that allow the di-
agnosis (even in early stages), treatment and moni-
toring of the evolution of the patients. In this field,
some works based on the OCT image analysis are
taking initial approaches to help and support the cli-
nical decisions in the analysis of the ME. Therefore,
some efforts have been applied in order to detect the
intraretinal fluid on the OCT images, where particu-
lar characteristics are used as intensity, morphology,
relative position and central and parafoveal retinal
thickness (Willoughby et al., 2017; Montuoro et al.,
2017). At the moment, none of the published works
faced the three types of ME that appear in the macu-
lar region. As reference, in the work of (Sidibé et al.,
2017), the authors proposed a method based on the
Gaussian Mixture Model (GMM) to classify the OCT
scans as normal and abnormal patients. Following a
similar strategy, others (Montuoro et al., 2017) iden-
tified abnormal OCT images. In this case, they per-
form a simultaneous 3D segmentation of the retinal
layers with the identification of two fluid regions as
intraretinal fluid and Sub Retinal Fluid (SRF) using
a graph-theoretic approach. The method of (Alsaih
et al., 2017) used learning strategies in OCT retinal
images in order to identify normal volumes versus vo-
lumes with ME presence. This analysis was based on
the evaluation of the retinal thickening, hard exuda-
tes, intraretinal cystoid space formation, and subre-
tinal fluid. In the case of (González et al., 2013), a
method is proposed to detect the presence of cysts.
A Watershed algorithm is applied within the retinal
tissue in order to find all the possible regions in the
image which might conform cystoid structures. Fi-
nally, in order to discard false positives, a learning
strategy is applied to reduce the false positive set. The
authors from (de Moura et al., 2017) proposed a met-
hod to identify the intraretinal cystoid regions, as re-
gions of the OCT images that contain cysts. Hence,
they defined a window size to analyze and extracts a
set of image characteristics to determine the presence
of cysts inside those regions.
In this paper, we propose a novel system to detect
and characterize the intraretinal fluid as SRD, DRT
and CME types, based on the clinical classification of
reference in the field, the Otani classification. As in-
dicated, to date, no other work faced completely the
automatic identification of all the types of ME. To find
the 3 types of ME, we firstly delimited the retinal area
in the OCT images, where the intraretinal fluid forms
the swollen regions. Following the Otani ME clini-
cal characterization, we identify the presence of each
type inside this region of interest.
The system will provide help in the standardi-
zation of the identification of the different types of
ME, reducing the subjectivity of the ophthalmolo-
gists. Moreover, given the complexity of extraction
of some ME cases, the proposed system will facilitate
the doctor’s work, allowing the early diagnosis and
consequently the procedure with more adjusted treat-
ments, improving the life quality of the patients.
2 METHODOLOGY
The proposed system receives, as input, an OCT re-
tinal image centered in the macula. Firstly, the sy-
stem segments automatically the retinal layers to de-
limit the region of interest (ROI) where the MEs are
present. Inside this region, different strategies were
applied to detect the 3 types of ME: SRD, DRT and
CME, as illustrated in the diagram of Fig. 2.
The system was subdivided in three main steps for
each ME search. Regarding SRD detection, a multi
level adaptive image thresholding was used in order
to find candidates with the lower intensity profiles.
To discard the false positives detections, different ru-
les based on the clinical knowledge were implemen-
ted. Hence, the candidates should have the specific
relative position inside the retinal layers as well as a
particular morphological shape (dome-shape). A si-
milar strategy was used to detect the CME cases, as
they also present a defined ovoid shape with a con-
trast with the retinal layers. An image thresholding
method was used to identify CME candidates, follo-
wed by a filtering process of several morphological
conditions as a way of increasing the efficiency of the
proposed system. Finally, DRT edemas do not pre-
sent well-defined boundaries and sufficient contrast
with the surrounding tissue. In this way, a learning
strategy was used to distinguish the "sponge-like" re-
gions from the normal regions.
2.1 Retinal Layer Segmentation
Given the noisy characteristics of the input OCT ima-
ges, a median filter was applied as a pre-processing
step, clearing the image and preserving, simultane-
ously, the properties of the retinal layers in order to
facilitate the posterior identifications.
In this work, 4 retinal layers were identified as
they provide the correct delimitation of the regi-
ons where the different types of ME typically ap-
pear. The identified retinal layers are: Inner Limiting
VISAPP 2018 - International Conference on Computer Vision Theory and Applications
534
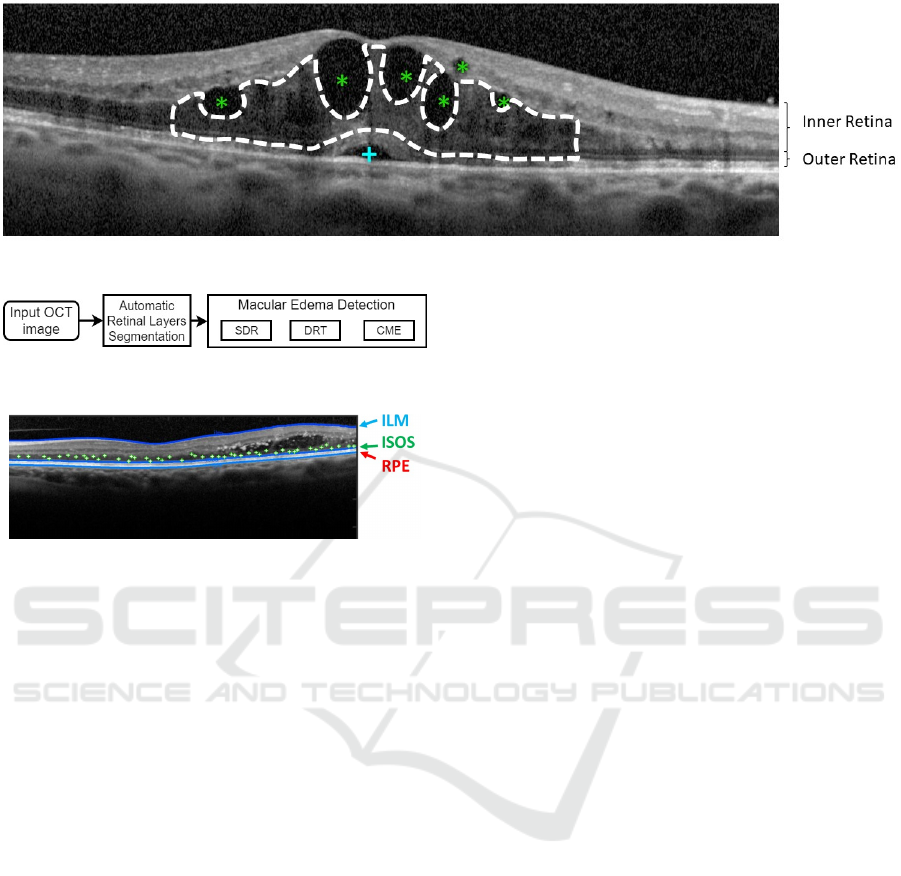
Figure 1: Example of OCT retinal image with 3 types of MEs: SRD (+), CME (*) and DRT (- -).
Figure 2: Main methodology steps for the ME identification
and characterization in SRD, DRT and CME types.
Figure 3: Example of OCT retinal image with N seeds rand-
omly generated, near the ISOS layer.
Membrane (ILM), Outer Plexiform Layer (OPL), the
junction of Inner and Outer Segments (ISOS) of the
photoreceptors layers and the Retinal Pigment Epit-
helium (RPE).
We used an approach based on the work of (Chiu
et al., 2010) to identify the indicated retinal layers.
In particular, this automatic approach uses graph the-
ory and dynamic programming to represent each OCT
image as a graph of nodes, connecting optimum paths
from both sides of the image. Firstly, the algorithm
calculates dark-to-light gradient images, identifying
adjacent layers and generating weights for the layer
segmentations. The progressive identification of the
main layers of the retina was found by the minimum
weighted paths using the (Dijkstra, 1959) algorithm.
This approach detects eight different layers in normal
and healthy OCT retinal images. However, for this
purpose, we adapted the method to identify 3 specific
layers: ILM, ISOS and RPE.
Regarding the OPL layer, we followed a different
strategy given the deteriorated conditions of the reti-
nal layers that presents the used images of this work.
In order to solve this issue, the previous identi-
fication of the ISOS layer was used as reference for
the application of region growing (Zhu and Yuille,
1996). Therefore, over this layer N initial points as
seeds were randomly generated, as shown in Fig. 3.
The number of seeds corresponds to a 5% of the in-
put image width. Hence, we use, as baseline, the
ISOS layer to extract the region immediately over it
that corresponds to the OPL layer. Using a signifi-
cant number of seeds along the image we guarantee
the OPL extraction even in significantly deteriorated
conditions that present ME cases in advance stages.
2.2 Division in ILM/OPL and
OPL/RPE Regions
As enunciated before, ME consists of the accumula-
tion of fluid within the retinal area. However, each
type of edema typically appears in particular regions
inside the retinal layers that are delimited by the ILM
and RPE retinal layers, as shown in Fig. 4.
According to the Otani classification, SRD and
DRT edemas usually appear in the outer retina whe-
reas CME edemas normally start manifesting in the
inner retina, but they can proliferate to the outer retina
in more severe pathological stages, merging with the
DRT cases (Gelfand et al., 2012). Therefore, based
on the previous ROI segmentation that delimits the
retinal tissue, 2 sub-regions were identified: one cor-
responding to the inner retinal and other for the outer
retina. The inner retina is comprehended between the
ILM and the OPL layers, while the outer retina is deli-
mited between the OPL and the RPE layers, as shown
in Fig. 5. Thus, the detection of each type of intrare-
tinal fluid is simplified, as the region to find each ME
type is reduced.
2.3 SRD Detection
SRD edemas are typically defined as hiporeflective
fluid accumulation presenting a dome-shape, with a
characteristic relative position inside the retinal tis-
sue. Therefore, the proposed system was inspired in
these heuristics to automatically identify the SRD pre-
sence.
Firstly, a multi level thresholding, based on the
method of (Otsu, 1979), was applied only in the ou-
Automatic Identification of Macular Edema in Optical Coherence Tomography Images
535
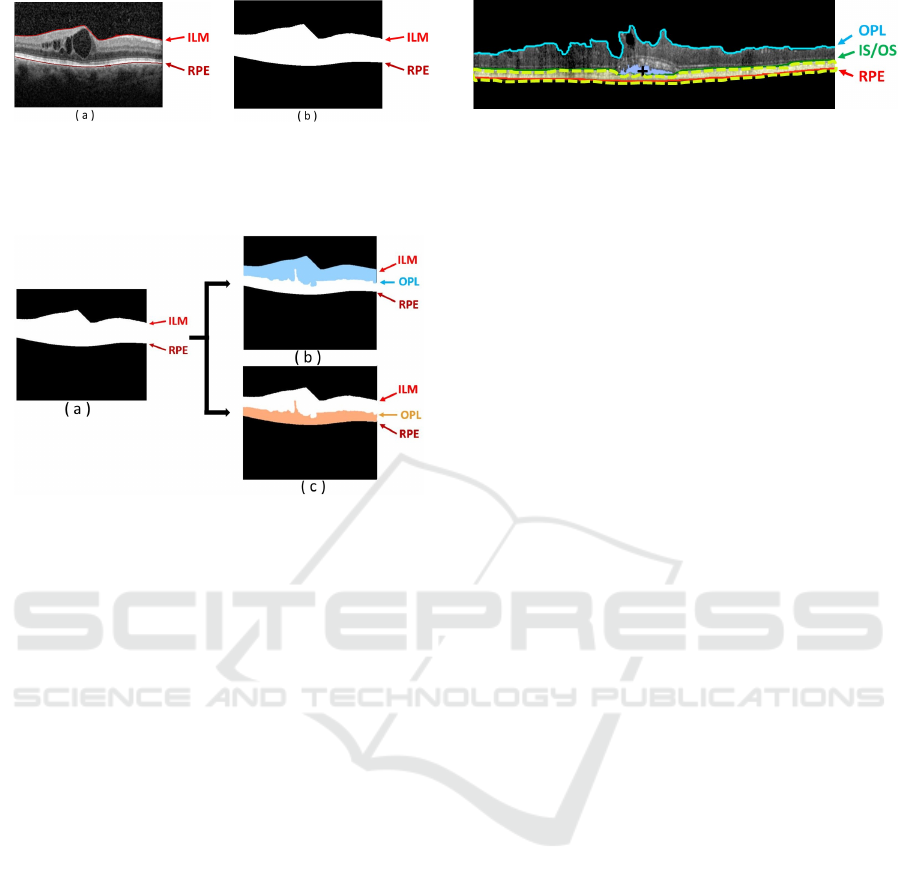
Figure 4: Example of OCT retinal image. (a) OCT image
with the presence of CME edemas. (b) Binary image mask
with the delimitation of the ROI between the ILM and the
RPE retinal layers.
Figure 5: Inner and Outer regions of interest. (a) Entire
ROI. (b) Inner retina between the ILM and the OPL retinal
layers. (c) Outer retina between the OPL and RPE retinal
layers.
ter retina. With this thresholding, we identify the re-
gions with the lower intensity profiles as candidates
for being SRD edema. For that, the optimal thres-
hold was determined with the value that maximizes
the separability between the intraretinal fluid regions
and the retinal layers (Noma et al., 2011; Gupta et al.,
2013).
Next, the objective is the removal of those candi-
dates that do not fulfill the medical restrictions that
characterize SRD edemas. Following this medical re-
strictions, several conditions were implemented ensu-
ring that the system detects efficiently the SRD ede-
mas. These conditions are:
• Relative position. This type of edemas should stay
near the photoreceptors layer, (Carmona and Her-
nández, 2015);
• Area size, bigger than 200µm
2
. We selected, as
reference, the area of the microcystic macular
edema (Gelfand et al., 2012; Wolff et al., 2014);
• Fusiform morphology. The width that should be
within an empirical range, [200 - 980]µm equiva-
lent to [51 - 250] pixels, the typical lengths that
they normally present;
• Constriction of the photoreceptors region. The
SRD leads to a decrease of the region thickness
delimited between the ISOS and the RPE layers in
the parafoveal zone (Ooto et al., 2010). Therefore,
Figure 6: Example of OCT with the final ROI where was
removed the region of the SRD edema (+) and the photore-
ceptor layer (- -).
near the fovea, we compared the mean thickness
of the empirical window size and the global mean
thickness of the ISOS/RPE region. The result
should be less than 1 to consider the presence of
candidates for being SRD edemas;
• The intensity of the area above SRD edema. This
region should have a higher intensity profile when
compared with the fluid region, (Ooto et al.,
2010). This occurs because of part of the photo-
receptors layer usually stays above the SRD ede-
mas, as a brighter region. Hence, the mean inten-
sity of the candidate is compared with the mean
intensity of the photoreceptors layer, using the
same empirical window size.
As SRD edema, if present, only appears one per
image, if two or more candidates fulfill all these con-
ditions, the system will preserve the candidate that is
more centered, near the fovea.
Finally, using the SRD detection as seed, a region
growing is employed to obtain the SRD segmentation
as more precise as possible. This precise extraction is
useful in posterior stages of the method. An example
of the SRD segmentation is presented in Fig. 6.
2.4 DRT Detection
DRT or "sponge-like" edema is defined by the speci-
alists as a retinal swelling of the macula with reduced
intraretinal reflectivity. Also, this edema is typically
located in the inner retina, being usually above the
photoreceptor layer. Therefore, to find this type of
intraretinal fluid accumulation, the proposed system
searches for the DRT appearance in the OPL/RPE re-
gion, but removing the photoreceptors region and the
SRD edema, when it is detected. The precise ex-
traction of the SRD edema in the previous stage faci-
litates the SRD removal to calculate the new region of
interest. Hence, the correction of the OPL/RPE region
can be achieved accurately, resulting in a new region
equivalent to the OPL/ISOS, decreasing the detection
of false candidates with a more precise and restricted
region to detect the DRT presence.
As this type of edema does not have a well-defined
morphological shape and contour, simple methods ba-
sed on image processing techniques are not sufficient
VISAPP 2018 - International Conference on Computer Vision Theory and Applications
536
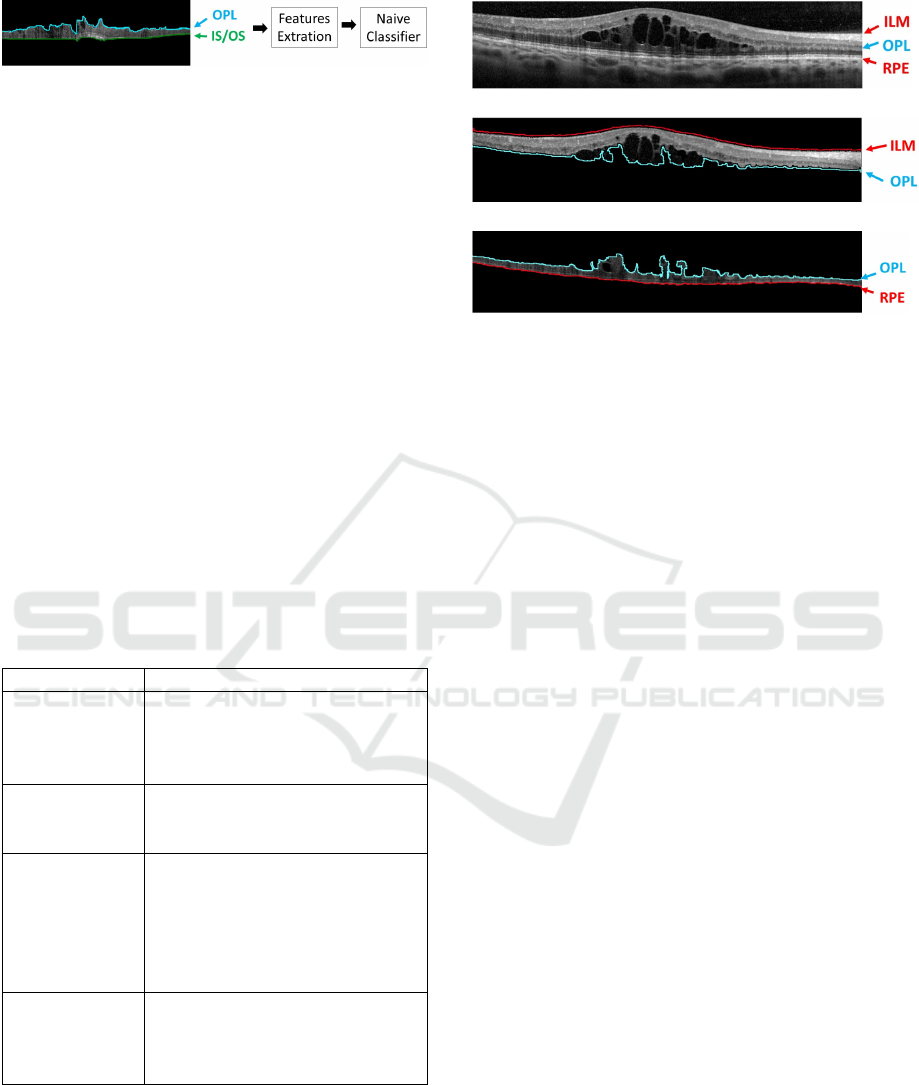
Figure 7: Example of OCT image with the new baseline on
the OPL/ISOS region. The Naive Bayes classifier is trained
by the feature extraction from each "esponge-like" columns.
to produce acceptable results. Therefore, in this step,
a learning strategy was implemented using the Naive
Bayes classifier, extracting features per column from
the OPL/RPE region and identifying the DRT pre-
sence, as illustrated in the diagram of Fig. 7. We
used Naive Bayes as a frequently used classifier in
medical imaging approaches. The extracted featu-
res were based mainly on intensity and texture featu-
res. Moreover, another relevant property is the retinal
thickness, as MEs normally produce the fluid accu-
mulation inside the retinal layers and, therefore, the
increment of their thickness (Goebel and Kretzchmar-
Gross, 2002). We used this property also as an indi-
cator of the disease presence.
Table 1 details the 18 features that were imple-
mented to identify the DRT presence. A Sequential
Forward Selection (SFS) method was applied to the
feature set to reduce the array dimensionality and pre-
serve those with the highest discriminative power.
Table 1: List of the 18 features to identify the DRT pre-
sence.
N
o
of Features Feature
- Intensity Image Analysis:
1 - 6 Maximum, Minimum,
Mean, Median,
Standard-deviation and Variance
- Histogram Image Analysis:
7 - 10 Obliquity, Kurtosis,
Energy and Entropy
- Mask Height Analysis:
Height of OPL/RPE region,
11 -14 Height of mask ILM/RPE
The ratio between the heights of
OPL/RPE and the ILM/RPE re-
gions
- Texture Analysis:
15 -18 GLCM method: Contrast,
Correlation, Energy and
Homogeneity
2.5 CME Detection
Cysts typically present a low intensity profile with a
significant contrast with the ILM/OPL region, where
they frequently appear. A multilevel thresholding, ba-
sed on the Otsu’s algorithm, was also implemented in
(a)
(b)
(c)
Figure 8: Example of OCT image with the presence of
CMEs. (a) Input OCT retinal image. (b) CMEs represented
as (*) in the ILM/OPL region. (c) CMEs (*) in OPL/RPE
region with lower contrast compared to the surrounded reti-
nal layer.
this stage, due to the contrast between the ILM/OPL
region and the CMEs, identifying all the candidates
for being cysts. Due to the relative high number of
detected false positives, a post processing stage was
implemented to preserve the real existing ones. As we
can retrieve partial segmentations (even several candi-
dates for the same cyst), we completed the segmenta-
tions using Watershed. This way, we obtain more de-
fined reliable regions for the candidates that facilitate
the posterior analysis and the false positive reduction.
Hence, using as reference the clinical properties that
the specialists follow to identify the cysts, we imple-
mented a list of conditions to preserve the real CMEs
from the list of candidates (Wolff et al., 2014; Joussen
et al., 2010; Helmy and Allah, 2013). These conditi-
ons are listed below:
• Area size, bigger than 1µm
2
. To discard noisy and
tissue artifacts;
• Eccentricity, should be smaller than 0.98 to re-
spect the ovoid shape. This parameter is the ra-
tio of the distance between the central point of the
ellipse and its major axis length;
• Retinal thickness, the ROI (ILM/RPE) thickness
should be bigger than 250µm equivalent to 64
pixels. This value corresponds to the nor-
mal size of the parafoveal region, (Goebel and
Kretzchmar-Gross, 2002);
• The width of the candidate area should be inside
a range of sizes [40 - 530]µm equivalent to [10
- 135] pixels. This way, the range ensures that
the area of the candidates should be able to re-
move small artifacts and regions with a length that
is approximately twice the normal of the retinal
thickness.
Automatic Identification of Macular Edema in Optical Coherence Tomography Images
537

Basically, the restrictions are based in terms of area,
eccentricity, retinal layer thickness as well as the
thickness between the specific retinal layers. As in-
dicated before, the presence of CMEs leads to an in-
crease of the retinal layers where the fluid is accumu-
lated, and consequently, produce a global increment
of the retinal tissue (ILM/RPE region).
As Fig. 8 shows, it is possible to conclude that
the large majority of CMEs are within the ILM/OPL
region. However, in more advanced pathological sta-
ges, they can also proliferate to the OPL/RPE region.
In the outer region the contrast is lower, which makes
the identification of the existing CMEs a more com-
plex issue. In this case, we followed the same strategy
as before, but adapting the parameters to the new con-
ditions.
3 RESULTS AND DISCUSSION
As presented, the proposed system includes three dif-
ferent strategies to identify each ME type. All the
strategies were tested using an image dataset that is
composed by 50 OCT retinal images, centered in the
macula, with a resolution of 2032 × 596 pixels. This
dataset was acquired with a Spectralis
R
OCT confo-
cal scanning laser ophthalmoscope from Heidelberg
Engineering.
To ensure the efficiency of the system all the ima-
ges were labeled by an expert clinician, identifying
the location of the 3 types of MEs inside each scan.
Based on this ground-truth, we constructed the trai-
ning and testing sets for the DRT identification ap-
proach as well as validated the performance of SRD
and CME identification approaches.
Precision, Recall and F-Measure were the used
metrics for the validation of the proposed system, as
indicated in Eqs.1, 2 and 3, respectively. The F-
Measure is defined as a combination of both precision
and recall metrics in a global measurement.
Precision =
T P
T P + FP
(1)
Recall =
T P
T P + FN
(2)
F − Measure = 2 ∗
Precision ∗ Recall
Precision + Recall
(3)
where TP are the True Positives, FP the False Positi-
ves and FN the False Negatives.
Regarding the defined parameters, we used values
that were empirically calculated, as it was previously
mentioned in the methodology.
The efficiency of the proposed method for ME in
OCT retinal images was evaluated according to quan-
titative metrics. As gold standard, for the SRD and
CME cases, we measured if the central point of each
detected edema was successfully identified, based on
the specialist segmentation. Regarding the DRT case,
we analyzed if each column was correctly identified
when compared with the specialist opinion.
Regarding the case of SRD edemas, they are not
as common as the others, affecting only a reduced
groups of patients, as presented in (Otani et al., 1999).
Moreover, when it is present, only one SRD patho-
logical structure can be identified in each OCT scan.
For that reason, the employed image dataset only con-
tains 4 SRD edemas. The 4 cases were correctly iden-
tified by the proposed system.
For the DRT detection, the Naive Bayes classifier
was trained using the proposed dataset with a 10 fold
cross validation. Per each OCT image in the data-
set, 80 samples were randomly selected, representing
equally both DRT and non-DRT cases, resulting in a
total of 4000 extracted samples.
Regarding the selected features using the SFS
method, 4 of them were taken from the initial set:
mean intensity, kurtosis, energy and energy from the
GLCM matrix, as they include a high discriminant
power to differentiate common retinal tissue patterns
with respect to the DRT presence.
Using the selected features, the Naive Bayes clas-
sifier was trained and tested satisfactorily providing
the presented metrics resulting in Table 2.
Table 2: Performance of the DRT detection approach.
Precision Recall F-Measure
84.04% 80.79% 83.35%
With this strategy, we were able to detect the
83.35% of the total regions of DRTs. The introduced
mistakes are mainly derived from shadows that are
produced by the presence of vessels but also from dif-
ferent pathological structures (hard-exudates). These
shadows change the typical characteristics of the DRT
edemas. Therefore, these artifacts lead to a miss-
classification of the "sponge-region", decreasing the
metric.
Regarding the CME case, it can be found in both
regions (inner and outer retina), simultaneously. The-
refore, the efficiency of the system with this ME type
was tested in 2 phases, as listed in Table 3. In the first
phase, the system was tested in the inner retina where
the results were better. The F-Measure reaches a va-
lue of 87.48% in this case. The errors are mainly deri-
ved from missing CMEs with specific morphologies,
as fusiform shapes and the presence of Microcystic
Macular Edemas (MME). In the first case, cysts exhi-
bit an unusual elongated shape, in the horizontal axis.
Whereas, as a second case, the MMEs have a small
area with a not well defined boundaries.
VISAPP 2018 - International Conference on Computer Vision Theory and Applications
538
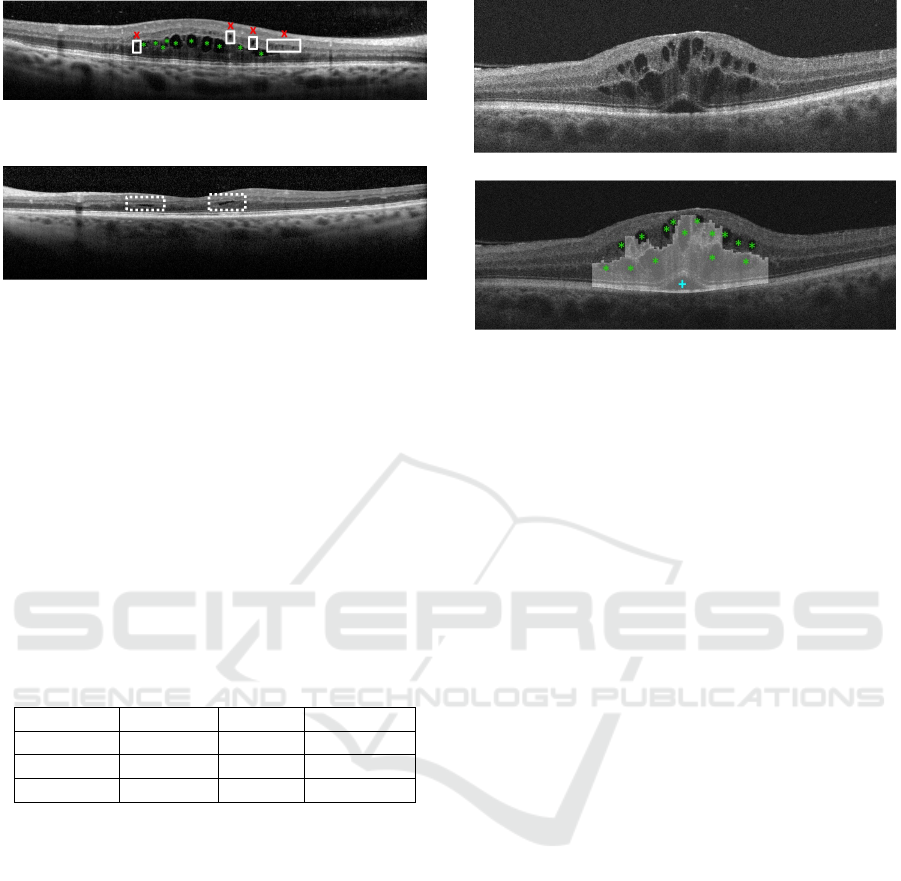
Figure 9: Example of OCT retinal image with undetected
MMEs (x) and correct detections of CMEs (*).
Figure 10: Example of the OCT retinal non detected CMEs
(- -), due to the fusiform shape.
In the second phase, the method was tested in the
outer retina where lower results were obtained given
the higher complexity of the identification in this re-
gion. This decrease of the metrics is, as commented
before, due to the fact that the almost absent contrast
between the CME and the retina tissue. In a more
complex scenario, the method is also able to detect
efficiently the CMEs in the OPL/RPE region.
Figure 11 presents an illustrative result where the
proposed system detects and characterizes the three
types of ME even when they are simultaneously pre-
sent on the same OCT image.
Table 3: Results of the quantitative metrics Precision, Re-
call and F-Measure for the CME detection.
Region Precision Recall F-Measure
ILM/OPL 96.84% 78.34% 87.48%
OPL/RPE 88.26% 78.19% 74.40%
Both 89.98% 80.34% 81.95%
4 CONCLUSION
In this paper, we propose a novel automatic system
that detects and characterizes the intraretinal fluid in
the different types of ME using OCT retinal ima-
ges. Using clinical criterions inspired in the Otani
classification, the system automatically identifies and
characterizes the ME in three types: SRD, DRT and
CME. To do that, we analyzed intensity, texture, mor-
phological and position properties of them retinal tis-
sue to detect all the cases of each ME type. Regarding
SRD and CME edemas, different approaches were
implemented based on adaptive thresholding in speci-
fic regions of the retinal layers, as they usually present
identifiable boundaries and a significant contrast with
the retinal tissue. Then, to remove FPs, clinical con-
ditions were applied based on the typical morphology
(a)
(b)
Figure 11: Example of an OCT retinal image with the de-
tection of the three types of macular edema: SRD illustrated
as (+), CME as (*) and DRT the selected columns.
of each type of ME. In the case of the DRT detection,
a Naive Bayes classifier was trained to identify the re-
gions where it is present using a list of 18 features as
intensity, texture and domain knowledge properties.
Then SFS is applied in order to select the ones with
higher power of discrimination.
Experimental results show that the proposed sy-
stem achieved promising results for the ME identi-
fication and characterization, even when they appear
combined on the same retinal region. In particular,
our system achieves a F-Measure of 83.35% for the
DRT and 81.95% in the CME detection. While, in
the detection of the SRD, the system detects all ede-
mas that were present in the used dataset. Therefore,
this system can be an important tool in clinical fields
helping in the detection and characterization of retinal
diseases.
As future works, the proposed system could have
a larger dataset in order to reinforce the conclusions
that were achieved in this work. Moreover, we aim
the identification of more complex cases of the CME
edemas. We also want to detect microcystic macular
edema. For doing that, specific approaches can be de-
signed with that purpose. Using the identified MEs,
different statistic metrics can be derived as a way to
provide valuable information to specialists and faci-
litate their diagnostic process. Therefore, it will be
possible to motorize the disease evolution and incre-
ase the life quality of the patients.
ACKNOWLEDGEMENTS
This work is supported by the Instituto de Salud Car-
los III, Government of Spain and FEDER funds of
Automatic Identification of Macular Edema in Optical Coherence Tomography Images
539

the European Union through the PI14/02161 and the
DTS15/00153 research projects and by the Ministerio
de Economía y Competitividad, Government of Spain
through the DPI2015-69948-R research project. Also,
this work has received financial support from the Eu-
ropean Union (European Regional Development Fund
- ERDF) and the Xunta de Galicia, Centro singular
de investigación de Galicia accreditation 2016-2019,
Ref. ED431G/01; and Grupos de Referencia Compe-
titiva, Ref. ED431C 2016-047.
REFERENCES
Alsaih, K., Lemaitre, G., Rastgoo, M., Massich, J., Sidibé,
D., and Meriaudeau, F. (2017). Machine Learning
Techniques for Diabetic Macular Edema (DME) Clas-
sification on SD-OCT Images. Biomed. Eng. Online,
16(1):68.
Baamonde, S., de Moura, J., Novo, J., and Ortega, M.
(2017). Automatic Detection of Epiretinal Membrane
in OCT Images by Means of Local Luminosity Pat-
terns. In International Work-Conference on Artificial
Neural Networks, pages 222–235. Springer.
Carmona, L. and Hernández, F. (2015). Revisión Biblio-
gráfica: Edema Macular Diabético, Repercusiones y
Tratamiento. Revista Médica del Instituto Mexicano
del Seguro Social, 53(5):600–607.
Chiu, S., Li, X., Nicholas, P., Toth, C., Izatt, J., and Farsiu,
S. (2010). Automatic Segmentation of Seven Reti-
nal Layers in SDOCT Images Congruent with Expert
Manual Segmentation. Opt. Express, 18(18):19413–
19428.
de Moura, J., Novo, J., Rouco, J., Penedo, M., and Ortega,
M. (2017). Automatic Identification of Intraretinal
Cystoid Regions in Optical Coherence Tomography.
In Conference on Artificial Intelligence in Medicine in
Europe, pages 305–315. Springer.
Dijkstra, E. (1959). A Note on Two Problems in Connexion
with Graphs. Numerische Mathematik, 1(1):269.
Gelfand, J., Nolan, R., Schwartz, D., Graves, J., and Green,
A. (2012). Microcystic Macular Oedema in Multiple
Sclerosis is Associated with Disease Severity. Brain,
135(6):1786–1793.
Goebel, W. and Kretzchmar-Gross, T. (2002). Retinal
Thickness in Diabetic Retinopathy: A Study Using
Optical Coherence Tomography (OCT). Retina,
22(6):759–767.
González, A., Remeseiro, B., Ortega, M., Penedo, M., and
Charlón, P. (2013). Automatic Cyst Detection in OCT
Retinal Images Combining Region Flooding and Tex-
ture Analysis. In CBMS, 2013 IEEE 26th Internatio-
nal Symposium on, pages 397–400. IEEE.
Gupta, A., Raman, R., Mohana, K., Kulothungan, V., and
Sharma, T. (2013). Communications Between Intra-
retinal and Subretinal Space on Optical Coherence
Tomography of Neurosensory Retinal Detachment in
Diabetic Macular Edema. Oman J.of Ophthalmol.,
6(3):183.
Helmy, Y. and Allah, H. (2013). Optical Coherence To-
mography Classification of Diabetic Cystoid Macular
Edema. Clin. Ophthalmol., 7:1731.
Joussen, A., Gardner, T., Kirchhof, B., and Ryan, S. (2010).
Retinal Vascular Disease. Springer Science & Busi-
ness Media.
Montuoro, A., Waldstein, S., Gerendas, B., Schmidt-
Erfurth, U., and Bogunovi
´
c, H. (2017). Joint Reti-
nal Layer and Fluid Segmentation in OCT Scans of
Eyes with Severe Macular Edema Using Unsupervi-
sed Representation and Auto-Context. Biomed. Opt.
Express, 8(3):1874–1888.
Noma, H., Funatsu, H., Mimura, T., and Shimada, K.
(2011). Visual Function and Serous Retinal Deta-
chment in Patients with Branch Retinal Vein Occlu-
sion and Macular Edema: A Case Series. BMC Opht-
halmology, 11(1):29.
Ooto, S., Tsujikawa, A., Mori, S., Tamura, H., Yamashiro,
K., and Yoshimura, N. (2010). Thickness of Photore-
ceptor Layers in Polypoidal Choroidal Vasculopathy
and Central Serous Chorioretinopathy. Graefe’s Arch.
Clin. and Exp. Ophthalmol., 248(8):1077–1086.
Otani, T., Kishi, S., and Maruyama, Y. (1999). Patterns
of Diabetic Macular Edema with Optical Coherence
Tomography. Am. J. of Ophthalmol., 127(6):688–693.
Otsu, N. (1979). A Threshold Selection Method from Gray-
Level Histograms. EEE Trans. Syst. Man. Cybern B.
Cybern., 9(1):62–66.
Panozzo, G., Parolini, B., Gusson, E., Mercanti, A., Pi-
nackatt, S., Bertoldo, G., and Pignatto, S. (2004). Dia-
betic Macular Edema: An OCT-Based Classification.
In Seminars in Ophthalmology, volume 19, pages 13–
20. Taylor & Francis.
Sidibé, D., Sankar, S., Lemaître, G., Rastgoo, M., Mas-
sich, J., Cheung, C., Tan, G., Milea, et al. (2017).
An Anomaly Detection Approach for the Identifica-
tion of DME Patients Using Spectral Domain Optical
Coherence Tomography Images. Comput. Methods
and Programs in Biomed., 139:109–117.
Trichonas, G. and Kaiser, P. (2014). Optical Coherence To-
mography Imaging of Macular Oedema. Br. J. of Op-
hthalmol., 98(Suppl 2):ii24–ii29.
WHO (2012). Global Data on Visual Impairments 2010.
Geneva: World Health Organ.
Willoughby, A., Chiu, S., Silverman, R., Farsiu, S., Bai-
ley, C., Wiley, H., Ferris, F., and Jaffe, G. (2017).
Platform-Independent Cirrus and Spectralis Thickness
Measurements in Eyes with Diabetic Macular Edema
Using Fully Automated Software. Transl. Vis. Sci. &
Technol., 6(1):9–9.
Wolff, B., Azar, G., Vasseur, V., Sahel, J.-A., Vignal, C.,
and Mauget-Faÿsse, M. (2014). Microcystic Changes
in the Retinal Internal Nuclear Layer Associated with
Optic Atrophy: a Prospective Study. J. Ophthalmol.,
2014.
Zhu, S. and Yuille, A. (1996). Region Competition: Uni-
fying Snakes, Region Growing, and bayes/MDL for
Multiband Image Segmentation. IEEE Trans.s on Pat-
tern Anal. and Mach. Intell., 18(9):884–900.
VISAPP 2018 - International Conference on Computer Vision Theory and Applications
540
