
Stair Climb Power Measurements via Inertial Measurement Units
Towards an Unsupervised Assessment of Strength in Domestic Environments
Sandra Hellmers
1
, Tobias Kromke
1
, Lena Dasenbrock
1
, Andrea Heinks
1
,
J
¨
urgen M. Bauer
2
, Andreas Hein
1
and Sebastian Fudickar
1
1
Carl von Ossietzky University Oldenburg, Oldenburg, Germany
2
Heidelberg University, Agaplesion Bethanien Krankenhaus Heidelberg, Heidelberg, Germany
Keywords:
Stair Climb Power, Inertial Measurement Unit (IMU), Power, Stair Ascending, Machine Learning, Clinical
Assessment, Unsupervised, Wearable Sensors.
Abstract:
In order to initiate interventions at an early stage of functional decline and thus, to extend independent living,
the early detection of changes in functional ability is important. The Stair Climb Power Test (SCPT) is a
standard test in geriatric assessments for strength as one of the essential components of functional ability. This
test is also well suited for regular and frequent power measurements in daily life since the activity of climbing
stairs is usually frequently performed.
We introduce an automated assessment of the SCPT based on inertial measurement units (IMU) in a study
of 83 participants aged 70-87 years. For power evaluations of the lower extremities, the activity of climbing
stairs was automatically classified via machine learning and the power was calculated based on the test duration
and covered height. Climbing stairs was correctly classified in 93% of the cases. We also achieved a good
correlation of the power calculations with the conventional stop watch measurements with a mean deviation of
2.35%. The system’s sensitivity to detect the transition towards frailty has been confirmed. Furthermore, we
discussed the general suitability of the automated stair climb power algorithm in unsupervised, standardized
home-assessments.
1 INTRODUCTION
Functional ability is important for an independent liv-
ing but with age functional decline is inevitable. The
decline can be slowed down through timely preven-
tive measures. For this purpose, early detection of
performance changes is crucial. Usually, the func-
tional status is evaluated via assessments, covering
”strength”, ”mobility” and ”balance” as essential pa-
rameters for the functional performance (Hellmers
et al., 2017c). The power, which is related to the
muscle strength, has shown to hold an important role
in functional ability and seems to be a good indica-
tor for functional decline (Reid and Fielding, 2012).
For example, the power of the lower extremities is
measured by the Nottingham power rig, cycle ergom-
etry, rapid dynamic contractions on resistance train-
ing machines, maximal vertical jump (Hellmers et al.,
2017b), stair climbing, stair sprinting, or sit-to-stand
(STS) transfer (Zech et al., 2011). Bean et al. have
shown that the muscular strength correlates with the
determined stair climb power in the stair climb power
test (SCPT) (Bean et al., 2007) and timed stair tests
are considered as an objective measure of functional
abilities (Nightingale et al., 2014). Especially the
SCPT and the STS require less technique and physi-
cal demands. Therefore, they can be easily performed
in all age groups and are often possible even with a
beginning functional decline.
Figure 1 shows an assumed qualitative progress of
the functional ability over age. While the ability re-
mains stable until high age, at some point the ability
suddenly declines. Thus, frequent assessments (e.g.
monthly) would enable an early detection of func-
tional decline and an initiation of preventive measures
when they are needed most. It is important to detect
performance changes ∆a as soon as possible and to
start interventions at an early stage because they can
slow the functional decline and extend the time ∆t of
independent living. But since guided assessments re-
quire a lot of effort by health professionals (and thus,
hold a significant financial burden to healthcare sys-
tems), they can only be conducted on an occasional
basis.
Hellmers, S., Kromke, T., Dasenbrock, L., Heinks, A., Bauer, J., Hein, A. and Fudickar, S.
Stair Climb Power Measurements via Inertial Measurement Units - Towards an Unsupervised Assessment of Strength in Domestic Environments.
DOI: 10.5220/0006543900390047
In Proceedings of the 11th International Joint Conference on Biomedical Engineering Systems and Technologies (BIOSTEC 2018) - Volume 5: HEALTHINF, pages 39-47
ISBN: 978-989-758-281-3
Copyright © 2018 by SCITEPRESS – Science and Technology Publications, Lda. All rights reserved
39
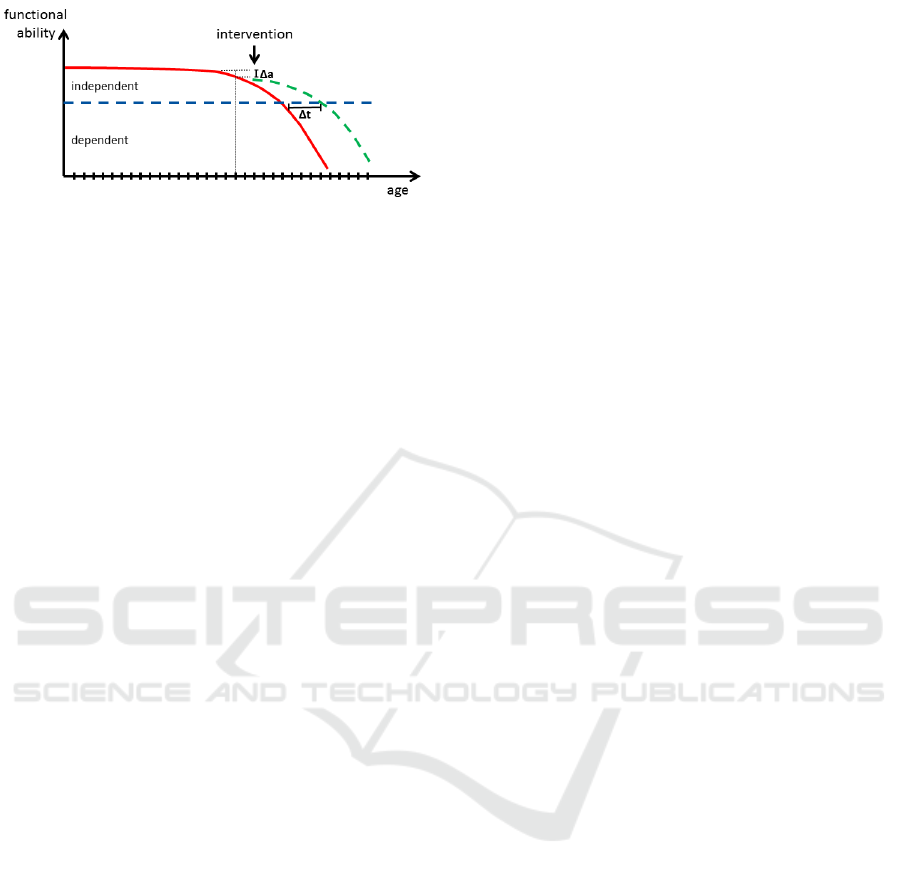
Figure 1: Qualitative progress of functional ability over
time. Regularly performed assessments (lines on the hori-
zontal axis) enable the possibility to detect early changes in
the ability ∆a to start interventions and slow the functional
decline and extend the time ∆t of independent living.
A promising approach to overcome conventional
time-intensive and high-effort supervised assess-
ments are technology-supported unsupervised and
self-guided home-assessments, where the evaluation
takes place during daily life activities. Frenken et al.
(Frenken et al., 2012) pointed out that there is a clear
need for technical support for implementing mobility
assessments unsupervised in domestic environments
in order to objectively measure capacity and perfor-
mance of patients. Due to the regular and routinized
manner of the SCPT execution, climbing stairs is a
well suited activity to be considered for unsupervised
assessments in daily living.
The SCPT is suitable for home-assessments, as long
as elderlies climb stairs in their daily living. Whereby,
wearable technologies offer a good approach for un-
obtrusive measurements.
Thus, we investigate an automated assessment of the
(muscular) strength based on the common SCPT via
3D-accelerometers and 3D gyroscopes - so called
inertial measurement units (IMUs)- integrated into
belts. For an automated evaluation of the stair climb-
ing performance two steps are necessary:
1. Classification of phases of stair climbing,
2. Calculation of the stair climb power.
The rest of the paper is structured as follows: We de-
scribe related work in Section 2 and the study design
in Section 3. The method for the detection of stair
climbing is presented in Section 4 and for power cal-
culation in Section 5. The results and the evaluation
are described in Section 6 and we discuss the suitabil-
ity for home-assessments in Section 7. Finally, we
describe our conclusions and future work in Section
8.
2 STATE OF THE ART
Regarding the suitability to classify climbing stairs,
various combinations and placements of IMU-sensors
have been shown to be practical. Table 1 shows a se-
lection of studies and the applied sensors and posi-
tioning as well as the study size and the age of the
participants. It is to mention that these studies do not
only concentrate on as- or descending stairs but on the
general recognition of several activities such as walk-
ing, sitting, standing, lying, running or cycling.
The first four examples show the influence of the sen-
sor placements on the accuracy: Zheng et al. (Zheng
et al., 2014) applied three IMUs positioned at one
thigh, shank and foot and pressure sensors at the
feet to achieve an accuracy of 99.03% with a lin-
ear discriminant analysis (LDA) classifier. Khan et
al. (Khan et al., 2010) used one accelerometer at
the chest and artificial neural nets (ANNs) as well as
autoregressive (AR) modeling to get an accuracy of
99.0% in stair climbing recognition. Fida et al. (Fida
et al., 2015) achieved an accuracy of 97.2% with a
Support Vector Machine (SVM) as classifier and a 3D
accelerometer and gyroscope attached to the shank of
the dominant leg.
In the other studies mentioned in Table 1 the sensor
was positioned at the waist and therefore have a sim-
ilar sensor attachment as in our study. These studies
show a lower precision, but the placement at the waist
is less obtrusively and suitable for unsupervised at-
tachments by the participants.
Shoaib et al. (Shoaib et al., 2014) applied an IMU
and achieved an accuracy of >95% with a K Nearest
Neighbor (kNN) classifier, whereas Fareed (Fareed,
2015) achieved 93.8% with a similar setting. A Sup-
port Vector Machine (SVM) as classification method
was applied by Sun et al. (Sun et al., 2010) and the
accuracy was 93.8 %. The selection shows that the
used classification method also varies within differ-
ent studies. It has been shown, that the type of clas-
sifier affects the accuracies, but the accuracies also
vary within one method due to the influences of dif-
ferent data sets and their complexity. Besides the sen-
sor placement and the applied classifier, the derived
features and the specifications of the sliding window
are important parameters. Therefore, we investigate
and describe these parameters in Section 4.
It should be pointed out that the mentioned studies
have been conducted with rather young participants,
which clearly does not represent the intended primary
user group to benefit from such systems. Thus, only a
small variety of stair climbing patterns might be cov-
ered in the discussed works. For this reason, research
for recognition of stair ascending in larger studies and
HEALTHINF 2018 - 11th International Conference on Health Informatics
40

Table 1: Studies investigating classification of stair climbing via machine learning. The type of applied sensors (accelerom-
eter (acc.), gyroscope (gyro.), magnetometer (magn), barometer (baro) and sensor positioning, as well as the sample size
and the age of the study population are listed. The classification method with the best accuracy is written in bold. The ab-
breviations of the methods are: Linear Discriminant Analysis (LDA), Artificial Neural Nets (ANNs), Autoregressive (AR)
Modeling, Decision Trees (DT), Bayesian Networks (BN), Naive Bayes (NB), Support Vector Machine (SVM), Multiclass-
(Hardware Friendly)-SVM (MC-(HF-)SVM), K Nearest Neighbor (kNN), Rule-Based Classifiers (RBC), Logistic Regression
(LR), Static Classifier (SC), Hidden Markov Model (HMM).
Precision Sensor Position Classification Method size age [years] Reference
99.03% 3D acc & gyro thigh, foot, LDA 5 24.8(±1.3) (Zheng et al., 2014)
& magn; pressure shank
99.0% 3D acc chest ANN, AR 6 27 (mean) (Khan et al., 2010)
97.2% 3D acc & gyro shank SVM 9 29(± 5) (Fida et al., 2015)
> 95.0 % 3D acc & gyro waist SVM, kNN, RBC, 10 25-30 (Shoaib et al., 2014)
LR, DT, BN, NB,
93.8 % 3D acc waist SVM 7 25-46 (Sun et al., 2010)
93.2 % 3D acc & gyro waist DT, NB, kNN, SVM N/A N/A (Fareed, 2015)
87.2 % 3D acc waist MC-SVM, 30 19-48 (Anguita et al., 2012)
MC-HF-SVM
84.6 % acc, baro, ... waist SC, HMM 12 20-30 (Lester et al., 2006)
especially for older adults is important because their
movements can deviate from movements of younger
adults. For example, Stacoff et al. (Stacoff et al.,
2005) found in their study that younger participants
walked faster and produced larger vertical ground re-
action force (GRF) maxima during level walking and
on stair climb than the older age group. Considering
this point, we carried out a larger study, which is de-
scribed in the next section.
After concentrating on the stair climbing recognition,
we now focus on the power-calculations. According
to Bean et al. (Bean et al., 2002), power is a physi-
ological attribute related to strength and reflects the
ability to perform muscular work per unit of time.
Power P can be calculated by the following equation
P = Fv = mgv = mg
h
t
kg · m
2
s
3
= W
, (1)
where F is the force, v the velocity, m the par-
ticipant’s weight, g the gravity, h the covered height
and t the test duration. Usually, the time for the
SCPT is measured by medical professionals via stop-
watches. While various studies concentrate on stair
climb recognition, they have not yet conducted such
IMU based power calculations. Regarding Equation 1
we need to determine the parameters ”stair climbing
duration” and ”covered height” in the detected phases
of stair climbing.
3 STUDY DESIGN
In order to develop an inertial-based system to mea-
sure the stair climb power test and to evaluate its
sensitivity and specificity, we conducted the follow-
ing laboratory study. IMUs integrated into belts
were used due to their easy applicability, flexibility
and suitability for measuring daily life activities. In
this study, the SCPT was measured via conventional
manner assessments with manual stopwatch measure-
ments (assumed as gold standard) and IMU-based
sensor belt recordings. Overall, 83 participants aged
70-87 years (75.64± 4.17 years) performed the SCPT
twice.
Initially, the examiner stands with each participant at
the base of the stairway with eleven steps. The partic-
ipants were instructed to safely climb the stair as fast
as they could and to stop on the 10th step. In accor-
dance with the proceedings introduced by Bean et al.
(Bean et al., 2007), participants were allowed to use
the handrail if necessary.
Figure 3 shows the used stairway with eleven steps.
The yellow footprints mark the start positions,
whereby the participants can choose their preferred
side. The first yellow line is for safety issues and the
reduction of the risk of stumbling. The participants
should stop at the second line because the SCPT is
usually performed on 10 steps. The red boxes mark
the light barriers.
Besides the SCPT, other geriatric tests such as the
Short Physical Performance Battery (SPPB), Frailty
Criteria, de Mortan Mobility Index (DEMMI), 6
Minute Walk Test (6MWT), and Counter Move-
Stair Climb Power Measurements via Inertial Measurement Units - Towards an Unsupervised Assessment of Strength in Domestic
Environments
41
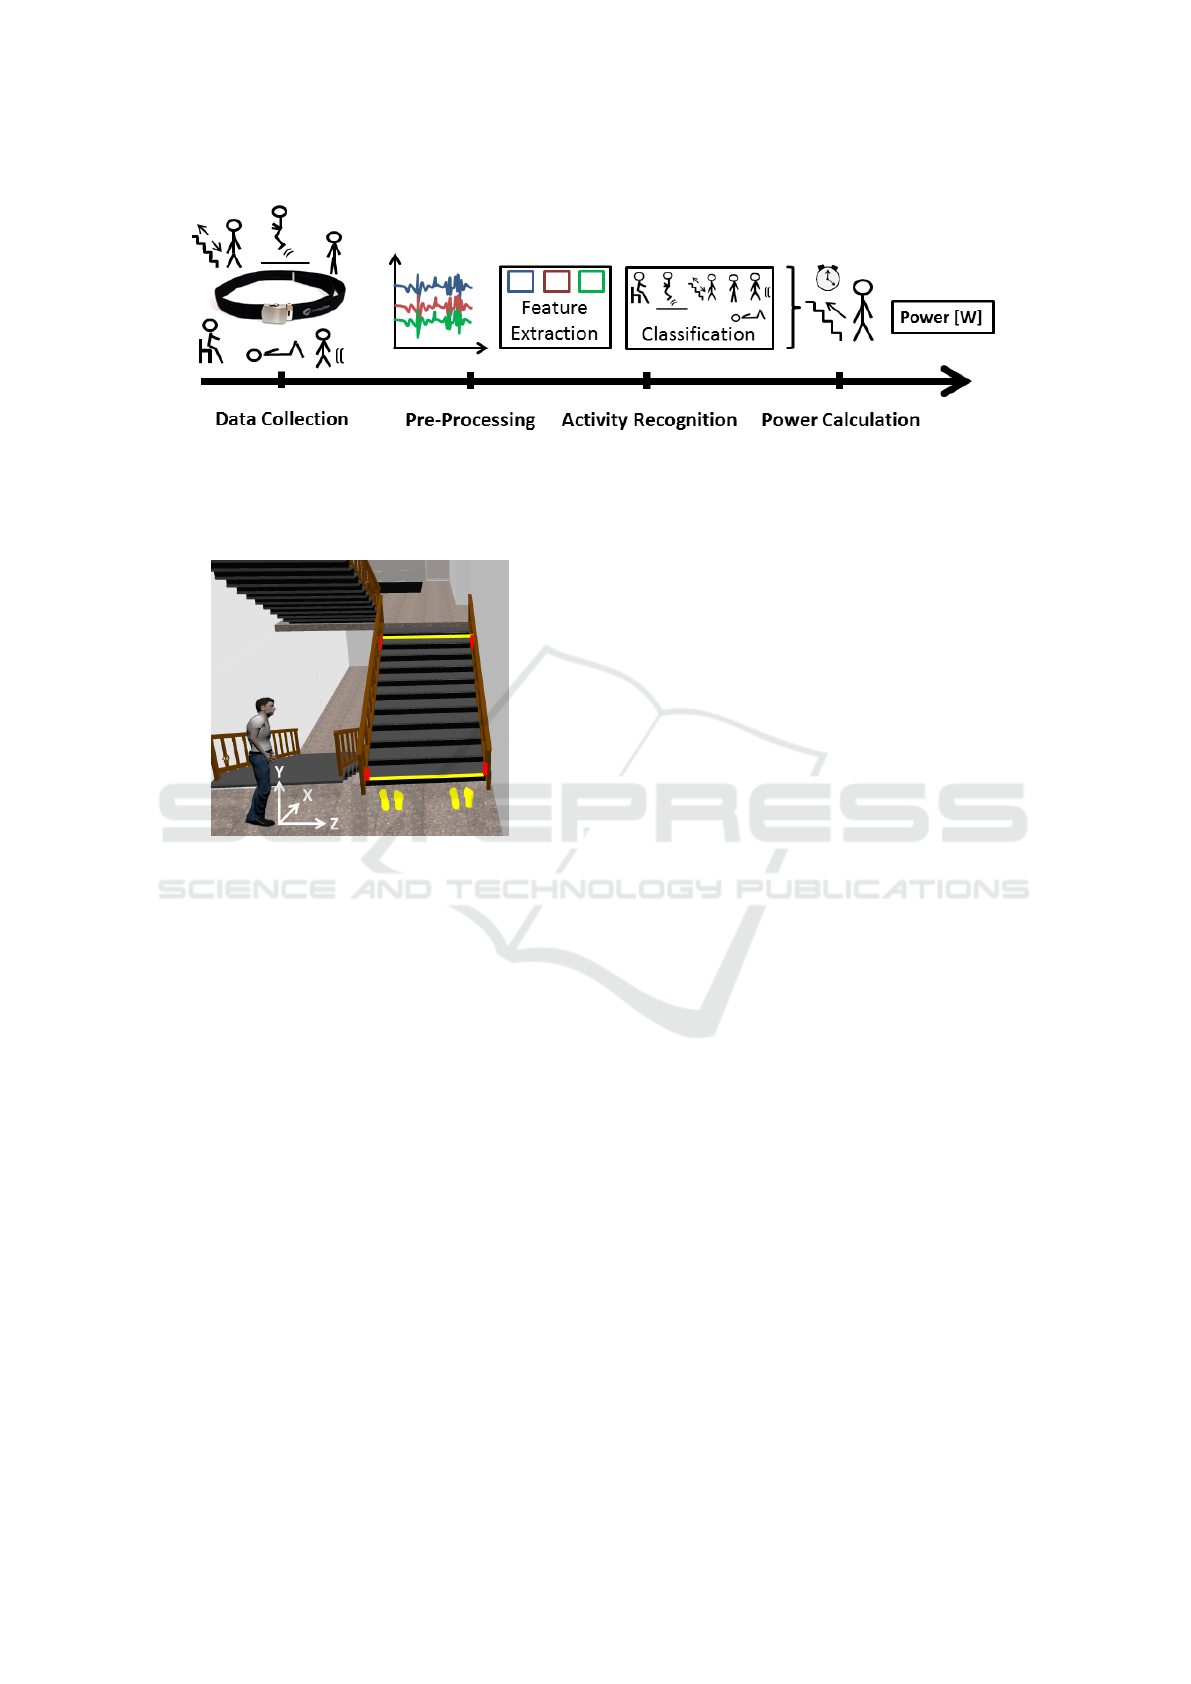
Figure 2: Process of activity recognition and stair climb power calculation. After data collection, data pre-processing follows.
Before the classification of activities, feature sets must be selected. After classification of the activity of ascending stairs, the
power can be calculated.
Figure 3: The stairway used in the study: The participants
start at the yellow footprints and should stop before the sec-
ond yellow line at the 10th step. The red boxes mark the
light barriers. The coordinate orientation of the sensor belt
is illustrated: x-direction is sidewards; y-direction is up-
wards; z-direction is straight forward.
ment Jumps (CMJ) were performed. After these
assessments, the participants wear the sensor belts
continuously for one week in their daily life. The
study and the utilized technologies for each assess-
ment item are summarized in (Hellmers et al., 2017a).
Sensor Belt
The measurement unit integrated into the belt in-
cludes four sensor types: A Bosch BMA180 triaxial
accelerometer, which measures the acceleration force
in g ≈ 9.81ms
−2
applied to the device on all three
physical axes (x, y, and z). The accelerometer has
the following parameters: Sensitivity ranges from
1G up to 16G and the chip supports sampling rates
up to 1200 Hz. The STMicroelectronics L3GD20H
gyroscope measures the device’s rate of rotation in
deg · s
−2
around each of the three physical axes (x,
y, and z). A magnetometer measures the ambient
geomagnetic field for all three physical axes (x, y,
z) in µT and a barometer measures the air pressure
in hPa. The coordinate orientation of the sensors
is shown in Figure 3. A sampling rate of 100 Hz
is used for all four sensors in this study, since the
parameter settings have a significant influence on the
recognition accuracies (Fudickar et al., 2012).
4 STAIR CLIMB DETECTION
Figure 2 shows the general processing work-flow of
activity recognition via the intended machine learn-
ing approach and stair climb power calculation. Af-
ter data collection during the different geriatric tests
within the assessment (see section 3), steps of pre-
processing follow, as well as the feature extraction for
the classification. The stair climb power is calculated
for the time spans, classified as stair ascending.
In order to describe our algorithm, we focus on the
extracted features, the sliding window and the used
classifiers in the following sections.
4.1 Derived Features
Deriving a minimal feature-set is an essential step
for machine-learning based classification algorithms
in order to assure efficient classification. In order
to train the classifier, data sets of 80% (n=66) of all
participants are considered. The activities of stand-
ing, walking, ascending and descending stairs were
selected from the whole assessment and pooled. Ac-
cording to frequently used features in literature (see
section 2), we derived the following features:
Mean• Variance•
Root Mean Square• Standard Deviation•
Median• Entropy•
Correlation
Coefficient
• FFT Energy•
HEALTHINF 2018 - 11th International Conference on Health Informatics
42
These eight features are considered per axis of ac-
celerometer and gyroscope, resulting in an overall set
of 48 features. The data of the magnetometer was
excluded due to its high influence to environmental
noise. Including the magnetometer data would re-
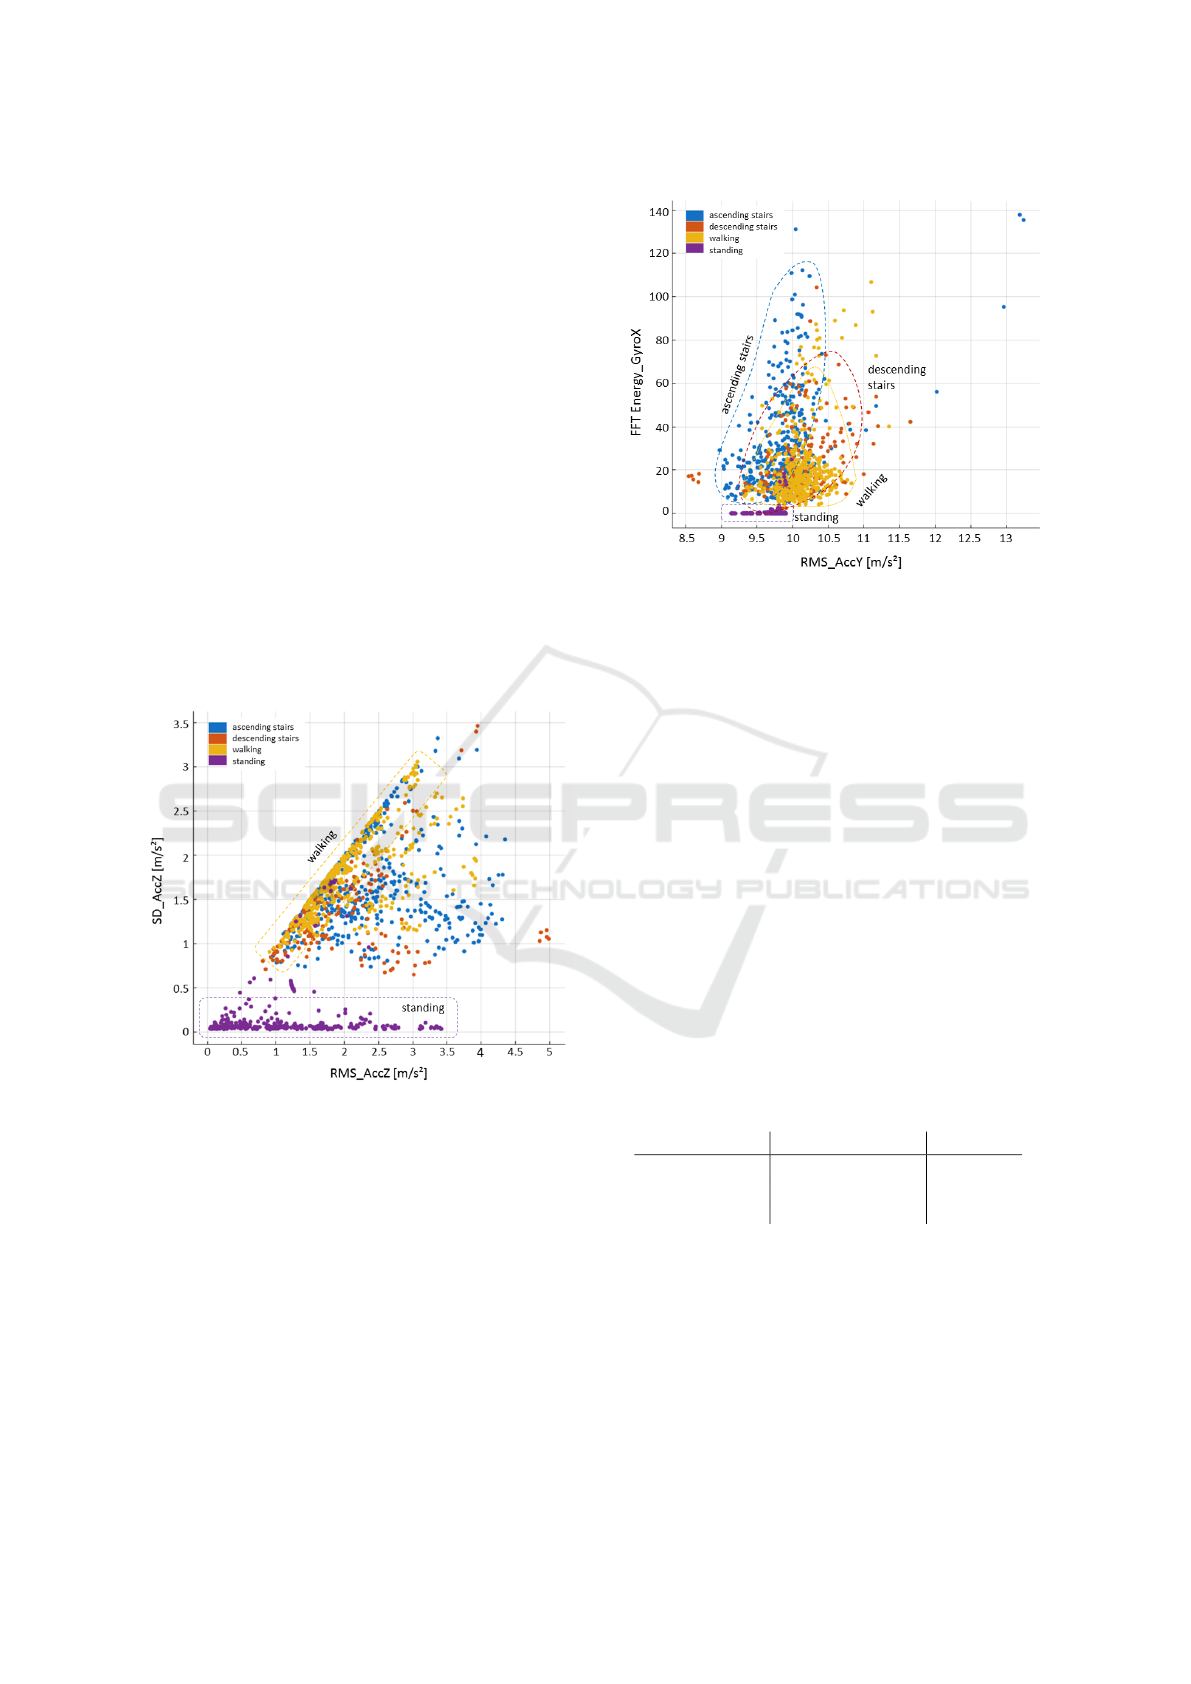
sult in an over-fit for this specific stairway. Figure
4 shows, as an example, the standard deviation (SD)
in comparison to the root mean square (RMS) in z-
direction of the activities ascending and descending
stairs, walking and standing. As expected, the SD
for a static activity is quite small. Furthermore, while
there is only a relatively low scattering of the walk-
ing activity, the values for ascending and descend-
ing stairs scatter significantly broader. Another ex-
ample is shown in Figure 5: The distribution of the
FFT Energy of the gyroscope in x-direction and Root
Mean Square (RMS) of the accelerometer data in y-
direction. While the FFT energy for standing is about
zero (static activity), the FFT energy for ascending
stair lies in a higher range than walking and descend-
ing stairs. The RMS is also lower than for the other
both dynamic activities.
Figure 4: Scatterplot of Standard Deviation (SD) and
Root Mean Square (RMS) of the accelerometer data in z-
direction (straight forward). The activities of walking and
standing show low scatterings, while ascending and de-
scending stair scatter significantly broader.
4.2 Sliding Window and Classifier
Besides the features, the sliding window and the used
classifier are also crucial factors. Since Shoaib et al.
(Shoaib et al., 2014) have shown that an overlap of
50% of the sliding windows produces reasonable re-
sults, we considered a sliding window approach with
a 50% overlap.
In accordance with the related work, we used the fol-
lowing classifiers, due to their high sensitivity. All of
Figure 5: Scatterplot of FFT Energy of the gyroscope in
x-direction (sidewards) and Root Mean Square (RMS) of
the accelerometer data in y-direction (upwards). The mean
ranges of values for each activity are marked in the graph.
them are available in Mathworks’ MATLAB (version
R2015a):
• Decision tree (complex, medium, simple),
• Support vector machine (linear, quadratic, cubic,
fine Gaussian, medium Gaussian, coarse Gaus-
sian),
• K-Nearest-Neighbor (fine, medium, coarse, co-
sine, cubic, weighted).
The F1-Score was used for the evaluation to consider
both precision and recall. Figure 6 shows the F1-
Scores for the recognition of the activity ”climbing
stairs” for each classifier of the three used methods
with the best result for different window sizes. Table
2 summarizes the results.
Table 2: Best results of F1-Scores by optimized window
sizes and an overlap of 50% of the sliding windows for the
three used classifiers.
Classifier Window Size [s] F1 Score
Decision Tree 1.9 81.50
SVM 1.7 93.00
k-NN 1.6 93.99
While decision trees show the worst performance
with an F1-Score of 81.5, k-NN (93.99) and SVM
(93.0) achieve similar results. The best window size
for the k-NN classifier is 1.6s and for the SVM clas-
sifier about 1.7s. At the basis of this result, in the
following, we concentrate on the k-NN classifier.
Stair Climb Power Measurements via Inertial Measurement Units - Towards an Unsupervised Assessment of Strength in Domestic
Environments
43
Figure 6: F1-Score for three different classifiers complex
tree, Cubic SVW and Fine k-NN in correlation to the win-
dow size.
4.3 Post-Filtering
To remove incorrectly detected stair climbing activi-
ties, a minimum duration of 3s for this activity was
defined and shorter durations declared as ascending
stair were ignored in a post-filtering step. This thresh-
old value is based on stopwatch measurements over
all participants, whose needed duration was always
> 3s. The majority of studies use a stairway of 10
to 12 stairs for testing, which is likely to be the av-
erage flight length available in buildings and there-
fore a practical length for testing (Nightingale et al.,
2014). But in those studies, which are looking at med-
ical conditions involving the heart and lungs, longer
stairways are used to elicit a more cardiovascular re-
sponse. Therefore, stair ascending activities with less
stairs than 10 are less meaningful for the SCPT.
5 CALCULATION OF STAIR
CLIMB POWER
In order to calculate the power and in accordance with
Equation 1, the covered height and the duration for
the SCPT are measured. While the duration is de-
termined by the sequence of the recognized activity,
the height was evaluated by counting the steps within
this sequence of ascending stairs. Figure 7 shows, as
an example, the acceleration of a sequence of climb-
ing 10 steps. The activity of climbing stairs or other
rhythmic activities usually show repetitive patterns.
In cases of walking or ascending stairs, the impact
of the foot on the floor causes a peak in acceleration
data. These peaks were counted and assumed as steps.
On the basis of the step number n the covered height
Figure 7: Acceleration in x-,y-, and z-direction during a
phase of ascending stairs in a laboratory setting. The single
steps can be recognized by characteristic peaks.
h can be calculated by h = n ∗ 16.5, where 16.5 is the
height of one step in cm. In most European coun-
tries the height of steps is standardized by building
regulations. Barometers can also be used for eleva-
tion measurements. But due to the low accuracy of
the barometer in our study (±10 cm), we decided to
use the peak detection algorithm based on the accel-
eration data for height estimations.
The participant’s weight was measured via a sta-
diometer (seca 285) and the gravity is assumed to be
g = 9.81ms
−2
.
6 EVALUATION
6.1 Recognition of Stair Ascent
Since the data sets of 80% (n=66) are considered for
model training, the other 20% (n=17) of data sets are
used for testing. Figure 8 shows the confusion ma-
trix of our Fine k-NN classifier, with a window size
of 1.6s and an overlap of 50%. The recognition of
standing and walking show very good results with a
rate up to > 98%. Climbing stairs is correctly rec-
ognized in 93% of the cases’. Descending stairs was
incorrectly assigned as climbing stairs in 6% and as
walking in 10%.
6.2 Calculation of Stair Climb Power
Table 3 shows the mean deviations of power, test du-
ration and covered height of the sensor-based mea-
surements with the already presented k-NN classi-
fier to stop watch measurements. The weight and the
gravity values are same in both calculations and there-
fore not further considered.
HEALTHINF 2018 - 11th International Conference on Health Informatics
44
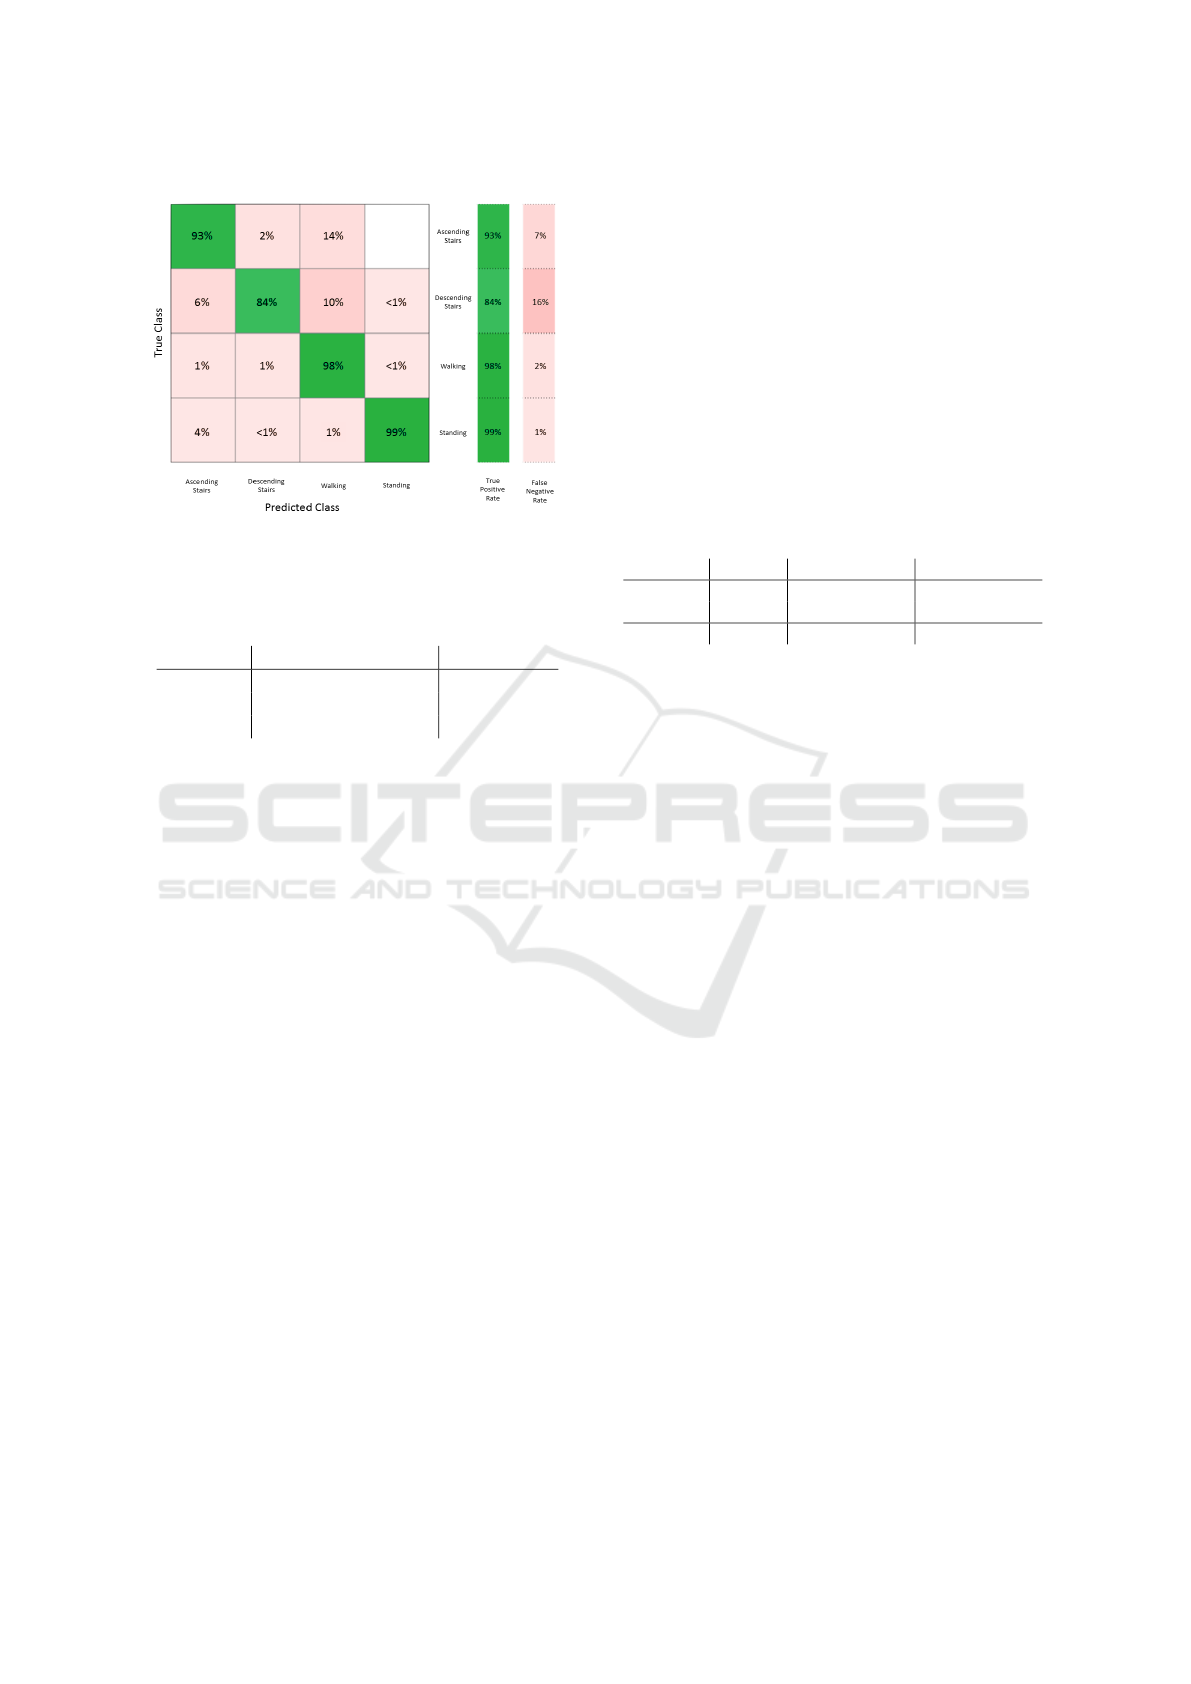
Figure 8: Confusion matrix of activity recognition with a
k-NN classifier.
Table 3: Mean deviations of sensor-based power measure-
ments to stopwatch measurements.
Mean Deviation [%] Median [%]
Power 2.35 4.71
Duration 14.49 6.46
Height 15.00 15.00
While the k-NN classifier achieves quite good
power values with a mean deviation of 2.35 % to the
gold standard, the deviation of the estimated height
and durations are with respectively ≤15% very high.
As already described in Section 3 the duration of
climbing ten stairs will be measured by the stop watch
in the SCPT and is assumed as gold standard. But the
technically detected number of stairs is not exactly 10
in all cases. In our assessments, the number of passed
steps varied among users between 10 and 11 stair due
to the following reasons: The setting consists of an 11
step stair flight, but some participants forget to stop at
the 10th step, as instructed. In addition, a step might
be not recognized due to the transition from standing
to climbing stairs. However, this isn’t a problem due
to the fact that according to Equation 1 the ratio of
height and duration influences the power (v = h/t).
Thus, the difference in the power of the gold standard
measurement (ten stairs) is small, due to the low effect
on the participants’ fatigue or the fluency of the test
sequence (acceleration and deceleration) of climbing
one additional or less stair. But of course, the accurate
detection of the beginning and end of the activity is a
major task and needs further investigations.
6.3 Medical Sensitivity
In order to clarify the medical sensitivity of our sys-
tem, we compared its error to the medical required
sensitivity to detect the transition to functional decline
(as covered by frail state). Table 4 summarizes the
power values of our participants at baseline (t0) and
after 6 month (t1). They were categorized in groups
of frail and non-frail according to the classification
of the Frailty Criteria. The mean deviation in power
between these groups is about 14% and therefore, sig-
nificantly higher than our system’s deviation from the
gold standard measurements of about 2%. Thus, we
conclude that our system’s sensitivity is sufficient for
medical meaningful detection of transitions towards
the frail state under controlled conditions.
Table 4: Stair climb power (P) of participants in our study
at baseline (t0) and after 6 month (t1) categorized in groups
of frail and non-frail according to the classification of the
Frailty Criteria.
number P
t0
[W] P
t1
[W]
non-frail 56 2302 2298.0
frail 27 1979.5 1968.1
∆ 322.5 (14.0%) 329.9 (14.0%)
7 SUITABILITY FOR
HOME-ASSESSMENTS
We have introduced a first approach to measure the
stair climb power via a single inertial sensor worn at
the waist. Due to the easy applicability, elderlies can
wear the sensor belt correctly without further assis-
tance. The participants of our study have worn the
sensor belt continuously without supervision during
their daily living for one week following their assess-
ments and written an activity diary for the week. In-
vestigating these data sets, we want to study the appli-
cability of our SCPT system to an unsupervised use
by detecting the correctness of detected stairs.
Figure 9 shows the acceleration data during climbing
stairs of one participant at home. This sequence was
classified as stair ascent by our algorithm. To validate
this classification we compared our results with the
participants diary (ground truth). The diary and the
classified activity match in this case.
In comparison to Figure 7 the pattern and ampli-
tudes are significantly different from the acceleration
data measured during the assessment (test situation)
although it shows the activity of the same partici-
pant. Thus, we could confirm, that phases of climb-
ing stairs could also be recognized during these home-
assessments.
Furthermore, to clarify the degree of variations in
stair-climbing patterns for different environments by
investigating it in the participant’s daily life. There-
fore, the one-week measurements of the sensors will
be analyzed concerning the frequency, the covered
Stair Climb Power Measurements via Inertial Measurement Units - Towards an Unsupervised Assessment of Strength in Domestic
Environments
45

Figure 9: Acceleration in x-,y-, and z-direction during a
phase of climbing stairs in daily life.
steps and the estimated stair climb power of the ac-
tivity stair climbing. Regarding the medical mean-
ingfulness of unsupervised power measurements at
home, a comparison of the results in the laboratory
setting with results at home will follow. Within, es-
pecially the influence of diverging conditions such as
step number or the absence of a test situation will be
examined. For further validation of our stair climbing
detection in domestic environments, it is planned to
install ambient sensors at the stairways in the homes
of a subgroup of our participants.
8 CONCLUSION
Due to the importance of strength analysis to detect
functional decline in an early stage, we introduce stair
climb power measurements based on IMUs in a lab-
oratory setting. Therefore, we recognized the activity
of climbing stairs automatically via machine learning
and calculated the power based on the needed time
and covered height. Climbing stairs is correctly clas-
sified in 93% of the cases. For power calculations, we
achieved good results in comparison to conventional
measurements with a mean deviation of 2.35%. The
system’s sensitivity to detect the transition towards
frailty has been confirmed.
Additionally, we showed the general suitability of
sensor belt measurements at home and confirmed, that
phases of climbing stairs could also be recognized
during home-assessments However, further investiga-
tions of the stair usage behavior of our participants
and the recognition of stair ascending in domestic en-
vironments are planned based on one-week measure-
ments at home following the assessments. The use of
ambient sensors such as RFID technologies or light
barriers in the homes of a subgroup of our participants
is intended for further validations of the activity de-
tection and the determined duration of the stair climb-
ing activity. Especially regarding the medical rele-
vance of unsupervised home-assessments, further in-
vestigations and comparisons between laboratory and
home results are needed.
ACKNOWLEDGEMENTS
The study is funded by the German Federal
Ministry of Education and Research (Project No.
01EL1422D). The study has been approved by the
appropriate ethics committee (ethical vote: Hannover
Medical School No. 6948) and conducted in accor-
dance with the Declaration of Helsinki.
REFERENCES
Anguita, D., Ghio, A., Oneto, L., Parra, X., and Reyes-
Ortiz, J. L. (2012). Human activity recognition
on smartphones using a multiclass hardware-friendly
support vector machine. In International Workshop on
Ambient Assisted Living, pages 216–223. Springer.
Bean, J., Herman, S., Mph, D. K. K., Callahan, D., Mizer,
K., Md, W. R. F., and Fielding, R. A. (2002). Weighted
stair climbing in mobility-limited older people: a pi-
lot study. Journal of the American Geriatrics Society,
50(4):663–670.
Bean, J. F., Kiely, D. K., LaRose, S., Alian, J., and Fron-
tera, W. R. (2007). Is stair climb power a clinically
relevant measure of leg power impairments in at-risk
older adults? Archives of physical medicine and reha-
bilitation, 88(5):604–609.
Fareed, U. (2015). Smartphone sensor fusion based activ-
ity recognition system for elderly healthcare. In Pro-
ceedings of the 2015 Workshop on Pervasive Wireless
Healthcare, pages 29–34. ACM.
Fida, B., Bernabucci, I., Bibbo, D., Conforto, S., and
Schmid, M. (2015). Pre-processing effect on the accu-
racy of event-based activity segmentation and classifi-
cation through inertial sensors. Sensors, 15(9):23095–
23109.
Frenken, T., Lipprandt, M., Brell, M., G
¨
overcin, M., Wegel,
S., Steinhagen-Thiessen, E., and Hein, A. (2012).
Novel approach to unsupervised mobility assessment
tests: Field trial for atug. In Pervasive Comput-
ing Technologies for Healthcare (PervasiveHealth),
2012 6th International Conference on, pages 131–
138. IEEE.
Fudickar, S., Karth, C., Mahr, P., and Schnor, B. (2012).
Fall-detection simulator for accelerometers with in-
hardware preprocessing. In Proceedings of the 5th
International Conference on Pervasive Technologies
Related to Assistive Environments, PETRA ’12, pages
41:1–41:7. ACM.
HEALTHINF 2018 - 11th International Conference on Health Informatics
46

Hellmers, S., Fudickar, S., B
¨
use, C., Dasenbrock, L.,
Heinks, A., Bauer, J. M., and Hein, A. (2017a). Tech-
nology supported geriatric assessment. In Ambient As-
sisted Living, pages 85–100. Springer.
Hellmers, S., Fudickar, S. J., Dasenbrock, L., Heinks, A.,
Bauer, J. M., and Hein, A. (2017b). Understand-
ing jump landing as an oscillating system: A model-
based approach of balance and strength analyses. In
HEALTHINF, pages 159–168.
Hellmers, S., Steen, E.-E., Dasenbrock, L., Heinks, A.,
Bauer, J. M., Fudickar, S., and Hein, A. (2017c). To-
wards a minimized unsupervised technical assessment
of physical performance in domestic environments.
Pervasive Health.
Khan, A. M., Lee, Y.-K., Lee, S. Y., and Kim, T.-
S. (2010). A triaxial accelerometer-based physical-
activity recognition via augmented-signal features and
a hierarchical recognizer. IEEE transactions on infor-
mation technology in biomedicine, 14(5):1166–1172.
Lester, J., Choudhury, T., and Borriello, G. (2006). A
practical approach to recognizing physical activities.
In International Conference on Pervasive Computing,
pages 1–16. Springer.
Nightingale, E. J., Pourkazemi, F., and Hiller, C. E. (2014).
Systematic review of timed stair tests. J Rehabil Res
Dev, 51(3):335–50.
Reid, K. F. and Fielding, R. A. (2012). Skeletal muscle
power: a critical determinant of physical functioning
in older adults. Exercise and sport sciences reviews,
40(1):4.
Shoaib, M., Bosch, S., Incel, O. D., Scholten, H., and
Havinga, P. J. (2014). Fusion of smartphone mo-
tion sensors for physical activity recognition. Sensors,
14(6):10146–10176.
Stacoff, A., Diezi, C., Luder, G., St
¨
ussi, E., and Kramers-
de Quervain, I. A. (2005). Ground reaction forces on
stairs: effects of stair inclination and age. Gait & pos-
ture, 21(1):24–38.
Sun, L., Zhang, D., Li, B., Guo, B., and Li, S. (2010). Ac-
tivity recognition on an accelerometer embedded mo-
bile phone with varying positions and orientations. In
International Conference on Ubiquitous Intelligence
and Computing, pages 548–562. Springer.
Zech, A., Steib, S., Freiberger, E., and Pfeifer, K. (2011).
Functional muscle power testing in young, middle-
aged, and community-dwelling nonfrail and prefrail
older adults. Archives of physical medicine and reha-
bilitation, 92(6):967–971.
Zheng, E., Chen, B., Wang, X., Huang, Y., and Wang, Q.
(2014). On the design of a wearable multi-sensor
system for recognizing motion modes and sit-to-stand
transition. International Journal of Advanced Robotic
Systems, 11(2):30, 1–8.
Stair Climb Power Measurements via Inertial Measurement Units - Towards an Unsupervised Assessment of Strength in Domestic
Environments
47
