
A Home-based Early Risk Detection System for Congestive Heart
Failure using a Bayesian Reasoning Network
Athanasia Lappa
1
and Christos Goumopoulos
2,3
1
School of Science and Technology, Hellenic Open University, Patras, Greece
2
Dynamic Ambient Intelligent Systems Unit, Computer Technology Institute and Press Diophantus, Patras, Greece
3
Information and Communication Systems Engineering Department, Aegean University, Greece
Keywords: Ambient Assisted Living, Risk Detection Algorithm, Bayesian Network, Congestive Heart Failure,
Deviation Index, Remote Healthcare, Multi-layered Architecture, Sensors, Pervasive Computing.
Abstract: Congestive heart failure (CHF) is a progressive condition in which the heart is no longer capable of
supplying adequate oxygenated blood to the body. Since the incidence of CHF increases with age, mainly
due to the development of heart failure risk factors the epidemic of CHF is expected to grow further in the
coming decades and thus becoming an important public health problem. In this paper we present a risk
detection system for CHF that uses a Bayesian Network (BN) combined with health measurements that can
be taken in a home environment using ambient assisted living technologies. The algorithm is empowered by
employing statistical and medical analysis of the stored biological data and the output can be used as a basis
for triggering proper preventive interventions. The BN design was established by surveying the relevant
literature and consulting the domain expert. The network content combines both biometric variables that are
daily monitored and data from patient’s clinical history as well as additional heart failure risk factors in
terms of the EuroSCORE model. The predictive validity was tested with the involvement of the domain
expert who specified proper validation rules in terms of criteria for detecting a CHF risk.
1 INTRODUCTION
According to the World Health Organization
cardiovascular diseases (CVDs) are the prime cause
of death worldwide (World Health Organization,
2016). In 2012, an estimated 17.5 million people
died from CVDs, representing 31% of all global
deaths. Preventive medicine and early risk detection
are critical factors to reduce mortality and the
associated healthcare system overheads.
Traditional heart disease treatment protocols are
costly and require periodic visits at healthcare
centers which are uncomfortable, especially for
seniors suffering from chronic heart failure. ICT
developments, however, in terms of wireless body
sensor networks, ambient assisted living
technologies, computational techniques and
inference algorithms are changing the way how
healthcare services are provided (Rashidi and
Mihailidis, 2013). For instance, vital biological
parameters such as Electrocardiogram (ECG), heart
rate, systolic/diastolic pressure and temperature can
be measured accurately and in real-time by wearable
and mobile sensors and transmitted wirelessly to a
gateway device (e.g. smartphone, tablet). The latter
forwards the collected information through web
connectivity to remote servers for storage and
analysis by medical experts or algorithms in order to
make the appropriate decisions.
In this paper we present a home-based early risk
detection system for senior patients suffering from
congestive heart failure (CHF). Patients can take
medical measurements at the convenience of their
home using wearable sensors avoiding visits to
healthcare centers. Collected data are stored in a
database and are processed in real time by a risk
detection algorithm. This algorithm combines
statistical and medical analysis of the stored
biological data and a probabilistic reasoning
approach using a Bayesian Network (BN) in order to
detect possible alarms which can then trigger proper
preventive medical interventions. The BN combines
both biometric variables that are daily monitored
(ECG, blood pressure, heart rate, blood oxygen
saturation, temperature and weight) as well as data
from patient’s clinical history. The latter includes
58
Lappa, A. and Goumopoulos, C.
A Home-based Early Risk Detection System for Congestive Heart Failure using a Bayesian Reasoning Network.
DOI: 10.5220/0006300300580069
In Proceedings of the 3rd International Conference on Information and Communication Technologies for Ageing Well and e-Health (ICT4AWE 2017), pages 58-69
ISBN: 978-989-758-251-6
Copyright © 2017 by SCITEPRESS – Science and Technology Publications, Lda. All rights reserved

clinical measurements specified in the European
System for Cardiac Operative Risk Evaluation
(EuroSCORE) model that are used in order to
calculate the patient risk according to the logistic
formula given by EuroSCORE II (Nashef et al.,
2012).
The rest of this paper is organized as follows:
Section 2 examines related work, Section 3 presents
the proposed methodology in terms of the risk
detection algorithm and the developed system while
Section 4 discusses the validation of the developed
BN. Finally, our conclusions and suggestions for
future work are given.
2 RELATED WORK
Bayesian reasoning networks are often used in
disease diagnosis (Lucas et al., 2004). BN-based
prognostic systems for heart failure have been also
proposed (Gatti et al., 2012). In the study of Ghosh
and Valtorta (1999) a Bayesian decision network for
heart disease was developed from clinical data. The
constructed network was consisted of seventeen
variables chosen after an extensive study of the
relevant literature. The Noisy-OR approximation
was used to alleviate the difficulties involved in
providing statistical data for all possible
combinations of predecessor variables that, all or
some combination of them, may cause heart disease.
Some of the conclusions were that the ECG is a
sensitive and specific diagnostic tool and blood
pressure has significant role in the disease
occurrence.
Su (2001) developed an early warning system for
CHF using a BN. The network combined simulated
biometric data (weight and blood pressure) and the
location of the user to dynamically select context-
specific health questions. Answers to questions and
biometric data were then used by the BN to calculate
a probability that the user is at risk for CHF.
Auble et al., (2005) developed a prediction rule
to detect low-risk patients with heart failure by
analyzing through classification trees a large data
set. The variables used included demographic,
clinical, laboratory, electrocardiographic and
radiographic findings. The outcome was that an
individual patient can be identified as low risk based
on the presence of a few prognostic factors.
Visweswaran et al., (2010) used the same clinical
data sets and variables and developed algorithms
that perform Bayesian model averaging over a set of
models using the features of the patient case at hand
to predict heart failure prognosis.
Most of the above approaches represent research
efforts to develop BN models to support decision
making at a clinical or laboratory environment and
not systems that can be deployed in a home
environment to support early detection of CHF risk
by using medical sensors/devices in the context of
an ambient assisted living setting.
A number of out of hospital wearable real-time
monitoring systems have been proposed by
researchers for continuous medical care of patients
(Malan et al., 2004, Ko et al., 2010). In particular,
Suh et al., (2010) developed an automated vital sign
monitoring system for CHF patients. Through a
weight and activity with blood pressure monitoring
system, called WANDA, they could monitor
patients’ health status and behaviors in order to
provide health reminders and patient feedback. The
system has enabled patients to reduce or maintain
weight, and to reduce the amount of blood pressure
values which are out of the acceptable range.
However, most of such systems collect, process
and transmit vital measurements to healthcare
experts in order to remotely monitor their patients,
but they generally don’t detect CHF risks within the
collected data. This is the main difference compared
to our system.
3 METHODOLOGY
3.1 Risk Detection Algorithm
Figure 1 depicts the overall structure of the risk
detection algorithm. There are four categories of
data processing. Statistical analysis of biological
data detects considerable variations between the
current measurements and the corresponding history
data of the same patient. Medical analysis of
biological data is based on decision rules which use
threshold values specified by medicine science.
EuroSCORE risk calculation uses clinical history
data and medical examination measurements
(weight, pulmonary artery systolic pressure, etc.) as
a method to assess the health risk status for patients
that have been operated for heart failure. Finally, the
Bayesian reasoning network is used as a diagnostic
tool of possible medical risks based on multi-
parameter information provided by both medical
measurements and clinical history. The output of the
data processing will be one of the following states:
normal, pre-alarm and alarm. Normal indicates a
healthy state. Pre-alarm indicates initial evidence
which is not considered critical but should be taken
into account for further assessing patient’s health
A Home-based Early Risk Detection System for Congestive Heart Failure using a Bayesian Reasoning Network
59

state. Alarm indicates evidence that is considered as
an emergency for patient’s health and requires
immediate intervention.
Figure 1: Structure of the risk detection algorithm.
3.1.1 Statistical Analysis
The statistical analysis module of the risk detection
algorithm uses the Deviation Index (DI) metric,
which is the z-statistic quantity of Statistical Theory
measuring the deviation of the measured value of a
variable x, from the average value μ of the same
variable in standard deviation σ units of its
distribution (Altman, 1990):
DI
x
μ
σ
(1)
The DI value is associated with the probability of
a variable value and is used in the mechanism of the
pre-alarm estimation. The larger the DI absolute
value is, the more unlikely it is to observe such a
value and therefore the more noticeable the
difference from the normal.
Let tw
ij
=(t−Δt
ij
, t) be a time window from the
current point in time t until Δt
ij
time points in the
past, where index i denotes the variable under
consideration and index j denotes the time window
class. Different time window classes may be used
referring to different time phases spread in the
immediate past, e.g. tw
i1
is the most recent time
window of variable i, tw
i2
is the immediately
preceding time window of the same variable, etc.).
In the system database at time t−Δt
i1
the average
values (M
i
) of measurements are defined after
dividing the sum of the values of each variable with
their count (N
i
). After the interval Δt
i1
, L
i1
new
values are recorded (x
ik
) and the following
calculations are taking place in the context of the
current time window:
Mean value:
∑
x
L
(2)
Sum of squares:
x
(3)
Standard dev:
(4)
Based on Eqs (2)-(4) the new mean value and
standard deviation for all measurements of the
variable i at time t are updated:
Mean value
(total):
,
∙
∙
L
(5)
Sum of
squares
(total):
,
(6)
Standard
dev (total):
,
,
,
(7)
where N
i,new
= N
i
+ L
i1
.
Based on Eqs (5)-(7) the following formulas can
be used to calculate DI resulting in different
sensitivity of the pre-alarm status estimation:
Instant
DI:
,
,
(8)
Time
Window
DI:
,
,
(9)
ΔTW DI:
(10)
,
,
,
,
A high value of instant DI (Eq. (8)) corresponds
to a significantly differentiated measurement in
relation to the history of the measurements and thus
this is assessed as a component of the pre-alarm
status for a patient. However, the transient deviation
of a measurement from the total mean value,
although important, is likely to appear due to noise
factors. On the other hand, a high DI value featuring
a whole time window, offers a more reliable
indication for transition to the pre-alarm status (Eq.
(9)). Finally, the detection of significant variations
between time windows of different classes (on the
same variable) can support the assessment that the
patient undergoes a transition from a clinical state to
another as described by Eq. (10). In this formula the
tw index value 1 refers to the time window of first-
class (most recent) and the value 2 to the time
window of second order (preceding of the first).
These time windows encapsulate the necessary
ICT4AWE 2017 - 3rd International Conference on Information and Communication Technologies for Ageing Well and e-Health
60
information regarding the classification of the
patient's state at the current phase, and can have
different durations depending on the variable under
consideration. In our prototype the duration of tws is
defined to 5-7 days based on the feedback provided
by the medical experts.
The deviation index value for a variable x is then
categorized based on medical expert empirical
knowledge according to the formula:
CDI
0DI1.5
11.5DI3
2DI3
11
For DI > 3 the observed value occurs with
probability less than 0.3% and this signifies a strong
pre-alarm. For 1.5 < DI 3 the observed value
occurs with probability approximately 13% and
signifies a moderate pre-alarm. For DI 1.5 the
observed value occurs with probability
approximately 87% and signifies a normal state.
3.1.2 Medical Analysis
The medical analysis component of the risk
detection algorithm examines whether medical
variable measurements (i.e. average values of the
current time period) are exceeding normal value
ranges in order to be classified as normal or
abnormal based on criteria related to the patient
profile. Table 1 gives normal value ranges in typical
resting state for medical parameters as suggested by
medical experts and literature for the target patients
(Kucia and Quinn, 2013, Webster, 2014).
Table 1: Normal value ranges of medical parameters.
Parameter Normal Range
ECG QRS width/amplitude
60-110msec/
1mV
ECG P-wave width/amplitude
80-110ms/0.1mV
ECG T-wave width/amplitude
160-200ms/0.25mV
heart rate 60-100bpm
systolic pressure 100-130mmHg
diastolic pressure 60-85mmHg
blood oxygen saturation 96%-100%
temperature 36.1
ο
C-37.4
o
C
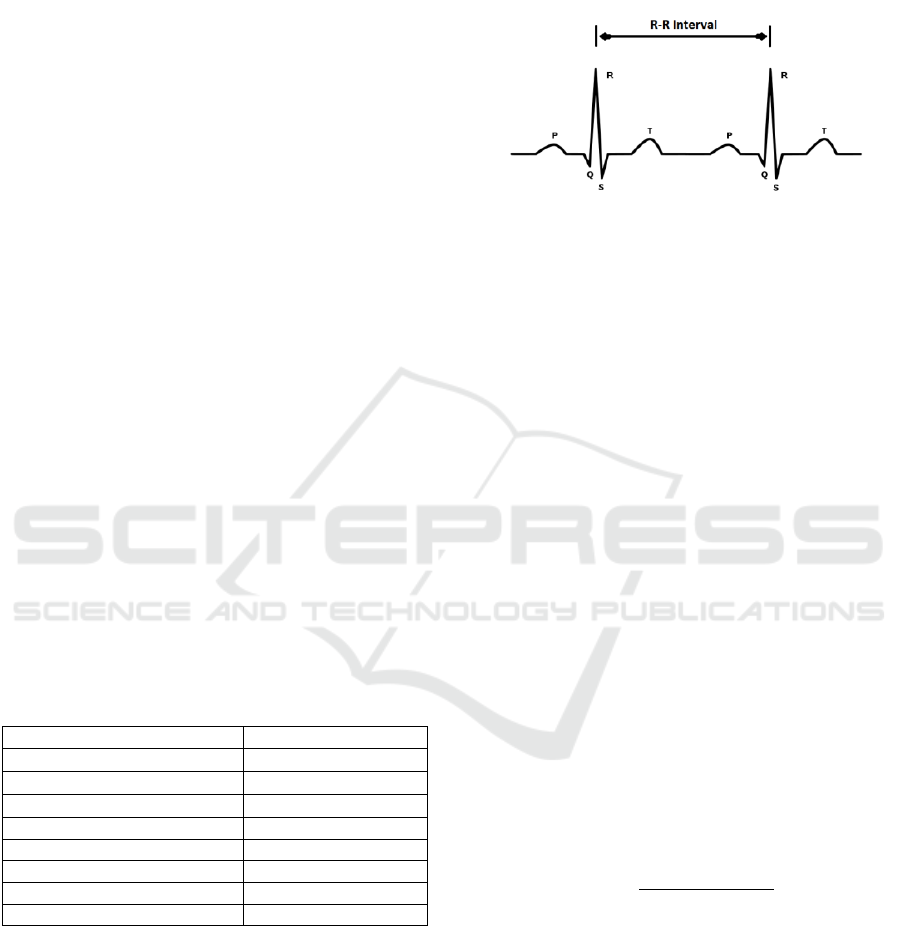
A basic parameter is the Electrocardiogram
(ECG) signal which measures the electrical activity
of the heart. Figure 2 depicts a typical ECG
waveform which is composed of a series of positive
and negative waves identified by the symbols P, Q,
R, S, and T. A normal waveform combines three
different segments identified as the P wave, the QRS
complex and the T wave referring to depolarization
or repolarization of some region in the heart (Dale,
2000). The R-R interval variable denotes the time
between two consecutive R waves and a time series
of this variable is used to calculate heart rate in beats
per minute (bpm).
Figure 2: A typical ECG signal.
The output of medical analysis is fed to the
Bayesian Reasoning Network as part of the model so
that the system can estimate a dynamic risk evidence
as an alarm for the patient.
3.1.3 EuroSCORE Risk Calculation
Various prediction models have been developed in
the field of medicine for determining patient risk.
Most of these are related to the field of cardiology,
and one of them is the EuroSCORE, which was
developed for predicting the mortality risk
probability of a patient during or shortly after
cardiac operation. Latest and most updated
EuroSCORE model is the EuroSCORE II (Nashef et
al., 2012), which uses the same logistic formula as
the original EuroSCORE (Nashef et al., 1999), but
encompasses extra risk factors and was validated by
a highly accurate database with data collected from
22,381 patients at 154 hospitals in 44 countries.
EuroSCORE II risk factors include factors relevant
to patient, to heart health and to cardiac operation. In
our approach, EuroSCORE II is used as one of the
risk estimation factors for patients with CHF.
The formula that calculates the patient risk by
EuroSCORE is given below:
∑
1
∑
(12)
where e is the base of the natural logarithm, β
0
is
a constant (−5.324537), x
i
is a categorical risk factor
with value 1/0 if present/absent and β
i
is the
coefficient of the variable x
i
as shown in Table 3 in
the Appendix.
The value calculated by Eq. (12) is then
categorized according to the following formula
based on the application of the scoring system
suggested by the euroSCORE model and is fed to
the Bayesian Reasoning Network.
A Home-based Early Risk Detection System for Congestive Heart Failure using a Bayesian Reasoning Network
61

0.03
0.030.07
0.07
(13)
3.1.4 Bayesian Reasoning Network
Bayesian Networks (BNs) belong to the category of
Probabilistic Graphical Models, particularly in the
specific category of Directed Acyclic Graphs, in
which the nodes represent variables and arcs
represent relationships between them. BNs are ideal
for representing causal relations and offer the
possibility of creating intelligent systems with
automated reasoning. In fact, they are knowledge or
model based systems, wherein the knowledge is the
BN and the reasoning engine is based on the laws of
Probability Theory (Pearl, 2014). The basic concept
in BNs is that probabilities can be assigned to
variable values and by applying the Bayes laws
these probabilities can be updated given new
measurements.
The arcs connecting two nodes denote the
statistical dependence of the corresponding variables
and are quantified by Conditional Probability Tables
(CPTs). CPTs contain all the conditional probability
combinations expressed as
/
, where: π is a
child variable, i.e. the node on which the arc is
pointing; γ is a parent variable; i is a possible value
of variable π; and j is a possible value of variable γ.
Parent nodes model causes and children nodes
model effects. A node in a BN may have more than
one parents. In this case the conditional probability
is expressed as
/
,
,
,… which is
interpreted as the probability of observing the value i
for the variable π within the subpopulation of data
given that the variable γ
1
has taken the value j, the
variable γ
2
has taken the value k, and so on.
The calculation of this conditional probability
based on the stored data and given the known
structure of the BN may be performed as follows.
Conditional probability calculation algorithm:
Let a child variable π with m possible values and
connected to k parent nodes each of which with
,
,…
possible values.
For each value combination j of the total
∙
∙
…∙
combinations the parent nodes can take,
repeat the steps:
1. Search and count the number of records that
contain the combination j of the parent nodes: Ν
j
2. For each value i of the total m values the
variable π can take repeat steps 3 & 4
3. Search and count the number of records that
contain the combination j of the parent nodes and
the value of the variable π is the ith: Ν
ij
4. Calculate the probability:
/
When all
/
quantities have been
calculated, i.e. the probability to observe an effect
given the existence of a specific cause, the BΝ is
updated, which is then ready to be used with the
support of special software libraries for reasoning
the quantities that we are interested in, i.e. the
probability to exist a risk given that certain
effect/symptom has been observed,
/
.
When a node has more than two parents the
calculation of such probabilities is conceptually
complex. Furthermore, the reliability of the
calculated probability is small because the
calculations are based on small sub-populations of
the database. For this reason when both parent and
child nodes are discrete binary variables (e.g.,
TRUE/FALSE or NORMAL/ABNORMAL) we can
assume a causal independence among the modeled
causes and their common effect which is known as
the Noisy-OR model (Pearl, 2014). According to this
model each of the parent variables γ
i
is considered as
a possible cause of the child variable π, which can
cause the effect by itself, with a certain probability
p
i
. Then the probability that the child variable is
TRUE is given by Eq. (14).
|
11
∈
(14)
where the product contains only the factors
corresponding to parent variables that are TRUE
(
∈
).
An extension of the Noisy-OR model is the leaky
Noisy-OR approach which attempts to solve the
practical problem that not all causes of an effect can
be modeled in a BN. This solution uses the notion of
p
leak
, which is the total probability of the causes that
have not been modeled and can be regarded as one
of the causes which may cause the result. Eq. (14) is
then updated as follows:
|
11
1
∈
(15)
CHF disease includes many causes and effects
(Braunwald and Bristow, 2000). Medical studies
were used to determine dependencies and the initial
conditional probabilities employed in the network
(Long et al., 1997, Ghosh and Valtorta, 1999, He et
al., 2001). In particular, the predictive significance
ICT4AWE 2017 - 3rd International Conference on Information and Communication Technologies for Ageing Well and e-Health
62
of systolic and diastolic blood pressure is well
known (Haider et al., 2003). Heart rate is also
considered as a prognostic factor of CHF risk for
seniors while ECG establishes a diagnostic factor.
Discussions with medical experts provided insight
in order to simplify the network using only the
variables that are most relevant in the specific
problem domain, to adjust conditional probabilities
in specific arcs of the network and to specify
validation rules as expressions of criteria for
detecting a CHF risk. Finally, a significant factor for
selecting the key BN variables was their suitability
regarding the collection of the relevant medical data
in a home setting.
Categorical medical variables provided by the
medical analysis phase and the categorized
EuroSCORE risk value derived by Eq. (13) were
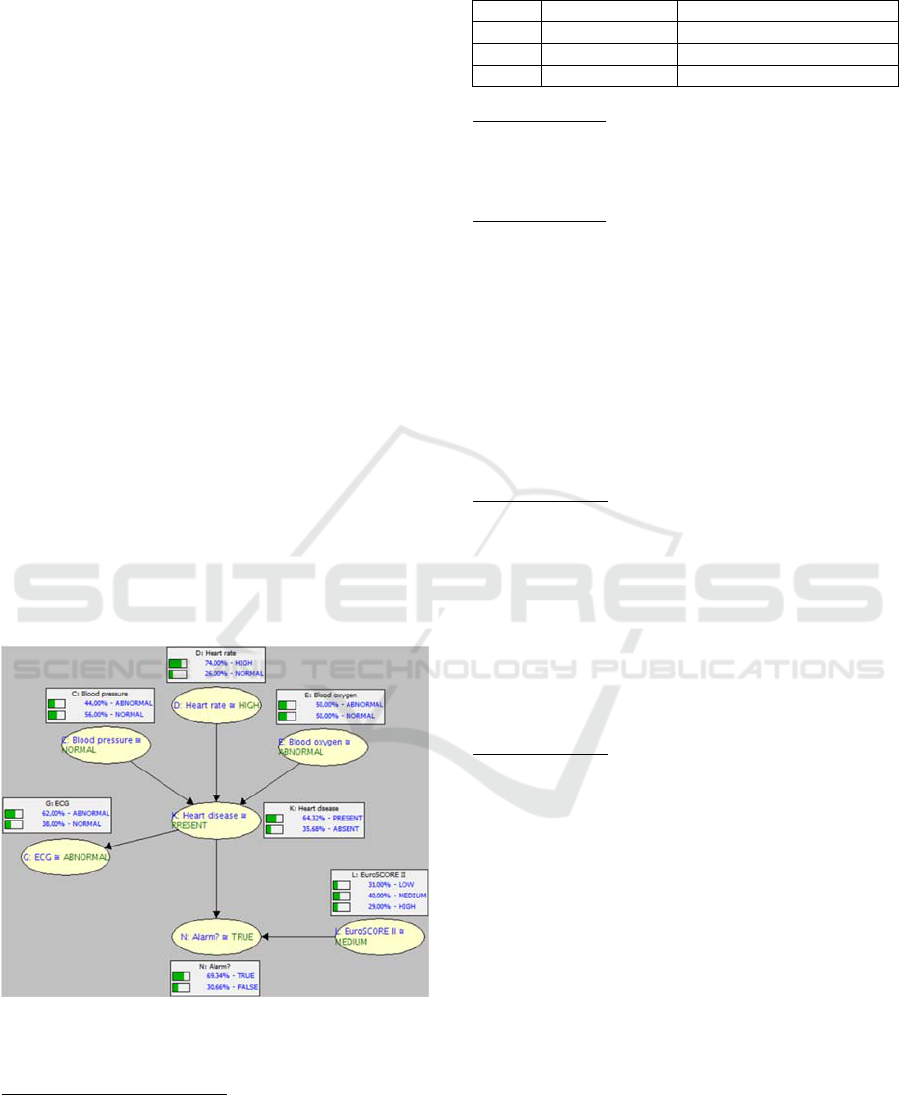
promoted to the BN as evidence variables. Figure 3
depicts the BN structure established for the risk
detection of CHF. The prior probabilities of the
categorical values for variables without parents were
given. Conditional probabilities for variables with
parents were also defined. Figure 3 shows also the
probabilities of each variable in the case when no
evidence is provided, i.e. the risk probability
calculated by the model reflects only the input
probabilities of the variables.
In the following we explain the conditional
probabilities assigned in the BN model.
Figure 3: BN structure for risk detection of CHF when no
evidence is given.
CPTs of nodes (C), (G), (D)
Prior probabilities of nodes representing the medical
variables “Blood pressure” (C), “Heart rate” (D) and
“ECG” (G) were defined according to the study of
Ghosh and Valtorta (1999). Table 2 gives the
NORMAL value probability for the specific nodes.
Table 2: Prior probabilities based on literature.
Node Variable Normal value probability
C Blood pressure 0.56
D Heart rate 0.26
G ECG 0.38
CPT of node (E)
Blood oxygen is associated with other diseases so
there are equal chances of influence. For this reason
the prior probability of node (E) was set to 0.5.
CPT of node (L)
Prior probabilities of node “EuroSCORE II” (L),
were defined based on EuroSCORE model data. In
the EuroSCORE model from 14,799 patients, 4,529
had low risk, 5,977 had medium risk and 4,293 had
high risk. So we defined the following prior
probabilities of node (L):
p
0.31
(16)
0.40
(17)
pL
0.29
(18)
CPT of node (K)
The CPT of node “Heart Disease” (K) given nodes
C, D and E was defined using the leaky Noisy-OR
formalism. Table 4 in Appendix gives the contents
of this CPT using as p
leak
=1−0.93=0.07, where 0.93
is the probability of state “Present” in node K when
all parent nodes are in “Abnormal” state. The
conditional probability of node G given node K is
defined as:
|
0.95
(19)
CPT of node (N)
The CTP of node “Alarm” (N) given nodes K and L
was defined using the Total Probability Theorem as
described by Eq. (20).
|,
|
|
(20)
Typically the alarm outcome given that the heart
disease is present can be set to 0.99:
|
0.99
(21)
Also based on the EuroSCORE model data from the
698 deaths, 36 were low risk patients, 182 were
medium risk patients and 480 were high risk. So we
have the following probabilities per category:
p
N
|
L
0.05
(22)
p
N
|
L
0.26
(23)
p
N
|
L
0.69
(24)
Table 5 in Appendix gives the contents of this CPT.
A Home-based Early Risk Detection System for Congestive Heart Failure using a Bayesian Reasoning Network
63
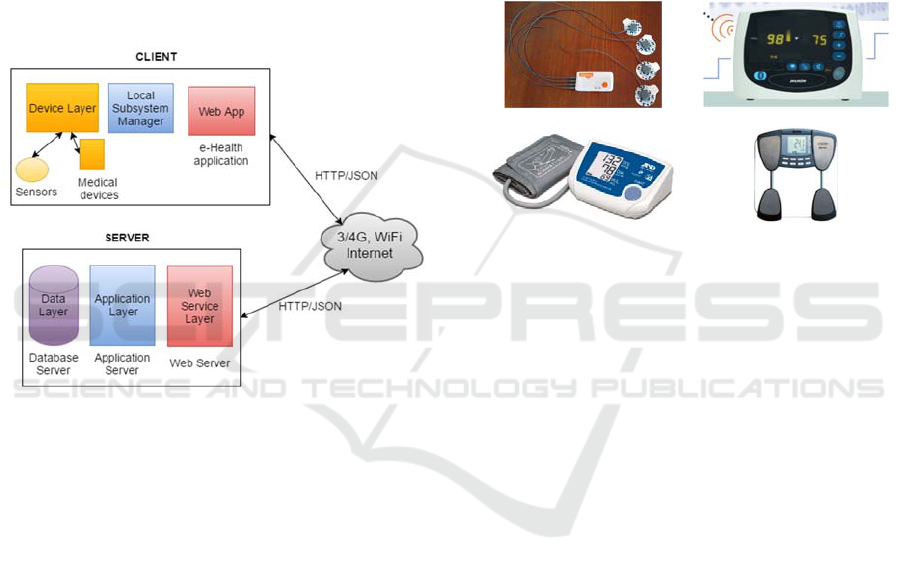
3.2 System Architecture
The system follows a multi-tier client/server
architecture. The specific model was chosen because
of its scalability, reusability and maintenance
capabilities. System architecture is given in Figure 4.
The system gathers information using devices and
sensors in the user’s local space and filters this
information in the Local Subsystem Manager (LSM)
before forwarding the formatted information to the
remote server that can take decisions about the
patient’s status. This multi-layer approach makes
integration of new sensors and smart devices easier
and hides the complexity of the system as well as the
different technologies used between the layers.
Figure 4: System architecture.
A simple usage scenario of the system goes as
follows: The system notifies the patient to take a
measurement (e.g., blood pressure). The data is
collected by the LSM through the device’s
communication protocol. LSM packages the data
into a secure JSON envelope and sends it to the
server. The server combines the data with past
measurements (e.g., taken during the past week) and
analyses the patient’s current status by running the
risk detection algorithm described in Section 3.1.
The system may decide that there is a possibility of
health risk, so it sends a message back to the local
system for a pre-alarm warning and communicates
with the local administrator. When the LSM receives
the pre-alarm message, it sends it to a notification
device which warns the user to communicate with
the doctor because the readings aren’t so good.
3.2.1 Device Layer
The device layer contains all the devices and
services that are deployed in the user’s local space.
These are not used just for sensory input but they
also provide actuation (such as displays or speakers
for warning messages).
Figure 5 displays the medical sensors and
devices required for the measurements. The
Shimmer ECG sensor, the AnDMedical UA-
767PBT blood pressure device and the Tanita BC-
590BT weight scale use Bluetooth for wireless
transmission of their measurements. The Avant 4000
Digital Pulse Oximetry System measures the blood
oxygen saturation and transmits its data into a virtual
serial port through a USB adaptor.
ECG sensor SPO2/Pulse rate device
Blood pressure device Weight scale
Figure 5: Sensors and devices.
For example, for measuring the ECG signal we
have used Shimmer’s wearable sensor board. The
ECG sensor node is strapped to an elastic chest belt
and three of the four electrodes are placed on the
body to form lead II and lead III recording
configurations according to the manual instructions.
To gather the data the Multi Shimmer Sync for
Windows application is used with a sampling rate of
100 Hz. The Pan-Tompkins algorithm (Pan and
Tompkins, 1985) is used to detect the QRS-
complexes in the ECG signal and then the duration
and amplitude can be calculated so that the threshold
values defined in Table 1 can be checked to decide
the normal or abnormal classification.
3.2.2 Local Subsystem Manager
The LSM is a composite process in the client-side of
the system and is responsible for the following
operations:
User notification to start a periodic measurement
process
Data gathering from the medical sensors and
devices
Temporary storage of data in case of network
problems with the server
ICT4AWE 2017 - 3rd International Conference on Information and Communication Technologies for Ageing Well and e-Health
64

Validity checking of the data based on the
normal value ranges defined by domain experts
(see Table 1)
Data forwarding to the server
Receiving commands and processed responses
(pre-alarms, alarms) from the server
User notification management through warning
messages
When it's time to initiate a periodic
measurement, the LSM creates the appropriate
messages to enable the relevant devices for starting
measurements and prepares the appropriate data
structures to store the data from the devices. In
addition the LSM updates the graphical user
interface for the presentation of messages to the user
with a set of instructions for using the devices.
3.2.3 Web App
The Web App provides the following main
functionality:
A personal profile interface where the user can
enter patients’ personal information as well as
relevant chronic diseases (Figure 6);
A GUI to simulate sensor measurements for
debugging purposes;
An interface where the history measured data can
be displayed in graphs;
An interface to manage reports;
An interface to provide notification to the user;
An interface to create new users and to define
new time periods for measurements and new
thresholds for the medical analysis process.
Figure 6: Web app GUI.
3.2.4 Web Service Layer
The web service layer receives and sends messages
from/to the client and also communicates with the
application layer. The communication mechanism is
based on sending messages through the HTTP
protocol, using the representational state transfer
(REST) model. The header of the message should
contain the data types of the measurement values
and a key for authentication purposes. In case the
client-side posts measurement data, instead of
getting data, the HTTP message body will contain
the measurement data with the types specified in the
header. For example, the body of a measurement
message will have the form given in Figure 7.
Figure 7: Measurement message structure.
3.2.5 Application Layer
The purpose of the application layer is to collect the
data for each patient from each local subsystem and
to run the health risk assessment algorithm, which
may derive pre-alarm or alarm states. In such cases
the system either notifies its administrator to contact
the patient or sends back to the local subsystem the
appropriate notification messages in order to be
presented to the user using his local devices.
The application layer contains in the
implemented Java classes the business logic of the
system. In particular, it encompasses the Bayesian
reasoning network component and interacts with the
data layer for storing measurements and
EuroSCORE values. The application layer performs
the following four basic tasks: data retrieval, data
storage, patient’s EuroSCORE II model calculation
and risk detection estimation using the BN.
Initially the received JSON message with the
measurements is checked for integrity and then the
data are stored using the corresponding database
package procedures. The EuroSCORE II model
procedures are called to perform the calculation of
the model result. The risk detection algorithm can
then be initiated to check for an alarm. Figure 8
represents this process as an activity diagram.
A Home-based Early Risk Detection System for Congestive Heart Failure using a Bayesian Reasoning Network
65
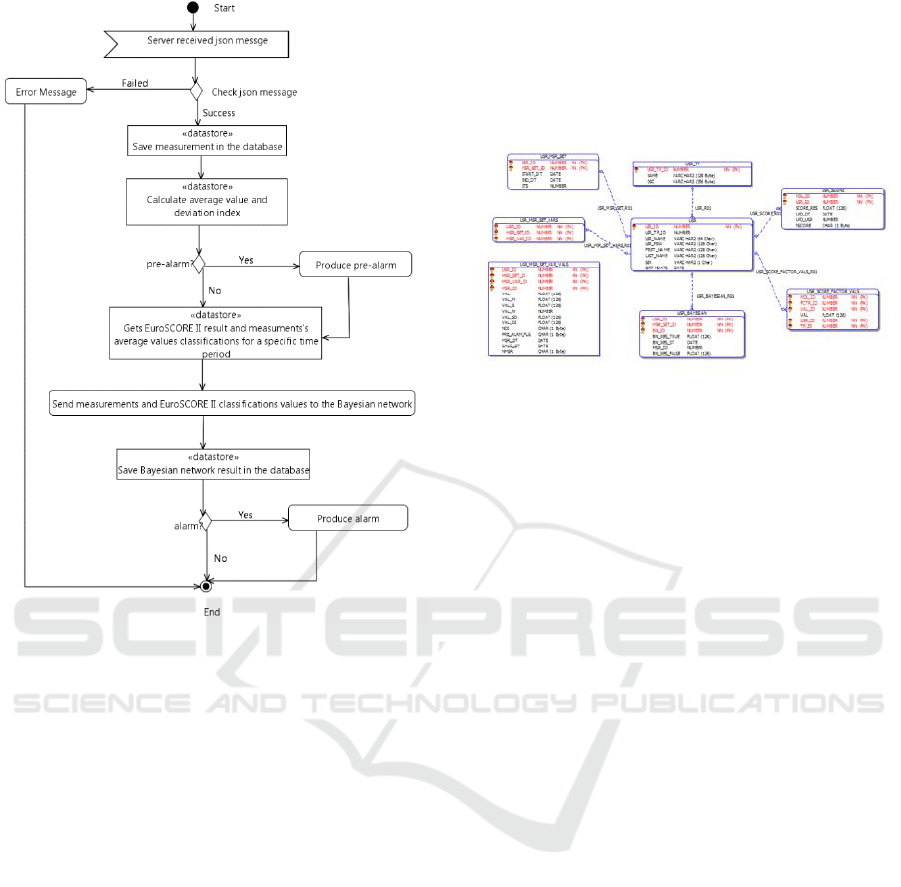
Figure 8: Activity diagram of the risk detection process.
3.2.6 Data Layer
The data layer was designed and implemented as a
relational database in Oracle platform which
provides all the necessary support for storing,
retrieving, updating and maintenance of data, as well
as the necessary mechanisms for ensuring data
integrity. The access to the data is performed
through database procedure packages and not
directly from table queries for transparency reasons
and separation of concerns between the data layer
and the application layer. Relational database tables
are classified into three categories:
Tables containing information describing the
EuroSCORE model.
Tables containing information describing
medical examinations for which the system
collects measurements.
Tables related to the patients’ medical history
and stored measurements.
In total there are 14 tables with 92 fields and 14
relationships between the tables. For example, the
entity-relationship diagram in Figure 9 depicts the
tables for storing user-related information such as
the user type (patient or doctor), user profile,
EuroSCORE II model results, values of risk factors,
time periods sets for measurements, measurements
per time period, detailed measurements of medicals
parameters collected by sensors as well as statistical
values and Bayesian reasoning network results
calculated by the system.
Figure 9: Entity relationship diagram for user tables.
3.3 Implementation Environment
The system was developed using several
implementation technologies. The application layer
and the LSM were developed in Java programming
language with the Eclipse Mars 2 (version: 4.5.2).
The Bluetooth stack of the operating system was
used to support the communication with the sensors.
The web app was develop in HTML 5 with
Bootstrap CSS framework (version 3.3.6) for cross-
browser compatibility, and with jQuery JavaScript
library (version: 1.12.3) for the asynchronous calls
to the restful web service. The latter was
implemented using HTTP and JSON data format for
transferring messages between the client and the
server.
The Bayesian reasoning network for the system
was designed and tested using Sensitivity Analysis
Modeling Inference And More – SamIam, a tool
developed at University of California at Los Angeles
(UCLA) for modeling and reasoning with BNs
(Darwiche, 2009). The Bayesian reasoning
component of the application was implemented with
the Jayes Java library.
Finally, the relational database was implemented
with the Oracle database Express Edition 11g
Release 2.
4 VALIDATION
System validation for good operation was performed
in terms of the predictive validity of the risk
detection algorithm. Due to the lack of reliable
clinical data to compare with the system predictions,
a domain expert (i.e. a cardiologist) was involved in
ICT4AWE 2017 - 3rd International Conference on Information and Communication Technologies for Ageing Well and e-Health
66
order to comment on the accuracy of the BN
reasoning. For each possible combination of variable
values the expert needs to specify a diagnosis and
compare it with the conclusion of the model. In our
model there are five evidence variables. Four of
them represent medical parameters which can take
one out of two values (abnormal/high, normal) and
the EuroSCORE variable which can take one of
three values (low, medium, high). So there are
2
*3
48 possible evidence combinations. All the
combinations were tested automatically using the
SamIam tool which calculates also the probability of
CHF risk. The task then is to locate a specific
threshold for the probability of CHF risk that divides
all the evidence combinations into alarm and no
alarm in the same manner as the domain expert.
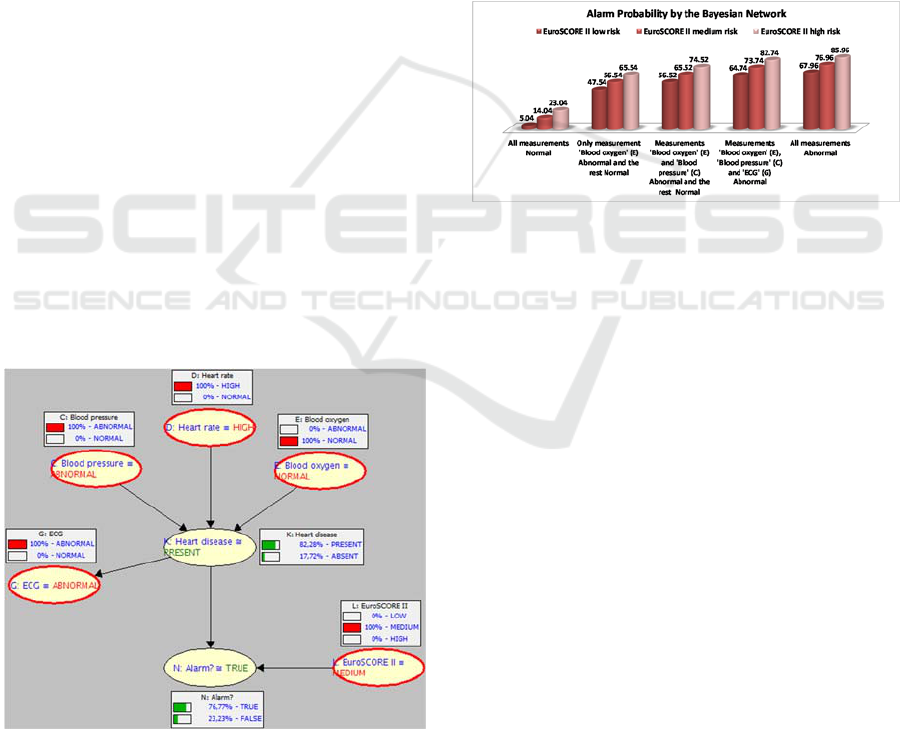
For example, given the query “What is the risk
when declining health evidence is given, i.e, blood
pressure, heart rate and ECG are high and the risk
of the EuroSCORE II model is medium?” the BN
model gave a probability 0.77 to produce the risk
alarm (Figure 10). Given that the alarm threshold
was found to be 0.65, the alarm signal is enabled.
The expert assessed the conclusions of the model as
reasonable and also specified the following
validation rules as expressions of criteria for which
the CHF risk should always be true:
Patients with LOW eSCORE risk must have
all measurements Abnormal.
Patients with MEDIUM eSCORE risk must
have at least two measurements Abnormal.
Patients with HIGH eSCORE risk and anyone
measurement Abnormal.
Figure 10: BN behaviour given certain measurements.
The graph in Figure 11 gives a comprehensive
view of the BN conclusions according to the
eSCORE risk category when different evidences
were generated. For patients with LOW eSCORE
risk and all four measurements Abnormal, the model
calculated an alarm probability of 67.96%, whereas
with three measurements Abnormal, the alarm
probability was 64.74%, slightly below the
threshold. For patients with MEDIUM eSCORE risk
and two measurements Abnormal, the model
calculated an alarm probability of 65.52%, whereas
with only one Abnormal measurement the alarm
probability was 56.54%. Finally, for patients with
HIGH eSCORE risk and one measurement
Abnormal, the model calculated an alarm probability
of 65.54%, whereas with all measurement Normal
the alarm probability was 23.04%, well below the
threshold. Consequently, we observe that the BN
fulfills the criteria recommended by the expert in
order to generate an emergency alarm.
Figure 11: Bayesian result by risk category.
Beyond predictive validity a BN model should
be also checked regarding the mechanism through
which this prediction is obtained. Pitchforth
andMengersen (2013) suggested that seven
dimensions of validity in a BN model should be
examined: nomological, face, content, concurrent,
predictive, convergent and discriminant validity.
The use of BNs in medical problems for
diagnostic and alerting purposes is common and it
has been successfully applied thus covering the
nomological validity. The involvement of the
domain expert in testing the predictive validity
ensures the face validity. The content validity is
satisfied because the structure of the BN was
decided by consulting both medical experts and the
literature. Moreover, the constructed model is simple
enough, without a large number of nodes or arcs so
as to become computationally intractable. The
constructed model does not contain any sub-
networks so the concurrent validity does not apply.
Convergent validity as well as discriminant validity
are achieved because risk diagnosis is done from
symptoms/signs to causes.
Finally, the risk values of the EuroSCORE II
model calculated by the system were compared to
the values calculated by the on-line EuroSCORE
A Home-based Early Risk Detection System for Congestive Heart Failure using a Bayesian Reasoning Network
67

calculator (http://www.euroscore.org/calc.html) for
the same inputs and were found to be equal.
5 CONCLUSIONS
The main contribution of this paper is a
methodology that combines biological parameters
with heart failure risk factors to design a new early
risk management system for seniors suffering from
CHF. The core of the system is the risk detection
algorithm whose functionality is not limited to
monitoring health parameters and comparing the
measured values with predefined thresholds.
Through a combination of medical and statistical
analysis of the measured health variables and the
employment of probabilistic reasoning techniques
health status decline can be effectively identified
generating pre-alarm and alarm notifications which
can be exploited for providing medical interventions.
Based on the validation performed, we argue that
the use of a probabilistic reasoning approach using a
BN can provide positive results on risk detection.
We tested the prediction validity of the BN with the
involvement of a medical expert in order to assess
the usefulness of the system.
The methodology and the technical solution
proposed could be applied to other health conditions
(e.g. hyperglycemia linked to diabetes) with the
proper extensions regarding health parameters and
BN structure and thus it could provide a multi-
disease health monitoring framework with integrated
risk detection capabilities.
We are currently working on a deployment of the
system to validate our experimental results in a pilot
study with real users. In addition, we would like to
investigate using sensor parameters from smart
environments, like environmental parameters and
activities of daily living (e.g., sleeping patterns), as
additional evidence variables to the BN.
Another enhancement to this work would be to
analyze the stored data in order to provide feedback
to doctors on the diagnosis and specific treatment
recommendations.
ACKNOWLEDGEMENTS
Part of this research has been co-financed by the
European Union (European Social Fund – ESF) and
Greek national funds through the Operational
Program "DEPIN" of the National Strategic
Reference Framework (NSRF) (Project code:
465435). The authors wish to thank the medical
experts for their valuable contribution in this study,
especially in the BN model validation process.
REFERENCES
Altman, D.G., 1990. Practical statistics for medical
research. CRC press.
Auble, T.E., Hsieh, M., Gardner, W., Cooper, G.F., Stone,
R.A., McCausland, J.B., Yealy, D.M., 2005. A
prediction rule to identify lowrisk patients with heart
failure. Academic emergency medicine, pp. 12, vol. 6,
pp. 514-521.
Braunwald, E., Bristow, M.R. 2000. Congestive heart
failure: fifty years of progress. Circulation, vol. 102,
no. 4, pp.4-23.
Dale, D., 2000. Rapid Interpretation of EKG's: An
Interactive Course. Cover Publishing Company.
Darwiche, A., 2009. Modeling and reasoning with
Bayesian networks. Cambridge University Press.
Gatti, E., Luciani, D., Stella, F., 2012. A continuous time
Bayesian network model for cardiogenic heart failure.
Flexible Services and Manufacturing Journal, vol. 24,
no 4, pp. 496-515.
Ghosh, J.K., Valtorta, M., 1999. Probabilistic Bayesian
Network Model Building of Heart Disease.
Department of Computer Science, University of South
Carolina Columbia, SC 29208, Technical Report
TR9911.
Haider, A.W., Larson, M.G., Franklin, S.S., Levy, D.,
2003. Systolic blood pressure, diastolic blood
pressure, and pulse pressure as predictors of risk for
congestive heart failure in the Framingham Heart
Study. Annals of Internal Medicine, vol. 138, no. 1,
pp. 10-16.
He, J., Ogden, L.G., Bazzano, L.A., Vupputuri, S., Loria,
C., Whelton, P.K., 2001. Risk factors for congestive
heart failure in US men and women: NHANES I
epidemiologic follow-up study. Archives of internal
medicine, vol. 161, no. 7, pp. 996-1002.
Ko, J., Lim, J.H., Chen, Y., Musvaloiu-E, R., Terzis, A.,
Masson, G.M., Gao, T., Destler, W., Selavo, L.,
Dutton, R.P., 2010. Medisn: Medical emergency
detection in sensor networks. ACM Transactions on
Embedded Computing Systems, vol. 10, no. 1, p. 1-29.
Kucia, A., Quinn, T., 2013. Acute cardiac care: a
practical guide for nurses. John Wiley & Sons.
Long, W.J., Fraser, H., Naimi, S. (1997). Reasoning
requirements for diagnosis of heart disease. Artificial
intelligence in medicine, vol. 10, no. 1, pp. 5-24.
Lucas, P.J., van der Gaag, L.C., Abu-Hanna, A., 2004.
Bayesian networks in biomedicine and health-care.
Artificial intelligence in medicine, vol. 30, no. 3, pp.
201-214.
Malan, D., Fulford-Jones, T., Welsh, M., Moulton, S.,
2004. Codeblue: An ad hoc sensor network
infrastructure for emergency medical care. In
ICT4AWE 2017 - 3rd International Conference on Information and Communication Technologies for Ageing Well and e-Health
68

International workshop on wearable and implantable
body sensor networks, vol. 5.
Nashef, S.A., Roques, F., Michel, P., Gauducheau, E.,
Lemeshow, S., Salamon, R., EuroSCORE Study
Group, 1999. European system for cardiac operative
risk evaluation (EuroSCORE). European journal of
cardio-thoracic surgery, vol. 16, no. 1, pp. 9-13.
Nashef, S.A., Roques, F., Sharples, L.D., Nilsson, J.,
Smith, C., Goldstone, A.R., Lockowandt, U., 2012.
EuroSCORE II. European Journal of Cardiothoracic
Surgery, vol. 41, no. 3, pp. 734–744.
Pan, J., Tompkins, W.J., 1985. A real-time QRS detection
algorithm. IEEE transactions on biomedical
engineering, vol. 3, pp. 230-236.
Pearl, J., 2014. Probabilistic reasoning in intelligent
systems: networks of plausible inference. Morgan
Kaufmann.
Pitchforth, J., Mengersen, K., 2013. A proposed validation
framework for expert elicited Bayesian Networks.
Expert Systems with Applications, vol. 40, no. 1, pp.
162-167.
Rashidi, P., Mihailidis, A., 2013. A survey on ambient-
assisted living tools for older adults. IEEE Journal of
Biomedical and Health Informatics, vol. 17, no. 3, pp.
579–590.
Su, J.C., 2001. Developing an early warning system for
congestive heart failure using a Bayesian reasoning
network. Doctoral dissertation, Massachusetts
Institute of Technology.
Suh, M.K., Evangelista, L.S., Chen, C.A., Han, K., Kang,
J., Tu, M.K., Chen, V., Nahapetian, A., Sarrafzadeh,
M., 2010. An automated vital sign monitoring system
for congestive heart failure patients. In Proceedings of
the 1st ACM International Health Informatics
Symposium, pp. 108-117.
Visweswaran, S., Angus, D.C., Hsieh, M., Weissfeld, L.,
Yealy, D., Cooper, G.F., 2010. Learning patient-
specific predictive models from clinical data. Journal
of biomedical informatics, vol. 43, no. 5, pp. 669-685.
Webster, J.G., (2014). The Physiological Measurement
Handbook. CRC Press.
World Health Organization, 2016. Cardiovascular
Diseases. Available online:
http://www.who.int/mediacentre/factsheets/fs317/en/
(accessed on 15 December 2016).
APPENDIX
Table 3: EuroSCORE II model risk factors.
Risk factor Coeffic. Risk factor Coeffic.
NYHA LV function
II 0.1070545 Moderate 0.3150652
III 0.2958358 Poor 0.8084096
IV 0.5597929 Very poor 0.9346919
CCS4 0.2226147 Recent MI 0.1528943
IDDM 0.3542749 PA systolic pressure
Age 0.0285181 31–55mmHg 0.1788899
Female 0.2196434 ≥55 0.3491475
ECA 0.5360268 Urgency
CPD 0.1886564 Urgent 0.3174673
N/M mob 0.2407181 Emergency 0.7039121
Redo 01.118599 Salvage 1.362947
Renal dysfunction Weight of procedure
On dialysis 0.6421508 1 non-CABG 0.0062118
CC ≤ 50 0.8592256 2 0.5521478
CC 50−85 0.303553 3+ 0.9724533
AE 0.6194522 Thoracic aorta 0.6527205
Critical 1.086517 Constant −5.324537
For age, x
i
= 1 if patient age ≤ 60; x
i
increases by one point per
year thereafter (x
i
= 2 if age 61; x
i
= 3 if age 62 etc.).
Table 4: CPT of node (K).
C D E K
ABNORMAL ABNORMAL ABNORMAL 0.93
ABNORMAL ABNORMAL NORMAL 0.86
ABNORMAL NORMAL ABNORMAL 0.74
ABNORMAL NORMAL NORMAL 0.48
NORMAL ABNORMAL ABNORMAL 0.88
NORMAL ABNORMAL NORMAL 0.76
NORMAL NORMAL ABNORMAL 0.54
NORMAL NORMAL NORMAL 0.07
Table 5: CPT of node “Alarm?”(N).
K L N
Present Low 0.71
Present Medium 0.80
Present High 0.89
Absent Low 0.02
Absent Medium 0.11
Absent High 0.20
A Home-based Early Risk Detection System for Congestive Heart Failure using a Bayesian Reasoning Network
69
