
Reducing Visual Complexity in Software Maps
using Importance-based Aggregation of Nodes
Daniel Limberger, Willy Scheibel, Sebastian Hahn and J
¨
urgen D
¨
ollner
Hasso Plattner Institute, University of Potsdam, Potsdam, Germany
Keywords:
Treemap, Aggregation, Filtering, Level-of-Detail, Information Visualization, Interaction Technique.
Abstract:
Depicting massive software system data using treemaps can result in visual clutter and increased cognitive
load. This paper introduces an adaptive level-of-detail (LoD) technique that uses scoring for interactive aggre-
gation on a per-node basis. The scoring approximates importance by degree-of-interest measures as well as
screen and user-interaction scores. The technique adheres to established aggregation guidelines and was eval-
uated by means of two user studies. The first investigates task completion time in visual search. The second
evaluates the readability of the presented nesting level contouring for aggregates. With the adaptive LoD tech-
nique software maps allow for multi-resolution depictions of software system information while facilitating
annotation and efficient identification of important nodes.
1 INTRODUCTION
Software maps are 2.5D treemaps that visualize soft-
ware system information. They were introduced to
make code quality of software systems visible to
“stakeholders in the development process, particu-
larly, to the management” by means of visualiza-
tion of automated software analysis, metrics, and ac-
tivity data (Bohnet and D
¨
ollner, 2011). Depending
on their configuration, they facilitate exploring struc-
tures, monitoring development processes and soft-
ware quality over time, and identifying areas that re-
quire attention in the ongoing development process.
For a given task, a map theme configures a software
map by specifying the mapping of attributes to the vi-
sual variables (adequate color scheme, layout, etc.).
Treemaps represent well-known tree-structured
data by means of space-constrained, recursively
nested sets of rectangles that express data elements
(nodes). Their sizes are proportional to per-node
weights (Johnson and Shneiderman, 1991). Data as-
sociated with nodes, the attributes, can be mapped
by the visual variables (Bertin, 1967) such as rect-
angle size, color, texture, and shading. Variants of
treemaps are applied in a large number of applications
and systems to interactively display, explore, and an-
alyze multi-variate, hierarchical data of, e.g., file sys-
tems (Shneiderman, 1992), software system informa-
tion (Wettel and Lanza, 2008), business data (Vliegen
et al., 2006), stock markets (Wattenberg, 1999), or
controller performance data (Mitchell et al., 2004).
2.5D treemaps extend treemaps by using the third
dimension: rectangles are extruded to cuboids, keep-
ing the regular treemap’s two-dimensional reference
space and layout (Bladh et al., 2004). 2.5D treemaps
provide additional information display, that is, we can
also map attributes to the cuboids’ height and to visu-
ally relate more attributes in a single view.
excerpt w. visual clutter
When depicting large struc-
tures, however, the com-
mon 1:1 mapping of nodes
to cuboids can lead to vi-
sual clutter (Rosenholtz et al.,
2005) and increase their visual
complexity, an implicit mea-
sure of cognitive load and perceived interaction com-
plexity (Harper et al., 2009). Cognitive load thereby
describes the effort being used in working memory to
accomplish the given task. At worst, multiple nodes
are depicted within sub pixel space, which corrupts
the visual display (visual clutter) and prevents any
meaningful interpretation of the underlying data.
excerpt w. adaptive LoD
This article addresses these
limitations by introducing an
aggregation technique that re-
duces the visual complexity
by means of an importance-
based level-of-detail (LoD).
The LoD is implemented by means of adaptive ag-
176
Limberger D., Scheibel W., Hahn S. and DÃ ˝ullner J.
Reducing Visual Complexity in Software Maps using Importance-based Aggregation of Nodes.
DOI: 10.5220/0006267501760185
In Proceedings of the 12th International Joint Conference on Computer Vision, Imaging and Computer Graphics Theory and Applications (VISIGRAPP 2017), pages 176-185
ISBN: 978-989-758-228-8
Copyright
c
2017 by SCITEPRESS – Science and Technology Publications, Lda. All rights reserved

(a) (b) (c)
Figure 1: f.l.t.r.: stepwise bottom-up aggregation with con-
sistent mapping and avg. accumulation of underlying data.
gregation on a per-node basis. For it, we introduce an
importance measure that scores each node, e.g., based
on its attribute values, resulting area on screen, or user
interaction. This scoring is basically a “Degree of In-
terest [DoI] function which assigns to each point in
the structure, a number telling how interested the user
is in seeing that point, given the current task” (Furnas,
1986). The use of map themes narrows the impor-
tance of every node down to the attributes, mapping,
and user interaction, and thus, enabling approximate
scoring. A subsequent aggregation evaluates scores
on a per-node basis, resulting in drawing a node ei-
ther with or without its children. In the latter case
a node is denoted as aggregate and depicts the accu-
mulated underlying data using the same or a similar
visual mapping (Figure 1).
With this adaptive LoD technique, we introduce
software maps of minimum aggregation of areas con-
sidered interesting while maintaining valuable con-
text information summarized at lower resolutions
(Figure 2). We further describe the scoring and aggre-
gation steps and introduce enhancements to the visual
display of aggregates in the context of aggregation de-
sign guidelines. Finally, we discuss best practices and
evaluate several implications to user interaction.
Software map of 835.555 nodes with aggregation
Figure 2: Importance-based LoD reduces the software maps
visual complexity while preserving important information.
2 RELATED WORK
With respect to our approach, related work comprises
the fields of interactive treemaps, level-of-detail tech-
niques as well as hierarchical aggregation guidelines.
Interactive Treemaps. Since the original presen-
tation of 2D treemaps (Johnson and Shneiderman,
1991) a number of treemap layout variations have
been published, improving readability, stability, and
the graphical elements’ aspect ratio (Bruls et al.,
1999; Bederson et al., 2002; Tak and Cockburn,
2013). With the extension of 2D treemaps to 2.5D
treemaps (Bladh et al., 2004), several challenges
emerged, such as increased rendering costs, occlu-
sion of graphical elements, supplementing padding
(to enable the distinction of parents and auxiliary
for reducing occlusion), as well as the need for ad-
ditional, effective navigation techniques. Extruded
2D treemap shapes allow for a 3D attribute space
mapping to 3D substitutes within a treemap’s two-
dimensional reference space, hence, 2.5D. In contrast,
various visualization techniques such as treecube or
3D polar treemap (Johnson, 1993) are classified as
3D treemap that lay out hierarchy elements within
a three-dimensional reference space (Schulz et al.,
2011). However, it should be noted that the term 3D
treemap is often used to denote 2.5D treemap as well.
Similarly, we prefer the term software maps over
code cities (Wettel and Lanza, 2008), since (1) the
maps do not focus solely on source code, (2) the maps
lack any analogues for parks, streets, rivers, traffic,
etc, and (3) spatialization approaches usually do not
originate from city planning processes.
Implementing software maps in industry applica-
tions necessitates meaningful labeling. To this end,
our software maps utilize a concept first applied to
cascaded treemaps (L
¨
u and Fogarty, 2008), except
that the cascaded representation does not naturally
transfer to 2.5D. Instead, nested representation with
additional padding at one lateral surface of a parent
cuboid is used to provide sufficient space for labeling.
Level-of-Detail Techniques. The visualization of
massive amounts of items using 2D treemaps (Fekete
and Plaisant, 2002) causes visual clutter which drasti-
cally increases the cognitive load and is even worse
for 2.5D treemaps. “Clutter is the state in which
excess items, or their representation or organization,
lead to a degradation of performance at some task”
(Rosenholtz et al., 2005). This is resolvable via ab-
stracted depiction of cluttering nodes by means of ei-
ther temporal, spatial, or appearance distortion (El-
lis and Dix, 2007). Map themes applied to software
Reducing Visual Complexity in Software Maps using Importance-based Aggregation of Nodes
177

maps typically use a lines of code measure as weight
for spatialization in order to maintain a stable, recog-
nizable layout and consistent footprint mapping (e.g.,
when exploring different datasets of a single software
revision). In addition, even non-interactive depictions
should convey maximum information (e.g., for re-
ports on paper and other static provisioning), thus, we
rely on appearance distortion which constitutes the
abstraction through aggregation by means of strate-
gies changing the gestalt of node representation.
For aggregation of 2D and 3D graph clusters the
clusters’ bounding box can be used for the aggre-
gates’ shape (Balzer and Deussen, 2007). Aggrega-
tion strategies for tree visualizations (Munzner et al.,
2003) as well as for polar treemaps (Chuah, 1998)
were described, though, limited to planar represen-
tations and using no or basic LoD control. For 2D
treemaps, a progressive refinement strategy (Rosen-
baum and Hamann, 2009) as well as an aggrega-
tion approach using subdivided shapes were described
(Elmqvist and Fekete, 2010). Both approaches, how-
ever, focus on scarceness of rendering resource and
limited screen size only. For identification and explo-
ration of areas of interest through user navigation, the
hierarchical structure can be used as basis for zoom-
ing stages (Blanch and Lecolinet, 2007; Liu et al.,
2008). Our technique supports this implicitly through
navigation (e.g., zoom) and explicitly through user in-
teraction (e.g., fold/unfold) both by means of scores.
However, our approach aims to reduce the need for
user navigation in the first place and rely on auto-
mated DoI approximation instead. A multi-resolution
technique by means of data-dependent level-of-detail
with per-node aggregation was introduced (Hao et al.,
2007) for pattern detection in time series. Though,
pursuing the similar goal—utilize lower resolutions
for less important areas and higher resolutions for im-
portant ones—the technique uses adaptive layouting
and does not directly consider visibility constraints.
Aggregation Guidelines. Elmqvist and Fekete in-
troduced guidelines for hierarchical aggregation de-
scribing the characteristics of the resulting display of
aggregates from an observer’s perspective (Elmqvist
and Fekete, 2010):
G1 Entity Budget states that a maximum of dis-
played entities should be maintained.
G2 Visual Summary advises that aggregates should
convey information about their underlying data.
G3 Visual Simplicity requires aggregates to be
clean and simple in their presentation.
G4 Discriminability demands a distinguishable pre-
sentation of aggregates and data items.
G5 Fidelity indicates that abstractions and thus, their
resulting aggregates may lie about their underly-
ing data.
G6 Interpretability suggests aggregates to remain
always correctly interpretable within the visual
mapping.
These guidelines cannot be used as binary checklist,
but require interpretation within the visualization and
domain. Though not specifically designed for 2.5D
treemaps, we apply all of the above guidelines for the
design and evaluation of our LoD technique.
Generalization. The scoring and visual depictions
of aggregates described herein, though focusing on
rectangular-based software maps, can be generalized
for treemaps that are based on inclusion. We note that
there might be other scores for rectangular and non-
rectangular treemaps or 3D treemaps that are not dis-
cussed herein but can be accounted for by the gener-
alized scoring approach. The comprehensive work of
Schulz et al. 2011 enlists various 2D and 3D hierar-
chy visualizations and can be used for easy identifica-
tion of suitable visualization concepts.
3 AGGREGATION OF NODES
Rectangular software maps use cuboids to depict leaf
nodes and inner nodes. The map themes configura-
tion induces a leaf cuboid’s appearance with respect
to its visual variables—usually footprint, color, and
height. The tree-structure of the depicted data in-
duces a nesting of inner cuboids—nested representa-
tion with padding (L
¨
u and Fogarty, 2008)—and com-
municates module affiliation and hierarchy level in-
formation. We prefer to add labels on the top faces
of inner cuboids, sufficient space provided (additional
padding at one lateral surface), designating the rela-
tive path of depicted software module and choose to
use their luminance to encode the nesting level.
For the aggregation of an inner node, we replace
the associated inner cuboid and all subjacent leaf and
inner cuboids by a single aggregate cuboid. From
the perspective of visualization, the inner node then
becomes, essentially, a leaf node and could be rep-
resented as such: the aggregate cuboid’s visual vari-
ables, i.e., color and height, are now used to summa-
rize the mapped attribute values of underlying nodes
appropriately. Due to the recursive weight mapping,
the footprint of all underlying nodes is inherently ag-
gregated by the aggregate cuboid (padding included).
Using aggregation, topological overviews of large
datasets can be created, that help users to recognize
IVAPP 2017 - International Conference on Information Visualization Theory and Applications
178
and remember patterns and correlations of a dataset
in its entirety—the mental map (Misue et al., 1995).
The aggregation, as a consequence of scoring, has to
ensure that obvious, coarse features of a dataset are
not disguising less prominent but significant details
conveyed by nodes with high DoI (nodes-of-interest).
Therefore we present a multi-resolution scoring that
enables aggregation control on a global as well as lo-
cal, per-node basis. Globally, aggregation might be
omitted for nodes of certain hierarchy levels, e.g., the
first two hierarchy levels to prevent unnecessary ag-
gregation. Locally, the virtual camera’s viewport and
its distance to graphical elements can be used to pro-
vide adaptive LoD. A user may also like to explore
the treemap with locally adapting information density,
e.g., by means of elaborated focus+context concepts
such as lenses (Trapp et al., 2008).
A node n is scored by score functions s
c
that map
to the closed interval [−1, +1], striving either for or
against aggregation with s
c
> 0 or s
c
< 0, respectively.
c ∈ C thereby denotes one of various DoI criteria,
based on attribute, view, and user interaction metrics.
The total score of a node
¯
γ can be accumulated using
a weighted mean of the set of scores:
¯
γ =
∑
c
ω
c
s
c
∑
c
ω
c
, (1)
with ω
c
allowing for non-negative, domain or use-
case specific emphasis on specific scores. The adap-
tive level-of-detail process by means of scoring and
aggregation is illustrated in algorithm 1: it processes
a given tree-structured dataset with respect to a map
theme by accumulating attributes, scoring nodes, de-
riving total scores, and, finally, rendering and thereby
aggregating the nodes. The functions accumulate
and score denote fold operations, which recursively
aggregate attribute values and scores, respectively.
Various attribute aggregation operators are described
in section 4. For scoring and score weights ω
c
(used
in weighted_mean) use-case specific strategies might
be applied, accounting for the given task and domain.
In this article, however, we focus on attribute, view,
and user-interaction based scoring described in the
following subsections.
3.1 Attribute-based Scoring
Attribute-based scoring analyzes and assesses data at-
tributes mapped to the nodes’ visual variables and
their characteristics. For any given map theme,
attribute-based scoring provides principal scores for
automated DoI approximation and appropriate initial
aggregation. The usefulness of such scores strongly
depend on the map theme. We, therefore, briefly de-
scribe only a few scores typically used in our software
Algorithm 1: Scoring and aggregation of nodes.
1 Function process(tree, map theme)
2 nodes ← nodes of tree
3 attributes ← attributes in map theme
// attribute accumulation
4 foreach attribute in attributes do
5 accumulate(post order(nodes),
attribute, aggregation operator)
// calc scores for criteria (s
c
)
6 f unctions ← score functions in map theme
7 foreach function in functions do
8 score(post order(nodes), function)
// derive each node’s score (
¯
γ)
9 foreach node in nodes do
10 scores ← list of the node’s scores
11 node.score ← weighted mean(scores)
// render tree
12 root ← root node of tree
13 threshold ← aggr. threshold of map theme
14 draw(root, threshold)
15 Function draw(node, threshold)
16 if node is leaf then
17 render leaf cuboid(node)
18 return
// aggregation
19 if node.score ≥ threshold then
20 render aggregate cuboid(node)
21 return
22 render inner cuboid(node)
23 foreach child in node’s children do
24 draw(child, threshold)
maps. A variance score s
var
that calculates the vari-
ance or value range of an attribute, for example, can
be used to indicate inhomogeneous distribution of at-
tribute values among child nodes. It can be an impor-
tance measure configured to score against aggregation
and thereby encourage additional exploration.
Likewise, a child count score s
cc
either quanti-
fying the number of immediate children or absolute
number of all contained leaf nodes can be used to
lessen the chance of aggregation of structural com-
plex nodes (which not necessarily correlates to the
nodes’ footprint). Alternatively, the computation of
local outliers measuring a nodes isolation with respect
to its surrounding neighborhood can be implemented
using a local outlier factor (Breunig et al., 2000).
Reducing Visual Complexity in Software Maps using Importance-based Aggregation of Nodes
179

3.2 View-based Scoring
View-based scoring is common to most LoD tech-
niques and scores the visibility of graphical elements
on screen based on their screen space area. We use
a screen-space area score s
ssa
that approximates the
number of pixels eventually used for the visual dis-
play of a single cuboid. For it, the axis-aligned bound-
ing box of each cuboid is projected into screen space
in order to obtain its screen-space area. If a cuboid
obtains insufficient screen space for the visual display
of its children or resides in sub-pixel space itself, at
least for one major axis, it can be scored for aggrega-
tion. This reduces visual clutter resulting from (1) leaf
nodes depicted smaller than single screen pixels and
(2) Moir
´
e and other aliasing artifacts due to under-
sampling of both the axis-aligned cuboids and their
spacing due to the inner nodes’ nested representation
with padding. Furthermore, we use a screen-space
threshold to invoke aggregation much earlier in less
important areas, which results in bigger cuboids and
facilitates meaningful labeling of context areas.
Aside from that, we experimented with an occlu-
sion score s
occ
that uses occlusion queries to score ir-
relevant nodes for aggregation, if they themselves or
their children cause lots of occlusion. However, a map
theme should typically configure the height mapping
to not cause extensive occlusion in the first place.
Since view-based scoring depends on the virtual
camera’s configuration and state, it is implicitly con-
trolled, e.g., by user navigation. We suggest to per-
form scoring immediately after a user has completed
a navigation operation and is presumably continuing
to explore the data. Continuous scoring during ongo-
ing navigation operations might cause distraction.
3.3 Interaction-based Scoring
Interaction-based scoring is used to score nodes
within areas that are in the user’s focus-of-attention
based on user interaction. It is essential to software
maps as it complements user navigation with direct
node interaction capabilities required to support the
visual information-seeking mantra: “Overview first,
zoom and filter, then details-on-demand” (Shneider-
man, 1996). To this end, we use a quasi-binary pick-
ing score s
agg
to provide explicit user control over the
aggregation state of inner nodes by means of toggling
(e.g., mouse click or touch on a node). The score, be-
ing initialized with 0, toggles to either +1 or −1 de-
pending on the scored node’s aggregation state. Per-
node interactions often occur in alternation with user
navigation (such as zoom, pan, and rotate) and need
to be processed immediately.
We further experimented with the following scores in-
dented as focus-of-attention measures:
• look-at direction of the camera (spot score s
cam
);
• cursor position (mouse-over score s
mov
);
• gaze data (gaze score s
eye
) using eye-tracking.
We found these measures, however, to appear unsta-
ble and distractive due to frequent incomprehensible
aggregation state changes, and postponed any further
investigation at the time of writing.
Furthermore, we implemented a temporal focus-
density map that enabled to capture various attention
metrics per node over time (locus-of-attention score
s
loa
). The idea is to increase or decrease the nodes fo-
cus density over time, if the minimal distance between
a cuboid and the users locus of attention resides be-
low or above a certain threshold. We intended to use
the score to hinder nodes of recent user interaction to
aggregate and thus providing coherent, recognizable
areas-of-interest and interaction. Instead, it resulted
in mostly in-comprehensive and unexpected, distract-
ing aggregation state changes: thus, we rejected this
approach for actual use at the time of writing.
4 DISPLAY OF AGGREGATES
Observing the use of software maps in industry appli-
cations provided us insights on how map themes are
typically designed and applied: a lines of code mea-
sure is almost always mapped to the nodes weight
for spatialization in order to maintain a stable, rec-
ognizable layout and consistent footprint. To utilize
preattentive processing the most relevant attribute for
a given task is usually mapped to color. Finally, the
height mapping is used for attributes that, when lo-
cally correlating to the color attribute, provides valu-
able insights. Two examples of software map themes:
Technical dept maps logic lines of code to footprint,
a nesting level metric to color, and McCabe com-
plexity (McCabe, 1976). It is used to reveal and
monitor the ’technical debts’ inherent to a soft-
ware system’s implementation.
Risk of knowledge drain maps logic lines of code
to footprint, the number of active developers (per-
node) to color, and a composite, nesting-level
or McCabe based complexity measure indicating
difficult-to-comprehend code to height. It is used
to identify complex code units known only by few
developers and reveal knowledge distribution.
In addition, non-linear attribute mapping modifiers
are sometimes used such as logarithmic scaling in
order to emphasize or account for certain aspects of
IVAPP 2017 - International Conference on Information Visualization Theory and Applications
180

the depicted data. For simplicity, we assume any
mapping modifier to be the identity function. Even
though, software maps can be used to depict qualita-
tive data, we focus on sequential and diverging data.
With respect to our working prototype three presump-
tions were confirmed. First, maintaining the same
color mapping for aggregates can hide important data.
Second, aggregate cuboids are indiscernible from leaf
cuboids. And third, abrupt aggregation state changes
might attracted the users focus of attention. In the
following subsections we discuss steps to at least par-
tially resolve these issues.
4.1 Extended Aggregation Operators
In order to diminish the loss of information caused by
aggregation (e.g., loss of underlying data distribution
and structure) we introduce additional accumulation
strategies for the attribute mapping applied to aggre-
gates. For example, instead of averaging all underly-
ing attribute values and use this average for the ag-
gregates color mapping, we might use the minimum
or maximum attribute value. To this end, we formal-
ize the aggregation in attribute space and introduce
extended aggregation operators that allow to account
for specific data characteristics, e.g., outliers, vari-
ance, weighted average, minimum, maximum, etc.
For a given inner node i we can apply a fold (higher-
order function) Ξ (i, v, o). This fold traverses the re-
cursive structure of i and builds up a single, aggre-
gated attribute value using an aggregation operation o
on the map theme’s attribute v.
A fold using an arithmetic mean operator for ag-
gregation can now be denoted as Ξ (i, v, ¯n) with ¯n as
operator that calculates the mean within a set of at-
tribute values. This mean attribute-aggregation opera-
tor, however, might be insufficient for a given task: in-
teresting attributes might cancel out each other or re-
main unnoticed because of their marginal share (e.g.,
due to a high number of children). Instead, attribute
aggregation operators might favor attributes that devi-
ate from the mean. For this purpose, we use Ξ (i, v, ¯n
A
)
and Ξ(i, v, σ
e
). The operator ¯n
A
derives the weighted
mean, i.e., each attribute value is weighted by the at-
tribute mapped to the node’s footprint. This accounts
for the node’s spatial layout favoring large node foot-
prints over small ones. For large treemaps, however,
we observed that, e.g., outliers of height or color at-
tribute primarily reside in nodes of medium to small
footprints. σ
e
is a deviation attribute-aggregation op-
erators that weights each attribute by its deviation to
the mean:
|
a − ¯n
i
|
e
with a as attribute value and e as
exponential deviation amplifier. Figure 3 illustrates
the effect of these operators on the aggregates color.
(b) (c)(a)
(e)(d)
Unaggregated Node
Color Scheme
(g) (h)(f)
Figure 3: For a unaggregated inner node and a color scheme
(left) and color mappings as the result of different attribute-
aggregation strategies (right): (a) visual average (as refer-
ence), (b) minimum, (c) maximum, aggregate operators (d)
¯n, (e) ¯n
A
, (f) σ
1
, (g) σ
2
, and (h) σ
8
.
4.2 Nesting Level Contouring
The visual display of aggregates is, without further
specialization, indiscernible to the display of leafs.
This can be resolved, by either truncating the aggre-
gate cuboids or adding a contour (by means of a lumi-
nance offset) causing resemblance to padding. Trun-
cation, however, is not applicable in 2D, increases the
visual complexity of the cuboids, and is sometimes
difficult to recognize, which makes contouring our
preferable choice. The contouring alone is already
sufficient to satisfy discriminability of aggregates to
non-aggregates.
The contouring can be used to convey additional
information about the underlying structure. More
specifically, multiple contours can hint the degree of
aggregation, i.e., the number of an aggregate’s subja-
cent hierarchy levels (nesting level). We denote this
approach as nesting level contouring and use consec-
utive luminance offsets for the nested contours (Fig-
ure 4). To avoid cluttering due to too many nested
contours for aggregates with high nesting levels, we
apply line-stippling to the inner-most contour if the
aggregate’s nesting level exceeds the level of the
inner-most contour. During exploration of datasets of
various sizes, we empirically determined that up to
three nested contours are quite useful.
(a) (b) (c)
Figure 4: f.l.t.r.: stepwise aggregation of nodes in (a). For
the aggregates in (b) and (c) nesting level contouring indi-
cates the number of underlying hierarchy levels.
Reducing Visual Complexity in Software Maps using Importance-based Aggregation of Nodes
181

4.3 Animated State Transitions
Due to the preattentive nature of motion, aggrega-
tion state changes both instantaneous or by tempo-
rary transition have to be applied with care. To sup-
port the user during the exploration, we apply brief,
animated transitions to aggregation state changes. It
allows to smoothly transform a node state from not
aggregated to aggregated and vice versa. For it, a
node-local transition timing linked to the cause of ag-
gregation was implemented. This dynamic timing en-
ables transitions ranging from explicit, noticeable/fast
to less distractive, unobtrusive/slow and can be setup
by the map theme. Transitions directly caused by user
interaction can be fast or even instant to not hinder
the user in his task; Transitions caused due to data
changes, or view-based scoring, on the other hand,
can be slower and more unobtrusive. For the anima-
tion itself we used the following animation. When
a node transitions into an aggregate, the aggregate
fades out and reveals the inner cuboid as well as all its
child nodes with their height limited to the aggregate’s
height. After the aggregate resolved, child nodes pre-
viously limited in height grow to their actual height.
We found this to be helpful when changing the aggre-
gation threshold or enabling view-based scoring.
5 EVALUATION
The presented LoD technique was evaluated in three
steps. We (1) measured the reduction of visual clutter
induced by aggregation, (2) performed a user study, to
investigate the impact of aggregation to visual search,
and (3) performed a user study to investigate the read-
ability of nesting level contouring.
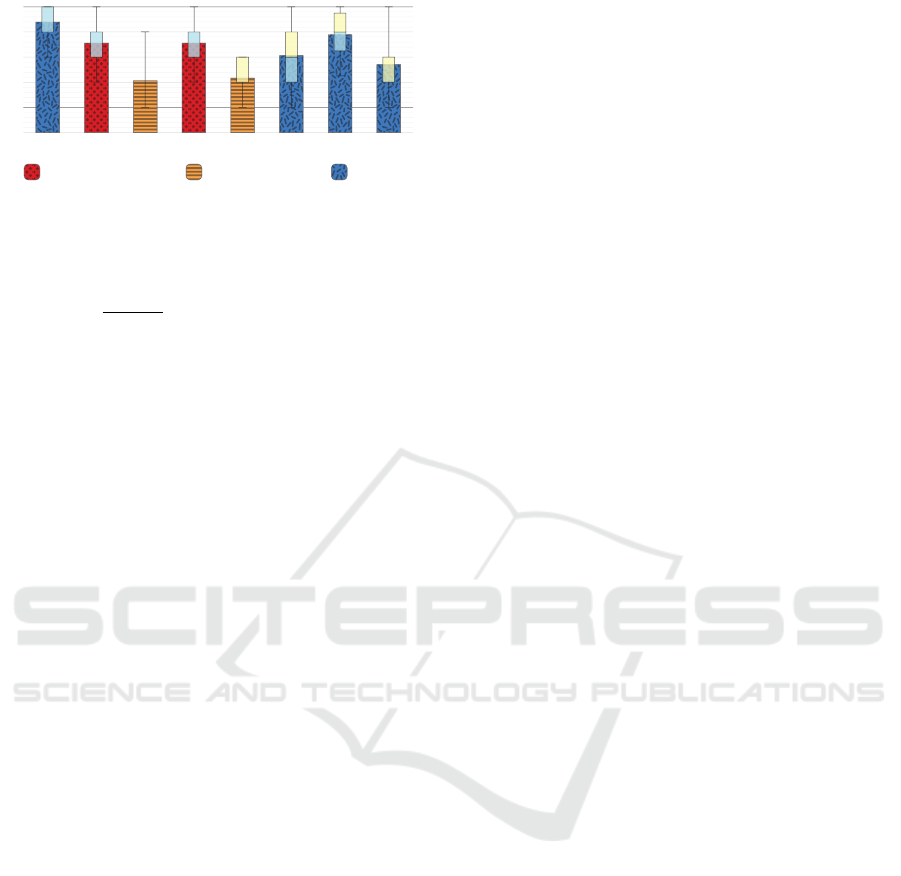
5.1 Evaluation of Visual Clutter
To confirm the actual reduction of visual clutter, we
used the feature congestion method for visual clut-
ter (Rosenholtz et al., 2005). Since it is a measure
of difficulty in searching through a complex display it
can be used as usability indicator of importance-based
aggregation. The feature congestion was computed
for each of the image pairs used in the following user
study. In average our LoD technique caused a reduc-
tion of about 50% over these image pairs (Figure 5).
5.2 Evaluation of Visual Search
User Study Design. A qualitative and quantitative
user study was performed with 18 participants (age:
18-35, 15 males, 3 females). The participants were
(a) (b)
0.0 (low) Feature Congestion Histogram (high) 1.0
0
# 5k
(a) non-aggregated (b) aggregated
Figure 5: As a measure for visual clutter, color-mapped
feature congestions for a software map is shown. The his-
tograms indicates reduced visual clutter for (b).
asked to find 10 nodes of interest in different software
maps with respect to height and color mapping. For
it, we created a set of six pairs of images, contain-
ing an non-aggregated view and a view using auto-
mated attribute-based scoring, using different camera
perspectives, and datasets. After an introduction to
software maps (especially the color and height map-
ping), the participant could complete the visual search
by selecting the nodes of interest in the static images.
We ensured that a set of images shown to a partici-
pant did not contain a pair with the same view and
dataset. The top nodes of interest (forming the ground
truth for the error rates) for each dataset were selected
by values of a normalized average function of values
mapped to height and color and a threshold of 95%.
For the quantitative analysis we measured the
task-completion time and error rate for each partic-
ipant and each task. After completing the tasks, each
participant was asked to answer questions about the
user itself and to rate (from (1) strongly disagree to (5)
strongly agree) the following eight statements with re-
spect to the study and tasks:
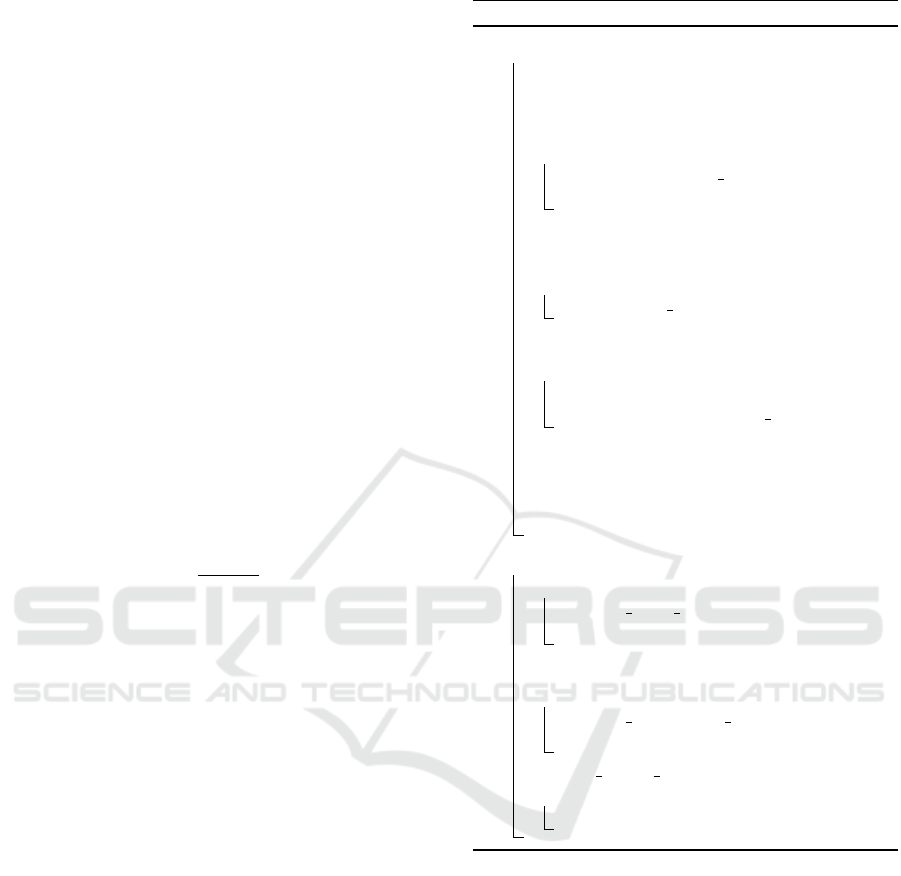
S
#
Statements with T denoting our LoD technique
S
1
I noticed the use of T.
S
2
The task was hard to complete without T.
S
3
The task was hard to complete using T.
S
4
I had problems identifying NoI
∗
without T.
S
5
I had problems identifying NoI
∗
using T.
S
6
I could easily identify aggregated nodes.
S
7
T was useful in the decision making process.
S
8
I think the use of T hides important information.
∗
node of interest
The error rate and task-completion time serves as
an indicator for the usability of the presented tech-
nique. Therefore, we state the following hypotheses
for the user study:
H
1
The use of our LoD technique (attribute-based
scoring) reduces the error rate.
IVAPP 2017 - International Conference on Information Visualization Theory and Applications
182
S
1
1
2
3
4
5
S
2
S
3
S
4
S
5
S
6
S
7
S
8
with LoD techniquewithout LoD technique usefulness
Figure 6: Results of the user study statements S
1
to S
8
rated
by the participants. The value domain is: (1) strongly dis-
agree, (2) disagree, (3) neutral, (4) agree, (5) strongly agree.
H
2
The use of our LoD technique (attribute-based
scoring) reduces the task-completion time.
User Study Results. Most users (11 of 18) stated
that they were familiar with the concept of 2D and
2.5D treemaps while only a few of them (3 of
18) stated that they were frequently working with
treemaps. The results of the statement ratings (Fig-
ure 6) show that almost every participant recognized
the use of the LoD (S
1
, µ = 4.39) and rated the tech-
nique as useful for the given task (S
7
, µ = 3.89). The
statement ratings of S
2
(µ = 3.56) and S
3
(µ = 2.06),
as well as S
4
(µ = 3.56) and S
5
(µ = 2.17), compar-
ing the difficulty estimation for the given tasks with
respect to the LoD technique, show that the technique
improves the usability of software maps for the given
task significantly (S
2
vs. S
3
p = 3e-4; S
4
vs. S
5
p = 2e-4). Besides that, the visual separation of ag-
gregated and non-aggregated nodes needs some im-
provements (S
6
, µ = 3.06). Additionally, the study
shows that both, error rates and task completion time,
are reduced significantly by using our technique. The
lower error rate (without LoD: µ = 2.52; with LoD:
µ = 0.85; p < 0.01) for the non-aggregated software
map underline the participants opinion with respect
to the statements S
2
to S
5
. Finally, the average task
completion time was reduced in our experiment from
about 38.5 seconds (without LoD) to 31.1 seconds
(with LoD), but failed closely to show a significant
effect (p = 0.057) within an independent t-test.
5.3 Evaluation of Contouring
A second user study was performed to determine if
users are able to correctly identify (readability) aggre-
gated datasets using nesting level contours. For it, an
aggregated version of a treemap was shown together
with a set of 4 valid or invalid depictions (multiple
correct answers possible). The study was performed
as an online survey with 12 participants.
User Study Design. Every participant had to an-
swer 15 questions with four different depictions
shown. This results in a number of 720 answers (=
15 questions × 12 participants × 4 possible answers).
User Study Results. The majority of answers were
correct with 504 correct answers (208 true positives,
296 true negatives). The precision of the participants
classification was about 62 % with a recall of 70%
and a small effect size (φ = −0, 165). A chi-square
test with Yates’ continuity correction showed a sig-
nificant difference between the number of correct and
incorrect answers and the participants recognition of
the correct aggregates (p < 0.001).
6 DISCUSSION
The aggregation of nodes was specifically designed
to satisfy the aggregation guidelines suggested by
Elmqvist et al. (Elmqvist and Fekete, 2010).
G1 Entity Budget. A simple entity budget is intro-
duced with the viewport size; the view-based scoring
and the used minimal screen-space area threshold im-
plicitly limit the number of cuboids. In addition, the
number of depicted nodes can be restricted for certain
hierarchy levels. Technically, our scoring could just
accumulate the number of children of the inner node
that is scored (provided a persistent node traversal)
and score for aggregation when the budget exceeded.
G2 Visual Summary. Aggregates use the same or
at least a similar attribute mapping, depending on the
used aggregation operators, thus, they always repre-
sent the underlying data. The presented nesting level
contouring further allows for assumptions about the
node’s nesting depth. However, the aggregate does
not capture the underlying data structure in terms of
data localization, quantity of nodes, or value or distri-
bution patterns of the mapped attributes.
G3 Visual Simplicity. We decided not to introduce
an additional shape nor to modify the cuboid’s geom-
etry, but instead rely on the basic cuboid for an aggre-
gation inherent to the 2.5D treemap.
G4 Discriminability. The contouring of aggregates
as well as the option to label their top faces (which
more likely provide the required additional space for a
meaningful annotation) makes our aggregate cuboids
easily discernible from inner and leaf cuboids.
Reducing Visual Complexity in Software Maps using Importance-based Aggregation of Nodes
183
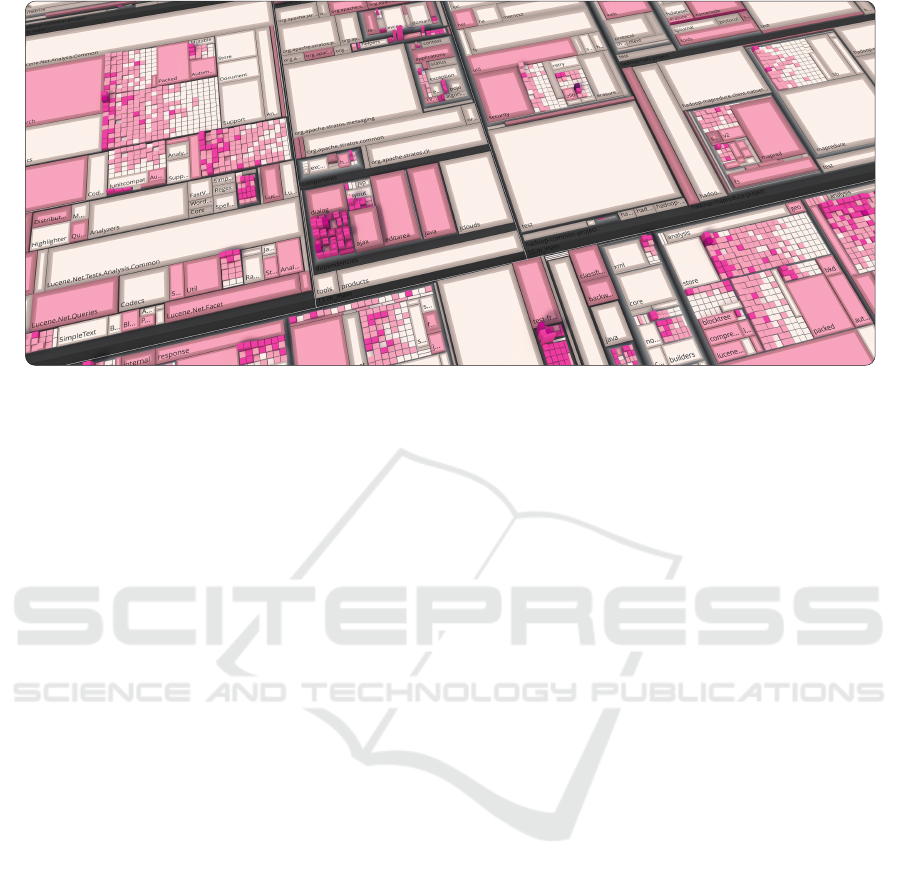
Figure 7: Software map of 50.363 nodes with importance based filtering and outlier-aware aggregation operator.
G5 Fidelity. With the presented aggregation oper-
ators the aggregates visual display and thus its con-
veyed information can be configured accordingly to
the given task and importance measure.
G6 Interpretability. For the depiction of aggre-
gated nodes the same visualization approach used for
the depiction of inner nodes and leaf nodes is used.
Except for the nesting level margin, which is orthog-
onal to the color mapping, the user is not confronted
with any inconsistencies and, as our evaluations in-
dicate, has no problems in interpreting the software
map using our LoD technique. However, even though
a user easily understands a thematic mapping, the se-
lection of aggregation operators used for aggregates
might impact the users performance and is currently
not directly communicated.
7 CONCLUSIONS
We have presented a technique for importance-based
aggregation of nodes for the visual display of multi-
dimensional, hierarchical data using 2.5D treemaps.
The technique was shown to be capable of “reduc-
ing a large dataset into one of moderate size, while
maintaining dominant characteristics of the original
dataset” (Cui et al., 2006) while satisfying common
guidelines for aggregation (Figure 7). It (1) requires
no layout re-computation, (2) allows for (mostly) un-
ambiguous and self-consistent aggregates, (3) imple-
ments well-known interaction concepts, and (4) al-
lows for additional annotation. Finally, the technique
enables multi-resolution depictions of complex infor-
mation, facilitates efficient identification of important
nodes, and thereby supports the Visual Information
Seeking Mantra (Shneiderman, 1996).
Future Work. Experimenting with various, large
datasets, we identified ares for further improvement.
First, sometimes, a software system consists of very
few inner nodes with massive number of children, ei-
ther resulting in visual clutter or useless aggregates.
For such cases, we plan to investigate in partial ag-
gregation strategies, e.g., using procedural texturing
for aggregate masking. Second, the aggregates as vi-
sual summary can be further improved by supporting
the aggregation of qualitative data as well as convey-
ing the underlying data distribution using, e.g., color
weaving (Hagh-Shenas et al., 2006) or small diagrams
rendered to the aggregate cuboids top faces. Last, we
want to explore how aggregation can be used in com-
munication and locus of attention guiding.
ACKNOWLEDGEMENTS
This work was funded by the Federal Ministry of
Education and Research (BMBF), Germany, within
the InnoProfile Transfer research group “4DnD-Vis”
(www.4dndvis.de). We also want to thank seerene
TM
for providing us insights into their visual analytics
services and access to massive datasets.
REFERENCES
Balzer, M. and Deussen, O. (2007). Level-of-detail visu-
alization of clustered graph layouts. In Proc. IEEE
APVIS, pages 133–140.
IVAPP 2017 - International Conference on Information Visualization Theory and Applications
184

Bederson, B. B., Shneiderman, B., and Wattenberg, M.
(2002). Ordered and quantum treemaps: Making ef-
fective use of 2D space to display hierarchies. ACM
Trans. Graph., 21(4):833–854.
Bertin, J. (1967). S
´
emiologie graphique. Mouton.
Bladh, T., Carr, D. A., and Scholl, J. (2004). Extending
tree-maps to three dimensions: A comparative study.
In Proc. APCHI, pages 50–59.
Blanch, R. and Lecolinet, E. (2007). Browsing zoomable
treemaps: Structure-aware multi-scale navigation
techniques. IEEE Trans. Vis. Comput. Graph.,
13(6):1248–1253.
Bohnet, J. and D
¨
ollner, J. (2011). Monitoring code quality
and development activity by software maps. In Proc.
ACM MTD, pages 9–16.
Breunig, M. M., Kriegel, H.-P., Ng, R. T., and Sander, J.
(2000). LOF: Identifying density-based local outliers.
In Proc. ACM SIGMOD, pages 93–104.
Bruls, M., Huizing, K., and van Wijk, J. (1999). Squarified
treemaps. In Proc. Eurographics/IEEE TCVG Sympo-
sium on Visualization, pages 33–42.
Chuah, M. C. (1998). Dynamic aggregation with circular
visual designs. In Proc. IEEE InfoVis, pages 35–43.
Cui, Q., Ward, M., Rundensteiner, E., and Yang, J. (2006).
Measuring data abstraction quality in multiresolution
visualizations. IEEE Trans. Vis. Comput. Graph.,
12(5):709–716.
Ellis, G. and Dix, A. (2007). A taxonomy of clutter reduc-
tion for information visualisation. IEEE Trans. Vis.
Comput. Graph., 13(6):1216–1223.
Elmqvist, N. and Fekete, J.-D. (2010). Hierarchical aggre-
gation for information visualization: Overview, tech-
niques, and design guidelines. IEEE Trans. Vis. Com-
put. Graph., 16(3):439–454.
Fekete, J.-D. and Plaisant, C. (2002). Interactive informa-
tion visualization of a million items. In Proc. IEEE
IV, pages 117–124.
Furnas, G. W. (1986). Generalized fisheye views. In Proc.
ACM CHI, pages 16–23.
Hagh-Shenas, H., Interrante, V., Healey, C., and Kim, S.
(2006). Weaving versus blending: A quantitative as-
sessment of the information carrying capacities of two
alternative methods for conveying multivariate data
with color. In Proc. ACM APGV, pages 164–164.
Hao, M., Dayal, U., Keim, D., and Schreck, T. (2007).
Multi-resolution techniques for visual exploration of
large time-series data. In Proc. EG/VGTC EA, pages
27–34.
Harper, S., Michailidou, E., and Stevens, R. (2009). Toward
a definition of visual complexity as an implicit mea-
sure of cognitive load. ACM Trans. Appl. Percept.,
6(2):10:1–10:18.
Johnson, B. and Shneiderman, B. (1991). Treemaps: A
space-filling approach to the visualization of hierar-
chical information structures. In Proc. IEEE VIS,
pages 284–291.
Johnson, B. S. (1993). Treemaps: Visualizing hierarchical
and categorical data. PhD thesis, University of Mary-
land. HCIL-94-04, UMI-94-25057.
Liu, S., Cao, N., and Lv, H. (2008). Interactive visual anal-
ysis of the nsf funding information. In Proc. IEEE
PacificVis, pages 183–190.
L
¨
u, H. and Fogarty, J. (2008). Cascaded treemaps: Ex-
amining the visibility and stability of structure in
treemaps. In Proceedings of Graphics Interface
2008, GI ’08, pages 259–266, Toronto, Ont., Canada,
Canada. Canadian Information Processing Society.
McCabe, T. J. (1976). A complexity measure. In Proc.
IEEE ICSE, pages 407–.
Misue, K., Eades, P., Lai, W., and Sugiyama, K. (1995).
Layout adjustment and the mental map. Journal of
Visual Languages & Computing, 6(2):183–210.
Mitchell, W., Shook, D., and Shah, S. L. (2004). A picture
worth a thousand control loops: An innovative way
of visualizing controller performance data. In Invited
Plenary Presentation, Control Systems.
Munzner, T., Guimbreti
`
ere, F., Tasiran, S., Zhang, L., and
Zhou, Y. (2003). TreeJuxtaposer: Scalable tree com-
parison using focus+context with guaranteed visibil-
ity. ACM Trans. Graph., 22(3):453–462.
Rosenbaum, R. and Hamann, B. (2009). Progressive pre-
sentation of large hierarchies using treemaps. In Proc.
ISVC, pages 71–80.
Rosenholtz, R., Li, Y., Mansfield, J., and Jin, Z. (2005).
Feature congestion: A measure of display clutter. In
Proc. ACM CHI, pages 761–770.
Schulz, H.-J., Hadlak, S., and Schumann, H. (2011). The
design space of implicit hierarchy visualization: A
survey. IEEE Trans. Vis. Comput. Graph., 17(4):393–
411.
Shneiderman, B. (1992). Tree visualization with treemaps:
A 2D space-filling approach. ACM Trans. Graph.,
11(1):92–99.
Shneiderman, B. (1996). The eyes have it: A task by
data type taxonomy for information visualizations. In
Proc. IEEE Symposium on Visual Languages, pages
336–343.
Tak, S. and Cockburn, A. (2013). Enhanced spatial stability
with hilbert and moore treemaps. IEEE Trans. Vis.
Comput. Graph., 19(1):141–148.
Trapp, M., Glander, T., Buchholz, H., and D
¨
ollner, J.
(2008). 3D generalization lenses for interactive fo-
cus + context visualization of virtual city models. In
Proc. IEEE IV, pages 356–361.
Vliegen, R., van Wijk, J. J., and van der Linden, E.-
J. (2006). Visualizing business data with general-
ized treemaps. IEEE Trans. Vis. Comput. Graph.,
12(5):789–796.
Wattenberg, M. (1999). Visualizing the stock market. In
Proc. ACM CHI EA, pages 188–189.
Wettel, R. and Lanza, M. (2008). CodeCity: 3d visualiza-
tion of large-scale software. In Proc. ACM ICSE Com-
panion, pages 921–922.
Reducing Visual Complexity in Software Maps using Importance-based Aggregation of Nodes
185
