
K-modes and Entropy Cluster Centers Initialization Methods
Doaa S. Ali, Ayman Ghoneim and Mohamed Saleh
Department of Operations Research and Decision Support
Faculty of Computers and Information, Cairo University
5 Dr. Ahmed Zewail Street, Orman, 12613 Giza, Egypt
Keywords: Multiobjective Data Clustering, Categorical Datasets, K-modes Clustering Algorithm, Entropy.
Abstract: Data clustering is an important unsupervised technique in data mining which aims to extract the natural
partitions in a dataset without a priori class information. Unfortunately, every clustering model is very
sensitive to the set of randomly initialized centers, since such initial clusters directly influence the formation
of final clusters. Thus, determining the initial cluster centers is an important issue in clustering models.
Previous work has shown that using multiple clustering validity indices in a multiobjective clustering model
(e.g., MODEK-Modes model) yields more accurate results than using a single validity index. In this study,
we enhance the performance of MODEK-Modes model by introducing two new initialization methods. The
two proposed methods are the K-Modes initialization method and the entropy initialization method. The two
proposed methods are tested using ten benchmark real life datasets obtained from the UCI Machine
Learning Repository. Experimental results show that the two initialization methods achieve significant
improvement in the clustering performance compared to other existing initialization methods.
1 INTRODUCTION
Data clustering extracts the natural partitions in a
dataset without a priori class information. It aims to
group the dataset observations into clusters where
observations within a cluster are more similar to
each other than observations in other clusters.
Clustering is used as a data processing technique in
many different areas, such as artificial intelligence
(e.g., Bhagat et al., 2013), medical (e.g., Rahman
and Sarma, 2013), pattern recognition (e.g., Pratima
and Nimmakant, 2008), and customer analysis (e.g.,
Alvandi et al., 2012). The most popular clustering
algorithms are K-means, K-modes, and K-medoids
algorithms. K-means algorithm is efficiently used
when processing numerical datasets, where means
serve as centers/centroids of the data clusters. In K-
means algorithm, observations are grouped into K
clusters in which an observation belongs to the
cluster with the closest mean (i.e., centroid)
(Serapião et al., 2016). When dealing with
categorical data (Bai et al., 2013; Kim and
Hyunchul, 2008), K-modes (Ammar and Lingras,
2012) and K-medoids (Mukhopadhyay and Maulik,
2007) are used instead of K-means. K-modes
algorithm uses a most frequency based method to
update modes during the clustering process. While
K-medoids algorithm selects a cluster medoid
instead of computing the mean of cluster. A medoid
is a representative observation in each cluster which
has the minimum sum of distances to other
observations in the cluster. Evolutionary
computation techniques play a vital role in
improving the performance of data clustering
because of its ability to avoid local optimal
solutions. Evolutionary computation techniques are
considered global optimization techniques, which
use selection and recombination as their primary
operators to tackle optimization problems (Kim and
Hyunchul, 2008). Data clustering models are very
sensitive to the randomly initialized centers used at
the beginning of the search process, since such
initial centers directly influence the formation of
final clusters (Khan and Ahmed, 2013).
Furthermore, these random initialized centers may
lead to premature convergence to local optimal
solutions. To address such concerns, several
initialization methods were proposed in the
literature. Redmond and Heneghan (2007) propose
to initialize cluster centers by first assigning data
points to one of the k clusters randomly, and then the
centroids of these initial clusters are taken as the
S. Ali D., Ghoneim A. and Saleh M.
K-modes and Entropy Cluster Centers Initialization Methods.
DOI: 10.5220/0006245504470454
In Proceedings of the 6th International Conference on Operations Research and Enterprise Systems (ICORES 2017), pages 447-454
ISBN: 978-989-758-218-9
Copyright
c
2017 by SCITEPRESS – Science and Technology Publications, Lda. All rights reserved
447

initial cluster centers. Jancey initialization method
(Jancey, 1966) aims to allocate each cluster center a
synthetic data object generated randomly within the
given data space. Ball and Hall’s method (Ball and
Hall, 1967) takes the center of the entire dataset as
the first cluster center, and then picks up the data
object which is at least T units away from the
existing cluster centers as the next cluster center.
Maxmin initialization method (Gonzalez, 1985;
Katsavounidis et al., 1994) randomly selects a data
object as the first cluster center, and then the data
object with the greatest minimum-distance to the
existing cluster centers is taken as the next cluster
center. This process repeats until k cluster centers
are determined. In (Cao et al., 2009), initial centers
are determined based on the most frequent values of
the attributes, and the average density values. In (Bai
et al., 2012), an initialization method based on
integrating the distance measure and the density
together was introduced. In (Ji et al., 2015), the
authors propose a cluster center initialization method
for the k-prototypes algorithms based on the
neighbor set concept.
Cluster validity indices are used to evaluate the
performance of the clustering algorithm
(Mukhopadhyay and Maulik, 2007). Some recently
studies used the cluster validity indices as objective
functions in a multiobjective framework (e.g.,
Mukhopadhyay and Maulik, 2007; Serapião et al.,
2016). Previous work introduced a multiobjective
clustering model (MODEK-Modes) based on self-
adaptive differential evolution with three cluster
validity indices, which are symmetry index,
compactness index, and silhouette index (Soliman
and Saleh, 2015). The MODEK-Modes model used
K-modes algorithm as it deals with categorical data,
and it has been implemented using randomly
initialized centers. This work aims to enhance data
clustering performance through introducing two
initialization methods which are the K-Modes (KM)
initialization method and the entropy initialization
method. These proposed initialization methods are
used in conjunction with the MODEK-Modes
Model. The two proposed methods are tested using
ten benchmark real life datasets obtained from the
UCI Machine Learning Repository. To evaluate the
performance of the proposed initialization methods,
we compared them against four initialization
methods from the literature which are the Forgy
method (Redmond and Heneghan, 2007), the density
method (Bai et al., 2012), the value-attributes (Khan
and Ahmed, 2013), and K-Prototype (Ji et al., 2015),
in addition to the results of the MODEK-Modes
Model with randomly initialized center. The time
and space complexity of our proposed methods are
analyzed, and the comparison with the other
methods confirms the effectiveness of our methods.
The rest of the paper is organized as follows. Section
2 introduces preliminary concepts needed in the
current work. Section 3 presents the KM
initialization method, while Section 4 presents the
entropy initialization method. Section 5 shows the
experimental results and analysis for the proposed
methods in comparison with other initialization
methods. Section 6 concludes the work and
discusses future work.
2 PRELIMINARY CONCEPTS
This section introduces preliminary concepts needed
in our work. We will discuss the K-modes algorithm
and the entropy concept followed by a brief
overview of the MODEK-Modes model.
2.1 K-modes Algorithm
K-modes algorithm extends the K-means algorithm
to cluster categorical data by replacing means of
clusters by modes (Bai et al., 2013; Kim and
Hyunchul, 2008). K-modes algorithm uses a simple
matching distance, or a hamming distance when
measuring distances between data observations.
Formally, a clustering problem is formulated as an
optimization problem as follows:
,
(
μ,
)
=
,
1≤≤,1≤≤
(1)
where n is the number of data points, k is the
number of data clusters, and µ
ij
is a membership of
i
th
data observation to cluster j (i.e.
takes binary
values in crisp case).
,
is the matching
distance measure between data point x
i
and data
cluster center z
j
. To understand the matching
distance measure, let x and y be two data
observations in data set D and L be the number of
attributes in a data observation. The simple matching
distance measure between x and y in D is defined as:
(
,
)
=
(
,
)
(2)
where
(
,
)
=
0
=
1ℎ
ICORES 2017 - 6th International Conference on Operations Research and Enterprise Systems
448

The center of a cluster is updated using the
following equation:
=
∈
(
)
, ∈
(3)
where
represents the new updated value of cluster
j in the
attribute, and
is the value of the data
observation r which has the most frequent value in
the
attribute for the data observations within
cluster j.
expresses all the possible values for
attribute , DOM is a domain of the attribute, and
is the total number of data observations in cluster j.
Procedure 1 illustrates the steps of the K-Modes
algorithm.
1:
Randomly initialize centers for the k clusters
2: Each data point is assigned to the cluster with the nearest
center (Eq. 2).
3:
Update the center of each cluster using (Eq. 3).
4:
Repeat steps 2 and 3 until the clusters’ centers stop
changing or other stopping criteria are met.
Procedure 1: Steps of K-Modes algorithm.
2.2 Entropy Concept
In data clustering, the entropy between each pair of
data points helps us visualize the complete dataset.
The value of entropy (a value in the range [0, 1]) is
low (close to zero) for either very close data points,
or very far data points. Here the data points can be
easily separated into clusters, thus the uncertainty is
low and the entropy is also low. On the other hand,
the entropy of high value (close to one) indicates
that the data points are separated by a distance close
to the average distances of all pairs of data points;
i.e., the maximum entropy occurs when the data
points are uniformly distributed in the feature space.
The entropy depends on the similarity measure. The
similarity measure S, in turn, is inversely
proportional to the distance; i.e., the similarity
measure has a very high value (close to one) for very
close data points - which should be located in the
same cluster, and a very low value (close to zero) for
very far data points should be located in different
clusters. As shown in Eq. 4, the entropy between a
pair of data points is defined as (Terano et al., 2000):
=−
log
−1−
log
1−
(4)
=0.5∗(
+
)
=
∑
=
(5)
In this paper, we enhanced the similarity measure
via augmenting the traditional distance-based
similarity with another term associated with the
current clustering of the two data points (Eq. 5). We
denote this novel term by the cluster-based similarity
measure. Recall that the traditional similarity
measure for categorical data is inversely
proportional to the Hamming distance; i.e., the
distance-based similarity measure between two data
points is given as
=
∑
, where i and
j be any two data points, D the number of attributes,
and
=
is 1 if
equals to
and 0
otherwise. In the paper, we define the novel cluster-
based similarity measure as follows:
= 1 if
and only if i and j lie in the same cluster; and 0
otherwise. Finally, the total entropy between all
pairs of data points is calculated by the following
equation (Terano et al., 2000):
=
(6)
2.3 MODEK-Modes Model
MODEK-Modes model is a multiobjective data
clustering model based on self-adaptive differential
evolution using three cluster validity indices (i.e.,
objective functions) (Soliman and Saleh, 2015). The
three cluster validity indices are symmetry index (to
maximize similarity within cluster), compactness
index (to maximize dissimilarity between different
clusters), and silhouette index (to test a suitability
the clustering model to the processed dataset). The
MODEK-Modes model starts with initializing a
population of random centers, then assigning data
points to the initialized centers forming clusters.
Next steps are repeated until the total number of
iterations is reached. These steps start with updating
centers of clusters, reassigning data points to
clusters, and evaluating fitness of individuals. The
next two steps apply the adapted mutation,
crossover, and evaluate the candidates for each
parent. The selection operator then creates the new
population based on fitness function.
3 K-MODES INITIALIZATION
METHOD
This proposed method uses the traditional K-modes
algorithm as an initialization method, where the
output of K-modes algorithm is considered the input
to the MODEK-Modes Model (see Figure 1). The
traditional K-modes algorithm has a single objective
function which minimizes the total distances
K-modes and Entropy Cluster Centers Initialization Methods
449

between all data observations and centers of clusters.
The traditional K-modes algorithms starts with
initializing random centers, and then assign data
points to the clusters, then update centers. The k-
modes algorithm repeats the last two steps until it
converges. These converged centers are considered
the initial population for the MODEK-Modes model.
Figure 1: The KM initialization method.
4 ENTROPY INITIALIZATION
METHOD
The proposed entropy initialization method consists
of two stages (see Figure 3). The first stage is called
an entropy stage which produces an accumulated
matrix. This accumulated matrix is the input for the
second initialization stage. The entropy stage
(Procedure 2) operates only once for each dataset
under consideration. The entropy stage takes the
dataset as an input and outputs an accumulated
matrix based on the entropy similarity measure. The
entropy stage starts with clustering the data points
based on the entropy values. We illustrate an
algorithm (inspired by (Li et al., 2004)) to utilize the
total entropy in the cluster process. Our contribution
is the enhancement of the similarity measure used in
this algorithm. The core idea of the algorithm is to
try to minimize the total entropy via randomly
swapping points between clusters. Recall that the
entropy between a pair of data points will be small if
either the proposed enhanced similarity measure is
low or high. The enhanced similarity measure has a
small value only when both the distance-based
measure and the cluster-based measure have small
values (i.e., large distance and different clusters).
The enhanced similarity measure has a large value
only when both the distance-based measure and the
cluster-based measure have large values (i.e., small
distance and same clusters). Thus swapping points
between clusters will have significant and
meaningful impacts on the total entropy. After
clustering the given data points, we need to
determine a mode of each cluster by using Eq. 3.
The distances between every data point and the k
clusters are then calculated to producing a
membership matrix (n × K). Elements of the
membership matrix will be computed by the
following equation:
,
=
,
∑
,
∀=1,..,&∀j=1,...,
k
(7)
where n is the total number of data points in the used
dataset, K is the number of data clusters,
,
is a
membership between data point i and cluster j, and
,
is the distance between data point i
and cluster j.
1. Entropy clustering procedure
• Input: (data points: X, # of classes: k)
• Output: cluster assignment;
• Begin
1. Initialization:
1.1. Put all data points into one cluster
1.2. Compute Initial Criterion E
0
(Initial total entropy)
2. Iteration: Repeat until no more changes in cluster
assignment
2.1. Randomly pick a point x from a cluster A
2.2. Randomly pick another cluster B
2.3. Put x into B
2.4. Compute the new total entropy E
2.5. If
2.5.1. Put x back into A
2.5.2. =
2.6. End
2.7. E
0
= E
2.8. Go to Step 2.1
2.9. End
3. Return the cluster assignment
• End
2. Determine a mode of each cluster using Eq. (3).
3. Measure the distances between each data point and the K clusters by
using Eq. (2).
4. Calculate membership values using Eq. (7) to form the membership
matrix (n x k), where n: number of data points and k: number of
clusters.
5. Building accumulated matrix, where
be accumulated value
between the data point i
th
and cluster
, and
=
∑
,
+
,
Output: the accumulated matrix
Procedure 2: The procedure of the entropy stage.
An accumulated matrix is produced from the
computed membership matrix in step 5 (see
Procedure 2). This accumulated matrix is the output
of the entropy stage and the start of the second
initialization stage. Figure 2 presents an example of
how to calculate the accumulated matrix.
ICORES 2017 - 6th International Conference on Operations Research and Enterprise Systems
450
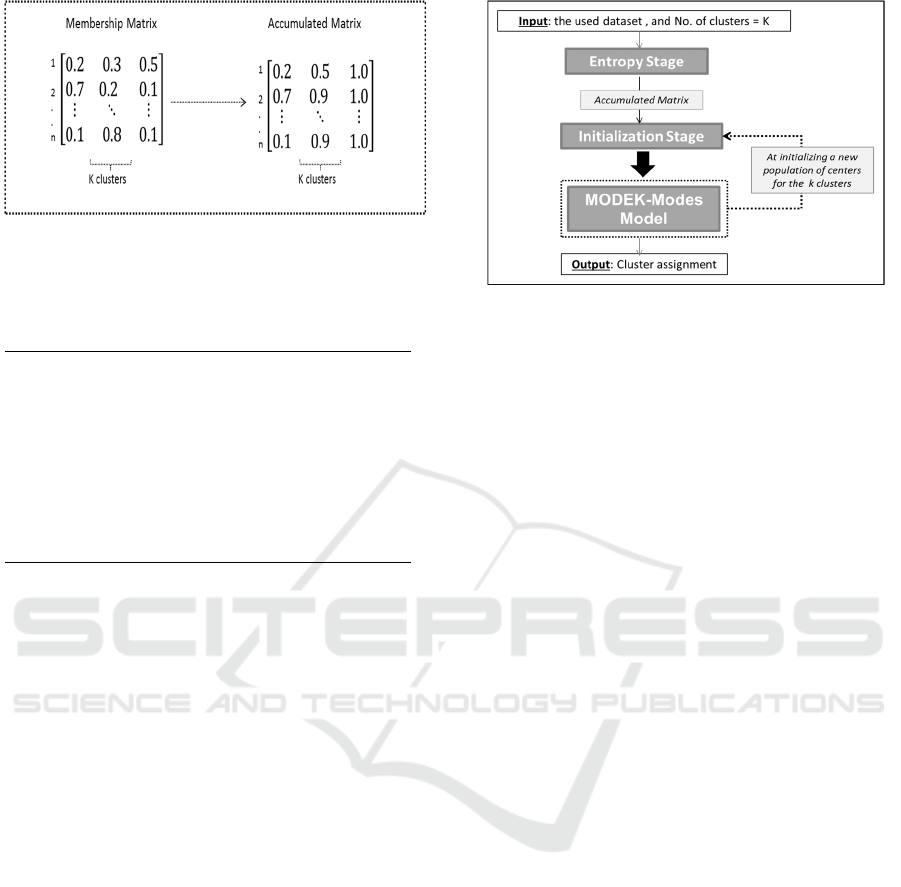
Figure 2: An example of the membership and accumulated
matrixes in the proposed entropy initialization method.
The initialization stage mainly depends on the
accumulated matrix (Procedure 3).
• For every individual in the population:
• Initialization Stage: (Input: the previous calculated
accumulated matrix)
1. For each data point, i =1,2,…,n.
Generate uniform random number U~(0, 1).
Assign data point to a cluster (upper bound of U
interval) (see the accumulated matrix).
2. End For
3. Determine the mode of each cluster (be centroid of this
cluster) for categorical data.
• Output: set of the initialized centers of the k clusters.
Procedure 3: Steps of the initialization stage.
This stage is repeated every time we need to
generate a new population of centers for the
MODEK-modes model. The initialized centers are
produced from an initial distribution to the data
points based on the accumulated matrix. Let U
1
and
U
2
be uniform random numbers for the first and the
second data points. According to the accumulated
matrix in figure 2, if U
1
= 0.7 and U
2
= 0.3, then we
have to assign the first data point to the third cluster
(0.5≤
≤1.0) and assign the second data point
to the first cluster(0.0≤
≤0.7).
This process
is repeated for every data point in the dataset.
Finally, after distributing all data points, we have to
calculate the mode of the cluster by Eq. 3. And
hence, the mode of each cluster is considered the
initial coordinates for this cluster.
5 EXPERIMENTAL RESULTS
The clustering accuracy of the MODEK-modes
model is compared when using the two proposed
initialization methods against the Forgy method
(Redmond and Heneghan, 2007), the density method
(Bai et al., 2012), the value-attributes (Khan and
Ahmed, 2013), and K-Prototype (Ji et al., 2015), in
Figure 3: Stages of the entropy initialization method.
addition to the results of the MODEK-Modes Model
with randomly initialized centers. The results of 50
independent runs are summarized in Tables 1 and 2.
For every dataset, the tables illustrate the mean of
the best solution (in 50 runs) and the standard
deviation for every initialization method. T-test was
performed with confidence level 0.05 to check if the
differences between the results are statistically
significant or non-significant compared to the
second best performing method. As shown in Table
1, the proposed KM initialization method performed
better in eight datasets and with significant change
compared to other initialization methods. Table 2
illustrates the experimental results for the proposed
entropy method, and shows that the proposed
entropy method significantly improved the
clustering accuracy for seven dataset.
Moreover, Table 3 lists the run time of the seven
clustering initialization methods on different
datasets. From this table, we can see that the KM
method needs more time than the random and the
Forgy initialization methods. However, the KM
method consumes time less than Density, Value-
attributes, and K-Prototype initialization methods.
On the other hand, the Entropy method needs more
time than other methods in comparison except for
the K-Prototype initialization method.
6 CONCLUSION AND FUTURE
WORK
In the light of the importance of data clustering, the
paper aimed to improve the performance of data
clustering through addressing and enhancing
handling the initialization step, where clustering
models start with a set of random initial clusters and
are very sensitive to such randomly initialized
K-modes and Entropy Cluster Centers Initialization Methods
451

Table 1: Mean ± standard deviation of best solution of 50 independent runs and T-test for the KM initialization method and
the other compared methods, where “No”: refers to non-significant change, and “Yes”: refers to significant change.
KM Density Random Forgy
Value-
Attributes
K-
Prototype
T-test
Soybean
0.92784921
± 0.00018
0.8928741
±0.0000221
0.8961113
±0.00038
0.885262 ±
0.0071
0.889932 ±
0.0039
0.902728 ±
0.0073
Yes
B. Cancer
0.887345 ±
0.00021
0.86689 ±
0.0027
0.8210432
±0.00666
0.872992 ±
0.0023
0.878943 ±
0.0011
0.8956345
±0.0013
No
Spect
Heart
0.8198299
± 0.0010
0.7759342
±0.0016
0.7782529
±0.0080
0.7224645
±0.0031
0.787823 ±
0.0067
0.792651±
0.044
Yes
St. Heart
0.738873 ±
0.0023
0.7493424
±0.0020
0.6778213
±0.0018
0.717923 ±
0.0081
0.754592 ±
0.0029
0.7356782
± 0.0017
Yes
Zoo
0.958879 ±
0.0031
0.9144634
±0.0017
0.9377262
±0.0024
0.931978 ±
0.0038
0.933932 ±
0.019
0.928853
±0.0014
Yes
Liver
0.8845267
± 0.00041
0.8254823
± 0.0013
0.8175647
±0.0280
0.862247 ±
0.0027
0.857934 ±
0.0026
0.845723 ±
0.0011
Yes
HServival
0.6478901
± 0.0109
0.6106859
±0.031
0.6014788
±0.0027
0.6199879
±0.0037
0. 6204733
±0.033
0.612411 ±
0.0033
Yes
Dermatology
0.797225 ±
0.0021
0.7406811
±0.0011
0.710089 ±
0.0031
0.7122794
±0.0027
0.7588932
±0.0081
0.764563 ±
0.0055
Yes
L. Cancer
0.696881 ±
0.0020
0.6279032
±0.0032
0.6015231
±0.0061
0.6682301
±0.0170
0.648932 ±
0.0073
0.658932 ±
0.0044
Yes
Computer
0.6790211
±0.0051
0.6489341
±0.0037
0.5933928
±0.0053
0.6378941
±0.0062
0.6486372
±0.0016
0.6509342
±0.023
Yes
Table 2: Mean ± standard deviation of best solution of 50 independent runs and T-test for the entropy initialization method
and the other compared methods, where “No” refers to non-significant change, and “Yes” refers to significant change.
Entropy Density Random Forgy
Value-
Attributes
K-
Prototype
T-test
Soybean
0.9148790 ±
0.0017
0.8928741
±0.0000221
0.8961113
±0.00038
0.885262 ±
0.0071
0.889932 ±
0.0039
0.902728 ±
0.0073
Yes
B. Cancer
0.8482991 ±
0.001
0.86689 ±
0.0027
0.8210432 ±
0.00666
0.872992 ±
0.0023
0.878943 ±
0.0011
0.8956345
±0.0013
Yes
Spect
Heart
0.8256281 ±
0.0011
0.7759342
±0.0016
0.7782529
±0.0080
0.7224645
±0.0031
0.787823 ±
0.0067
0.792651±
0.044
Yes
St. Heart
0.7045282 ±
0.0002
0.7493424
±0.0020
0.6778213 ±
0.0018
0.717923 ±
0.0081
0.754592 ±
0.0029
0.7356782
±0.0017
Yes
Zoo
0.957811 ±
0.0031
0.9144634
±0.0017
0.9377262 ±
0.0024
0.931978 ±
0.0038
0.933932 ±
0.019
0.928853 ±
0.0014
Yes
Liver
0.870003 ±
0.00021
0.8254823
±0.0013
0.8175647 ±
0.0280
0.862247 ±
0.0027
0.857934 ±
0.0026
0.845723 ±
0.0011
No
HServival
0.6429739
±0.0011
0.6106859
±0.031
0.6014788
±0.0027
0.6199879
±0.0037
0.6204733±
0.033
0.612411 ±
0.0033
Yes
Dermatology
0.8571158 ±
0.00211
0.7406811
±0.0011
0.710089 ±
0.0031
0.7122794
±0.0027
0.7588932 ±
0.0081
0.764563 ±
0.0055
Yes
L. Cancer
0.7287116 ±
0.0003
0.6279032
±0.0032
0.6015231
±0.0061
0.6682301
±0.0170
0.648932 ±
0.0073
0.658932 ±
0.0044
Yes
Computer
0.7963731
±0.0019
0.6489341
±0.0037
0.5933928
±0.0053
0.6378941
±0.0062
0.6486372 ±
0.0016
0.6509342
±0.023
Yes
ICORES 2017 - 6th International Conference on Operations Research and Enterprise Systems
452

Table 3: The running time of the seven clustering initialization methods on the used datasets.
Average Running Time (Mintues)
KM Entropy Density Random Forgy
Value-
Attributes
K-
Prototype
Soybean
2.90 3.11 3.07 2.42 2.37 3.03 3.33
B. Cancer
11.81 12.20 11.89 9.34 9.22 11.84 12.23
Spect Heart 4.82 5.17 4.98 4.23 4.18 4.87 5.21
St. Heart
5.33 5.64 5.37 4.83 4.79 5.32 5.68
Zoo
3.40 3.62 3.43 3.21 3.17 3.41 3.66
Liver
6.91 7.10 6.93 6.67 6.59 6.89 7.24
HServival
6.27 6.68 6.31 5.82 5.66 6.29 6.72
Dermatology
9.62 9.89 9.67 9.32 9.27 9.62 9.95
L. Cancer
3.70 3.87 3.79 3.49 3.23 3.73 3.93
Computer
5.20 5.48 5.37 4.89 4.82 5.33 5.57
centers. Previous work has shown that using
multiple clustering validity indices in a
multiobjective clustering model (e.g., MODEK-
Modes model) yields more accurate results than
using a single validity index. Thus, we proposed to
enhance the performance of MODEK-Modes model
by introducing two new initialization methods.
These two proposed methods are K-Modes
initialization method and entropy initialization
method. The two proposed methods have been tested
using ten benchmark real life datasets obtained from
the UCI Machine Learning Repository. We applied
t-test to check the significance of the results. Based
on the experimental results, the two initialization
methods achieved a significant improvement in the
clustering performance compared to the other
initialization methods. The KM method achieved a
significant improvement in the clustering
performance of 8 datasets, while the entropy method
improved the clustering performance in 7 datasets.
The time and space complexity of our proposed
methods are analyzed, and the comparison with the
other methods demonstrates the effectiveness of our
methods. For further work, the proposed two
initialization methods can be extended to deal with
the numerical datasets by replacing k-modes by the
k-means algorithm.
REFERENCES
Ammar E. Z., Lingras P., 2012, K-modes clustering using
possibilistic membership, IPMU 2012, Part III, CCIS
299, pp. 596–605.
Alvand M., Fazli S., Abdoli F. S., 2012, K-mean
clustering method for analysis customer lifetime value
with LRFM relationship model in banking
services, International Research Journal of Applied
and Basic Sciences, 3 (11): pp. 2294-2302.
Bai L., Liang J., Dang Ch., Cao F., 2012, A cluster centers
initialization method for clustering categorical data,
Expert Systems with Applications, 39, pp. 8022–8029.
Bai L., Lianga J., Dang Ch., Cao F., 2013, A novel fuzzy
clustering algorithm with between-cluster information
for categorical data, Fuzzy Sets and Systems (215), pp.
55–73.
Ball G. H., Hall D. J., 1967, A clustering technique for
summarizing multivariate data, Behavioral Science 2
(2) 153–155.
Bhagat P. M., Halgaonkar P. S., Wadhai V. M., 2013,
Review of clustering algorithm for categorical data,
International Journal of Engineering and Advanced
Technology, 3 (2).
Cao F., Liang J., Bai L., 2009, A new initialization method
for categorical data clustering, Expert Systems with
Applications, 36, pp. 10223–10228.
Cao F., Liang J., Li D., Bai L., Dang Ch., 2012, A
dissimilarity measure for the k-Modes
clustering algorithm, Knowledge-Based Systems 26,
pp. 120–127.
Gonzalez T., 1985, Clustering to minimize the maximum
intercluster distance, Theoretical Computer Science,
38 (2– 3), pp. 293–306.
Jancey R. C., 1996, Multidimensional group analysis,
Australian Journal of Botany, 14 (1), pp. 127–130.
Ji J., Pang W., Zheng Y., Wang Z., Ma Zh., Zhang L.,
2015, A novel cluster center initialization method for
the k-Prototypes algorithms using centrality and
distance, Applied Mathematics and Information
Sciences, No. 6, pp. 2933-2942.
Katsavounidis, C.-C. Kuo J., Zhang Z., 1994, A new
initialization technique for generalized Lloyd iteration,
IEEE Signal Processing Letters, 1 (10), pp. 144–146.
Khan Sh. S., Ahmed A., 2013, Cluster center initialization
algorithm for K-modes clustering, Expert Systems with
Applications, 40, pp. 7444–7456.
K-modes and Entropy Cluster Centers Initialization Methods
453

Kim K.K., Hyunchul A., 2008, A recommender system
using GA K-means clustering in an online shopping
market, Expert Systems with Applications, 34, pp.
1200–1209.
Li T., MA S., Ogihara M., 2004, Entropy-based criterion
in categorical clustering, The 21rst International
Conference on Machine Learning, Banff, Canada.
Mukhopadhyay A., Maulik U., 2007, Multiobjective
approach to categorical data clustering, IEEE Congress
on Evolutionary Computation, pp. 1296 – 1303.
Pratima D., Nimmakant N. i, 2008, Pattern recognition
algorithms for cluster identification problem, Special
Issue of International Journal of Computer Science &
Informatics, Vol. II, Issue 1 (2), pp. 2231–5292.
Rahman N., Sarma P., 2013, Analysis of treatment of
prostate cancer by using multiple techniques of data
mining, International Journal of Advanced Research
in Computer Science and Software Engineering 3 (4),
pp. 584–589.
Redmond S. J., Heneghan C., 2007, A method for
initialising the k-means clustering algorithm using kd-
trees, Pattern Recognition Letters, 28(8), pp. 965–973.
Serapião B. S., Corrêa G. S. , Gonçalves F. B. , Carvalho
V. O., 2016, Combining K-means and K-harmonic
with fish school search slgorithm for data clustering
task on graphics processing units, Applied Soft
Computing, 41, pp. 290–304.
Soliman O. S. , Saleh D. A., 2015, Multi-objective K-
modes data clustering algorithm using self-adaptive
differential evolution, International Journal of
Advanced Research in Computer Science and
Software Engineering, 5(2), pp. 57-65.
Terano T., Liu H., Chen A. L.P., 2000, Knowledge
discovery and data mining. Current Issues and New
Applications, 4th Pacific Asia Conference, PAKDD.
ICORES 2017 - 6th International Conference on Operations Research and Enterprise Systems
454
