
Segmentation Technique based on Information Redundancy
Minimization
Dmitry Murashov
Federal Research Center “Computer Science and Control” of RAS, Vavilov st. 40, 119333, Moscow, Russian Federation
d_murashov@.mail.ru
Keywords: Image Segmentation, Segmentation Quality, Redundancy Measure, Superpixel.
Abstract: In this paper, a problem of image segmentation quality is considered. The problem of segmentation quality
is viewed as selecting the best segmentation from a set of images generated by segmentation algorithm at
different parameter values. We use superpixel algorithm SLIC supplemented with the simple post-
processing procedure for generating a set of partitioned images with different number of segments. A
technique for selecting the best segmented image is proposed. We propose to use information redundancy
measure as a criterion for optimizing segmentation quality. It is shown that proposed method for
constructing the redundancy measure provides it with extremal properties. Computing experiment was
conducted using the images from the Berkeley Segmentation Dataset. The experiment confirmed that the
segmented image corresponding to a minimum of redundancy measure produces the suitable dissimilarity
when compared with the original image. The segmented image that was selected using the proposed
criterion, gives the highest similarity with the ground-truth segmentations, available in the database.
1 INTRODUCTION
The paper deals with the problem of image
segmentation quality. According to Haralik and
Shapiro (Haralik and Shapiro, 1985), segmentation
is the process of partitioning image represented as a
region
into n non-overlapping subregions
1
,
2
,...,
n
. The elements in subregions are grouped
by some feature and differ from the elements of the
adjacent areas. Formal definition of segmentation is
given in (Gonsales and Woods, 2008). Any of
segmentation algorithms has one or more
parameters. A problem of setting parameters of the
algorithm arises. Parameters should be set in order to
provide the best quality of the segmentation result.
The problem of finding parameter values is rather
difficult. In this work, we formulate the problem of
segmentation quality as follows. Suppose, for a
given input image
U
we obtain a set of
Q
segmented images
12
{ , ,..., ,..., }
Qq
VV V V
V
. It is
necessary to choose image
q
V
providing minimum
for a given performance criterion
(, )
q
M
UV
:
min
arg min ( , ) , 1, 2,...,
q
q
qMUVqQ
.
When solving different tasks of image analysis,
suitable quality criterion should be applied. This
may be a visual evaluation of an expert or any
quantitative measure. The results of segmentation
are usually compared with an image partitioned
manually and accepted as ground-truth (Arbelaez,
2011). If the segmentation operation is considered as
clustering of pixels, then the set-theoretical,
statistical, and information-theoretical measures
(Wagner, 2007) proposed to compare data clustering
results, are used. The most commonly used are: chi-
square measure; Rand Index (Rand, 1971) and its
variants; Fowlkes-Mallows measure (Fowlkes and
Mallows, 1983); mutual information and normalized
mutual information (Ana, 2003); variation of
information (Meilă, 2003, 2005). These measures
make it possible to compare different versions of
partitioning image into non-overlapping regions. In
paper (Arbelaez, 2011), the authors noted that the
standard methodology for estimating efficiency of
segmentation algorithms is not yet developed.
In paper (Frosio, 2015) another approach is
proposed. Parameters of the superpixel segmentation
algorithm (Felzenszwalb, 2004) were chosen
depending on the result of estimating similarity of
Murashov D.
Segmentation Technique based on Information Redundancy Minimization.
DOI: 10.5220/0006173005870594
In Proceedings of the 12th International Joint Conference on Computer Vision, Imaging and Computer Graphics Theory and Applications (VISIGRAPP 2017), pages 587-594
ISBN: 978-989-758-225-7
Copyright
c
2017 by SCITEPRESS – Science and Technology Publications, Lda. All rights reserved
587

segmented and original images. As a measure of
similarity the authors proposed to use weighted
uncertainty index calculated using the values of the
normalized mutual information (Witten, 2002; Ana
and Jain, 2003) between the color channels of the
input and segmented images. The authors proposed
to choose parameter value that provides the best
segmentation in terms of visual perception. The
dependence of the uncertainty index on parameter
value (and accordingly, the number of the
subregions) is approximately monotonous (see
(Frosio, 2015) and Fig.1). At the training step, the
expert estimations of the results of segmenting series
of images at different parameter values were
obtained. Next, using SVM-like classifier the areas
of under-segmentation, over-segmentation, and
optimal segmentation were formed in the space
“parameter - uncertainty index”. At image
processing step, parameter of graph-cut
segmentation algorithm is selected using an iterative
procedure. Procedure starts from the parameter
boundary values. Parameter is adjusted till the
uncertainty index reaches the region of optimal
segmentation. The drawbacks of this approach are
the subjectivity of expert assessments and the fact
that the segmentation algorithm will produce
acceptable results only for those types of images that
were involved in the training process.
In this paper, we say that the segmentation
V
of
image
U
is “good” if applied segmentation
algorithm does not produce a significant loss of
information. Information losses are estimated by
theoretical-information dissimilarity measure
between original image
U
and segmentation
V
.
“Good”segmentation contains information only on
the most important objects fixed in the original
image, and as in (Frosio, 2015), is the best in terms
of visual perception. In work (Atick, 1990), a
theoretical-information model of the human visual
system is proposed. The model is based on Barlow
hypothesis (Barlow, 1961) about minimizing data
redundancy at the early stages of signal processing
in the human visual system.
In this work, basing on principle of minimizing
data redundancy (Atick 1990), we propose to use a
measure of information redundancy as a
segmentation quality criterion. We show that a
particular method of forming information-theoretical
model of segmentation system provides the
redundancy measure with extremum. In order to
demonstrate that segmented image corresponding to
minimum of the redundancy measure is the best, i.e.,
it yields an acceptable dissimilarity with the original
image and ground-truth segmentations, we conduct
an experiment on images taken from Berkeley
Segmentation Dataset BSDS500 (Arbelaez, 2011).
2 SEGMENTATION ALGORITHM
AND POSTPROCESSING
PROCEDURE
A method for choosing the best variant of
segmentation is applied to the superpixel algorithm
SLIC (Simple Linear Iterative Clustering) (Achanta,
2012) supplemented with the post-processing
procedure. The procedure is proposed below. In the
next section a brief description of the SLIC
algorithm is given.
Figure 1: Uncertainty index W as a function of number of
segments K computed for test image taken from BSDS500
dataset.
2.1 SLIC Segmentation Algorithm
The main idea of the segmentation algorithm SLIC
(Achanta, 2012) consists in clustering pixels in
restricted areas, into which the analyzed image is
divided in a regular manner.
Each point of the image is characterized by five-
dimensional vector
123
(, , ,,)
T
p
ccc xy
, where
123
,,ccc
- are the point coordinates in the selected
color space,
,
x
y
- are the spatial coordinates of an
image pixel. The authors of the algorithm (Achanta,
2012) used CIE Lab color space.
The algorithm includes the following steps.
1. The image is divided into
K
fragments of
size
aa
, which are taken as an initial
approximation of superpixel clusters. Geometric
centres
k
C
of the fragments are selected as the
initial centres of superpixels.
2 Fragment centres are moved to the lowest
color gradient position in a
33
neighborhood.
3. The local clusters are formed in a
22aa
0
0,2
0,4
0,6
3
6
8
12
28
40
63
101
173
464
W
K
VISAPP 2017 - International Conference on Computer Vision Theory and Applications
588
neighborhood of the centers
k
C
similarly to k-
means algorithm. Distance
D
between the center
and the fragment point is computed as a combination
of Euclidean distances
c
d
and
s
d
of the color and
spatial components describing point.
222
11 2 2 3 3
()( )( ),
ji j i jic
dcccccc
(1)
22
()( )
ji j is
dxxyy,
(2)
2
22
s
c
d
Dd m
a
,
(3)
where
m
is a parameter specifying the ratio of the
contributions of the two components of the image
description in the distance value
D
;
i
and
j
are
the point numbers.
4. New cluster centers are determined and the
displacements of cluster centers are computed.
5. Steps 3 and 4 are repeated as long as the
displacements of centers between iterations will not
exceed a predetermined value.
To allocate homogeneous regions corresponding
to objects fixed in the image, it is necessary to merge
superpixels. For this purpose, a post-processing
procedure is proposed in the next section.
2.2 Post-Processing Procedure
In order to merge superpixels into homogeneous
regions corresponding to objects in the original
image, a two-step post-processing procedure is
proposed.
At the first step neighboring superpixel areas are
combined. For making a decision on merging, a
threshold decision rule is used. This rule allows
merging if the following inequality is taking place:
1
(, )
ijc
dCC
,
(4)
222
11 2 2 3 3
(, )
()( )( )
ij
ji j i j i
c
dCC
cc cc cc
,
(5)
where
(, )
ci j
dCC
is the distance between centers of
adjacent superpixels with numbers
i
and
j
in the
selected color space;
123
,,
kkk
ccc
are the coordinates
of centre
k
C
;
1
is a threshold value.
The second step is intended to merge superpixel
clusters throughout the entire image. As at the first
step, the decision rule allows merging if the
following inequality holds:
2
(, )
ijc
dCC
,
(6)
where
2
is a threshold value.
Procedure includes the following operations:
(a) scanning array of centers of superpixel image
clusters and forming a logical matrix for combining
neighboring superpixels by the rule (4, 5);
(b) merging neighboring superpixels;
(c) determining new cluster centers; (d) scanning
array of centers of superpixel image clusters and
forming a logical matrix for combining superpixels
by the rule (6); (e) merging superpixels.
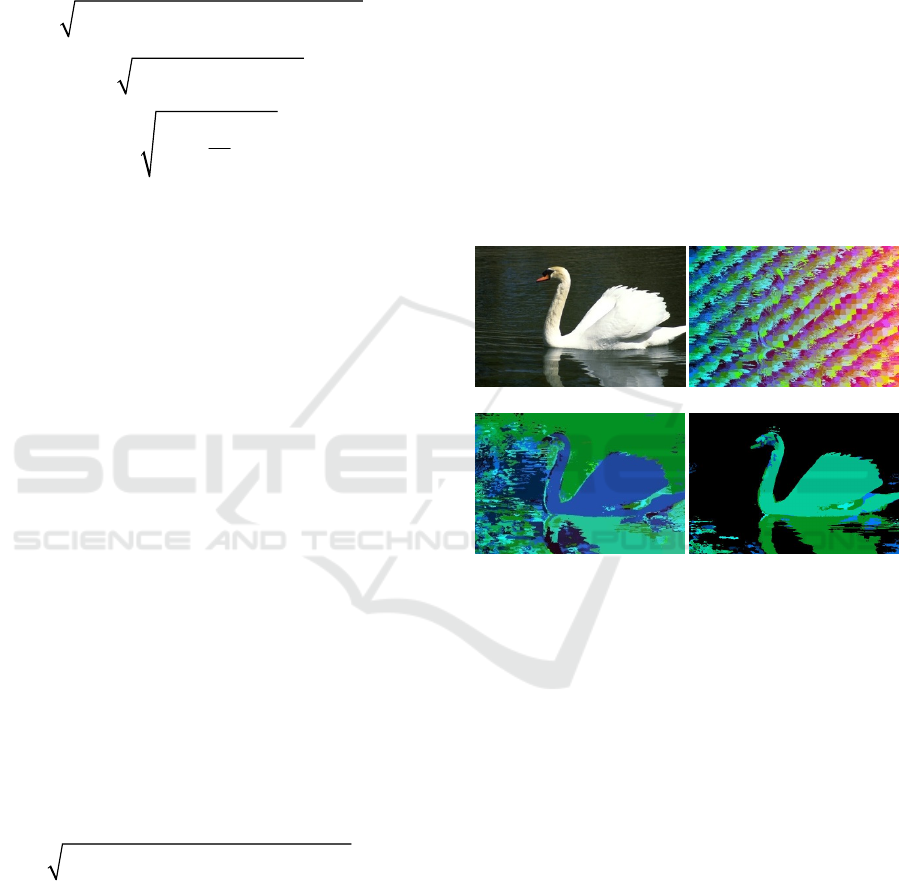
Results of segmenting an image, taken from
dataset BSDS500, is shown in Figure 2.
(a) (b)
(c) (d)
Figure 2: Results of segmenting image taken from dataset
BSDS500: (a) input image; (b) superpixels produced by
SLIC algorithm; output of the first (c) and second (d) steps
of the post-processing procedure.
The segmentation technique based on SLIC
algorithm with post-processing is controlled by four
parameters: initial superpixel size
a
; color and
spatial component ratio
m
; threshold values
1
and
2
. Segmentation result depends on the choice of
these parameters. In the next section, an
information-theoretical technique for obtaining the
best segmentation result is proposed.
3 CHOOSING THE BEST
SEGMENTATION
Parameters of the algorithm are chosen as follows.
The initial superpixel size
a
fit the size of the
Segmentation Technique based on Information Redundancy Minimization
589

smallest objects that should be outlined in image.
Parameter
m
the authors of works (Achanta, 2010;
Achanta, 2012) set equal to 2. The result of
segmentation also depends on parameters
1
and
2
of the conditions (4-6). These parameters will be
chosen using information-theoretical measures. To
apply information-theoretical approach, a
probabilistic model of relationship between the input
and the segmented images is needed. Segmentation
quality will be estimated using one of the color
channel (for example L) of images in the CIE Lab
color space.
Let the initial and segmented images be the input
and the output of a stochastic information system.
Levels of lightness in images are the continuous
random variables
U
and
V
with probability mass
functions of
()pu
and
()pv
, where
u
and
v
are
the values of
U
and
V
, respectively. Operation of
segmentation can be represented by an information
channel model:
(),VFU
(7
)
where
U
is an input signal,
V
is a channel output,
F
is a transformation function, and
is a channel
noise. We assume that noise
is Gaussian random
variable with zero mean value and variance
2
;
variables
V
and
are independent.
We propose to use a redundancy measure as a
criterion of segmentation quality. The redundancy
measure is defined as follows (Atick, 1990):
(,)
1
()
I
UV
R
CV
,
(8)
where
(;)
I
UV
is a mutual information between the
system input and output,
()CV
is a channel
capacity. We take
() ()CV HV , where ()
H
V is an
entropy of the output. Then, taking into account that
(;) () ( | )
I
UV HV HV U
, the expression (8)
takes the form:
(|)
()
HV U
R
HV
,
(9)
where
(|)
H
VU
is a conditional entropy of the
output
V
under condition that the input is equal to
U
.
We will show that the redundancy measure of the
segmentation system described by the model (7-9)
depends on number of segments and can have a
minimum.
Probability mass function of the output may be
represented by a sum
1
() ( )( )
K
kk
k
p
vPvvv
,
(10)
where
()
k
P
v
is a probability of lightness value
k
v
assigned to pixels of a segment having number
k
,
()
k
vv
is a delta-function,
K
is a number of
segments in the output image. To find analytic
dependence
()RK
, we will use a continuous version
of model (7). Taking into account expression (10),
differential entropy of the output can be written as
follows:
() ()log ()
H
Vpvpvdv
1
()log()
K
ii
i
Pv Pv
.
(11)
Let all values
i
v
be equiprobable:
() 1/
i
P
vK
.
Then it follows from (11) that
() log
H
VK
.
(12)
Next, we shall find an expression for differential
conditional entropy
(|)
H
VU
. Conditional entropy
(|)
H
VU
is a measure of information about signal
noise
measured at the system output. In this case,
we may take (Haykin, 1999):
(|) ()HV U H
.
(13)
Differential entropy of the Gaussian noise is
equal to (Haykin, 1999)
2
1
( ) log log(2 )
2
He
,
(14)
where
2
is a variance of the system noise.
We assume that the probability mass function of
the input image lightness is represented as a
Gaussian mixture model of
K
components, which
may overlap partially. The components of the
mixture correspond to the segments of the output
image
V
. Areas of component overlappings
generate noise
. The overlapping areas are formed
by pixels of
U
having the same lightness values,
but related to different segments in image
V
.
Substituting (12)-(14) into (9), we get the following
expression for redundancy measure:
2
log log(2 )
()
2log
e
RK
K
.
(15)
It follows from (15) that the redundancy measure
depends linearly on logarithm of system noise
VISAPP 2017 - International Conference on Computer Vision Theory and Applications
590

variance and inversely on logarithm of number of
produced segments
K
. Function (15) have
minimum at a point
min
K
if the noise variance
2
is close to zero at small
K
and rapidly grows when
K
increases. Computing experiments confirmed
that such behavior of the noise variance is taking
place.
Taking into account dependency of the
redundancy measure
R
on number of segments
K
,
the best segmented image should be selected in the
following way. The input image
U
is segmented
using algorithm SLIC with post-processing
procedure at different values of parameter
1
. As a
result, a set of
Q
segmented images
12
{ , , ..., }
Q
VV V
V
is obtained. Next, for input
image
U
and each of the segmented images
,1,2,...,
q
Vq Q
, the redundancy measure
R
is
computed. We choose image
q
V
providing minimum
to
R
:
min
()
q
RV R
. Image
q
V
divided into
min
K
segments fits parameter value
11min
. If it is
necessary to apply the second step of the post-
processing procedure, the output of the first step
(which is the input image at the second step) should
be redundant. It means that
1
should be chosen as
11min
. Then the proposed above technique
should be applied for finding the best value of
2
.
4 COMPUTING EXPERIMENT
In this work, in the experiments we used 25 images
from the Berkeley Segmentation Dataset BSDS500
(Arbelaez, 2011) transformed to CIE Lab color
space. The experiment includes three stages. At the
first stage, each of the test images is segmented
using algorithm SLIC and post-processing procedure
at different values of parameter
1
. Each of the
images generates a set of
Q
segmented images
12
{ , , ..., }
Q
VV V
V
. For input image
U
and each
of the segmented images
,1,2,...,
q
Vq Q
the
redundancy measure
R
is computed. To involve all
color channels, we use the weighted version of the
redundancy
R
:
(, )
() () ()
() () ()
LL aa bb
Lab
wq
UV
RH U RH U RH U
R
HU HU HU
,
(16)
where
i
R
is the redundancy measure determined in
color channel
{,,}iLab
of images
U
and
q
V
;
i
H
is the entropy of the color channel
i
of the input
image.
At the second stage, segmentation quality is
estimated. We estimate the amount of information
about the input image, which was lost in
segmentation process. For this purpose we compare
the set of
Q
segmented images with the input image
U
using normalized version of variation of
information proposed in (Meilă, 2003, 2005) for
comparing clusterings. This metric was also used in
(Arbelaez, 2011) for comparing segmented images.
Here we use the weighted index based on this
metric:
(, ) ,
() () ()
() () ()
LL aa bb
Lab
wq
VI U V
VI H U VI H U VI H U
HU HU HU
(17)
() ( ) 2(, )
(, )
,
()
iiqiq
iq
q
H
UHV IUV
VI U V
UV
H
,
(18)
where
(, )
wq
VI U V
is the weighted variation of
information;
i
VI
is the distance between color
channels
i
of images
U
and
q
V
;
i
I
is their mutual
information;
(, )
q
UVH
is the joint entropy.
At the third stage, using the weighted index (17)
based on metric (18), we compare a set of
Q
segmented images with the ground-truth
segmentations
GT
t
V
,
1, 2,...,tT
, (
T
is a number of
ground-truth segmentations for a test image
U
)
available in BSDS500 dataset.
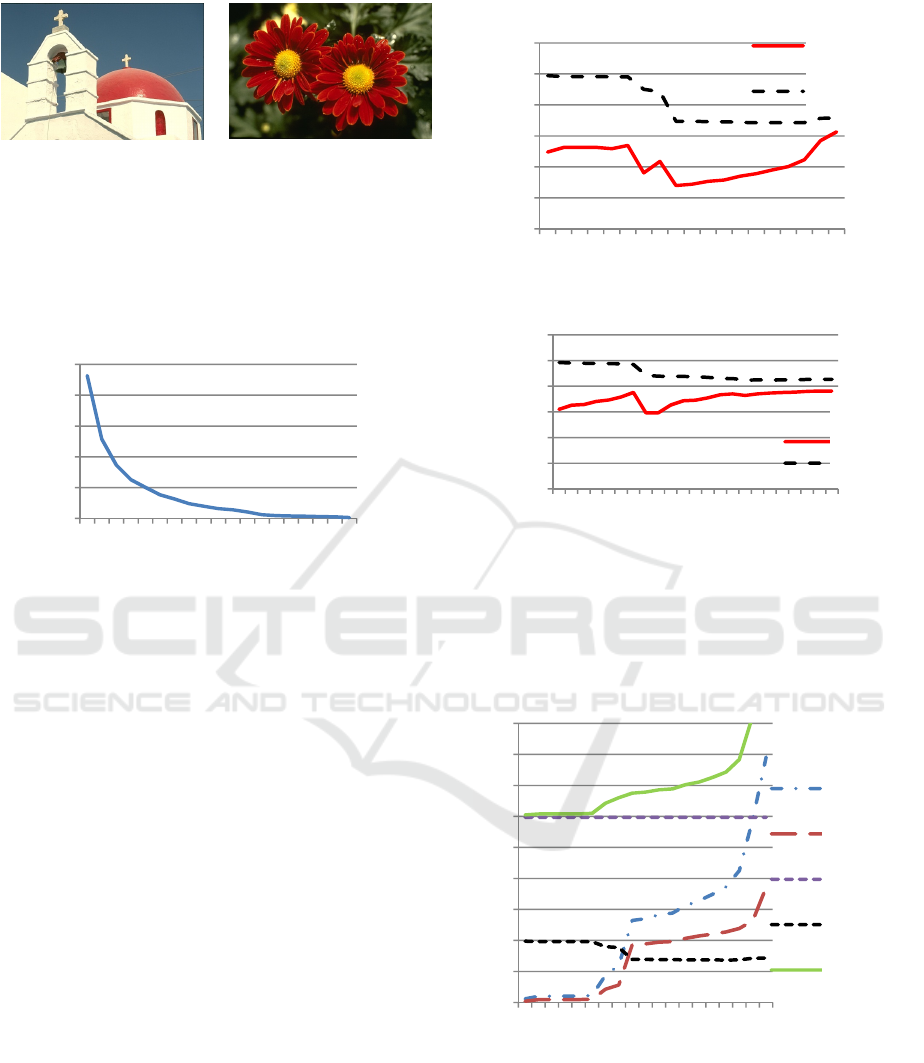
The results of the experiments are demonstrated
on the images shown in Figure 3.
At the first stage of the experiment we apply
SLIC algorithm and the first step of post-processing
procedure to all test images. For each of the test
images a set of segmented images is generated at
initial superpixel size
16a
pixels,
2m
(see
Section 3), and threshold values
1
changing in the
range
1
03.6
with increment equal to 0.2.
Segmentation Technique based on Information Redundancy Minimization
591
(a)
(b)
Figure 3: Test images taken from BSDS500 dataset.
Relationship between threshold
1
and number
of segments
K
in images
q
V
generated by one of
the test images is shown in Figure 4.
Figure 4: Relationship between threshold value
1
and
number of segments
K
.
For each test image and related set of segmented
images we computed the weighted redundancy
measure
w
R
. Dependencies of measure
w
R
on
number of segments
K
for the test images shown in
Figure 3(a,b) are depicted in Figure 5 (a) and (b).
Minima of
w
R
are reached at
28K
, and
55K
that correspond to threshold values
1
2
and
1
2.6
, respectively.
In order to estimate the distance between the
input and the segmented images, we compute
weighted normalized variation of information (17).
The curves representing
(, )
wq
VI U V
as the functions
of number of segments are shown in Figure 5(a, b)
by dashed lines. One can see that distance between
the input and segmented image decreases when
K
grows and become nearly stable at
min
K
corresponding to minimal redundancy value.
Normalized variation of information and its
components computed in the lightness image
channel are represented in Figure 6 as the functions
of number of segments.
(a)
(b)
Figure 5: Dependency of redundancy
w
R
and normalized
variation of information
w
VI
on number of segments
K
for images shown in Figure 3.
Figure 6: Normalized variation of information
(,)VI U V
in
one of the color channels and its components: marginal
entropies
()
H
U
and
()
H
V
, mutual information
(;)IUV
, and joint entropy
(,)UVH
as the functions of
K
.
At the last stage we compared sets of segmented
images with ground-truth segmentations. The result
of comparing obtained for image shown in Figure
0
100
200
300
400
500
3,6
3,2
2,8
2,4
2
1,6
1,2
0,8
0,4
0
K
1
0
0,2
0,4
0,6
0,8
1
1,2
3
6
8
12
28
40
63
101
173
464
RW
VIW(U,V)
K
R
W
,VI
W
R
W
VI
W
0
0,2
0,4
0,6
0,8
1
1,2
7
12
19
39
67
100
140
221
349
504
609
621
R…
V…
K
R
W
,VI
W
R
W
VI
W
0
0,5
1
1,5
2
2,5
3
3,5
4
4,5
3
6
8
12
28
40
63
101
173
464
H(V)
I(U;V)
H(U)
VIW(U
,V)
H(U,V)
K
H(V)
I(U;V)
H(U)
VI
W
(U,V)
H(U,V)
VISAPP 2017 - International Conference on Computer Vision Theory and Applications
592
3(b) is represented in Figure 7 as the curves
reflecting relationship between normalized variation
of information
(,)
GT
wt q
VI VV
,
1, 2,...,qQ
,
1, 2, ...,tT
, and number of segments
K
in images
q
V
. It can be seen from Figure 7 that for the
majority of the ground-truth segmentations, the
distance
(,)
GT
wt q
VI VV
is minimal when image
q
V
is
partitioned into 55 segments. This
q
V
gives
minimum to redundancy measure
w
R
. Taking into
account the fact that ground-truth segmentations
were produced manually, we can conclude that the
proposed technique allows one to obtain the best
segmentation in terms of visual perception.
Figure 7: Normalized variation of information
(,)
GT
wt q
VI VV
computed for segmented images
q
V
and
ground-truth segmentations with different number of
segments
GT
K
.
Ground-truth segmentations of images shown in
Figure 3 and segmented images fitting condition of
minimum of the redundancy measure, are depicted
in Figure 8. It can be seen from Figure 8 that the
main details of the original images are captured in
the segmented images as well as in the ground-truth
segmentations.
To show the efficiency of the proposed
technique, we introduce the following relative
difference:
min min
max
GT
KK
K
K
,
(19)
where
min
K
is a number of segments corresponding
to
min
R
;
min
GT
K
is a number of segments in image
q
V
,
which corresponds to the minimum of distance
(,)
GT
wt q
VI VV
;
max
K
is the highest possible number
of segments in images
q
V
obtained from input
image
U
.
(a) (b)
(c) (d)
Figure 8: Segmented and ground-truth images:
(a) segmented image from Figure 3(a),
28K
;
(b) ground-truth segmentation,
12K ; (c) segmented
image from Figure 3(b),
55K
; (d) ground-truth
segmentation,
9K
.
For example, for image shown in Figure 3 (b)
min
55K
,
max
621K
, and
min
181
GT
K
for the
ground-truth segmentation with number of segments
49
GT
K
;
min
55
GT
K
for other ground-truth
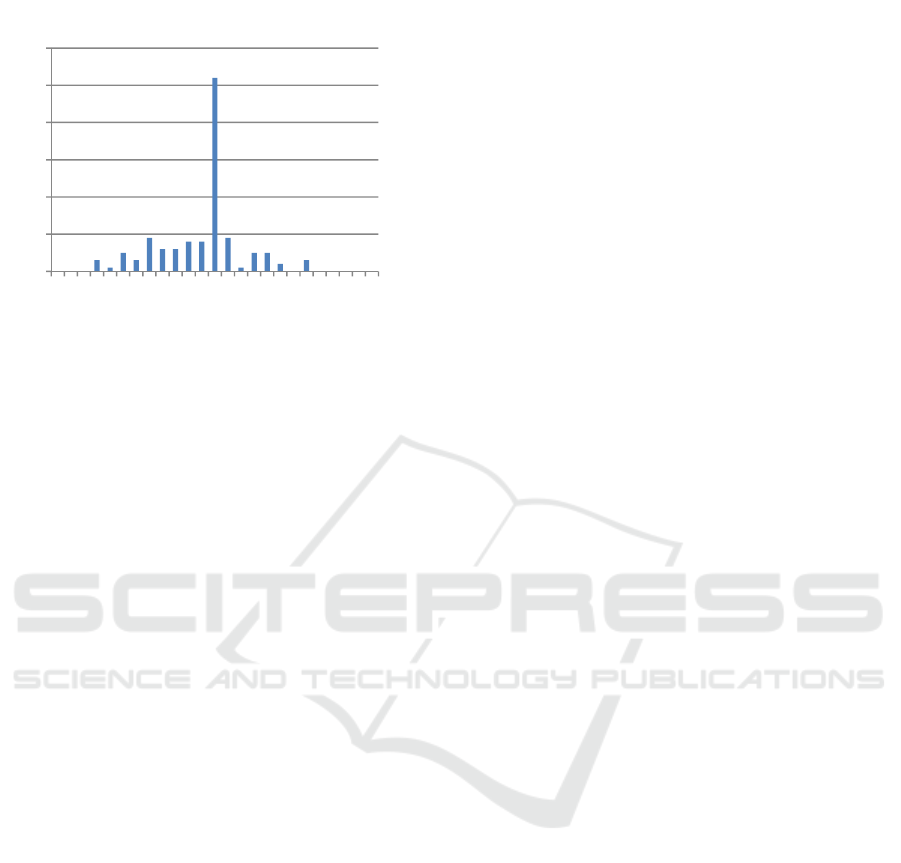
segmentations (see Figure 7). Histogram of
K
values computed for 25 test images and 125 ground-
truth segmentations (5 ground-truth segmentations
per each of the test images) is depicted in Figure 9.
Figure 9 shows that there exists a sufficiently large
group of test images such that magnitude of
K
is
rather small. The ground-truth segmentations of
these images are close enough in the sense of
measure (17-18) to segmentations, which minimize
redundancy of information
w
R
.
5 CONCLUSIONS
In this work, the problem of image segmentation
quality was considered. The problem of
segmentation quality was studied as a task of
selecting the best segmentation from a set of images
generated by segmentation algorithm at different
0
0,2
0,4
0,6
0,8
1
1,2
7
12
19
39
67
100
140
221
349
504
609
621
VIN_K5
VIN_K49
VIN_K9
VIN_K11
VIN_K46
K
VI
W
,K
GT
=5
VI
W
,K
GT
=49
VI
W
,K
GT
=9
VI
W
,K
GT
=11
VI
W
,K
GT
=46
Segmentation Technique based on Information Redundancy Minimization
593
parameter values.
Figure 9: Histogram of K values computed for 25 test
images and 125 ground-truth segmentations; ν is a
frequency of occurrence of particular
K value.
A technique based on theoretical-information
criterion was proposed for selecting the best
segmented image. We proposed to use information
redundancy measure as a performance criterion. It
was shown that the proposed way of constructing the
redundancy measure provides the performance
criterion with extremum. Computing experiment
was conducted using 25 images from the Berkeley
Segmentation Dataset. The experiment confirmed
that the segmented image corresponding to a
minimum of redundancy measure, produced the
suitable information dissimilarity when compared
with the original image. The segmented image,
which was selected using the proposed criteria, gives
the minimal distance from the majority of ground-
truth segmentations available in BSDS500 database.
We used SLIC segmentation algorithm
supplemented with the post-processing procedure for
generating sets of partitioned images with different
number of segments. The proposed technique of
optimizing segmentation quality can be combined
with other segmentation algorithms.
The future research will be aimed at the
improving segmentation noise model and estimating
the boundaries of application domain.
ACKNOWLEDGEMENTS
The research was supported in part by the Russian
Foundation for Basic Research (grants No 15-07-
09324 and No 15-07-07516).
REFERENCES
Haralick, R., Shapiro, L., 1985. Image Segmentation
Techniques. Computer Vision, Graphics, and Image
Processing, 29(1), 100-132.
Gonzalez, R., Woods, R., 2008. Digital Image Processing.
Third Edition. Pearson Prentice Hall.
Arbelaez, P., Maire, M., Fowlkes, C., and Malik, J., 2011.
Contour Detection and Hierarchical Image
Segmentation. IEEE TPAMI, 33(5), 898-916.
Wagner, S., Wagner, D. 2007. Comparing Clusterings -
An Overview. Technical Report No 2006-04,
Universität Karlsruhe (TH).
Rand, W., 1971. Objective Criteria for the Evaluation of
Clustering Methods. Journal of the American
Statistical Association, 66(336), 846-850.
Fowlkes, E., Mallows, C., 1983. A Method for Comparing
Two Hierarchical Clusterings. Journal of the
American Statistical Association, 78(383),
553. doi:10.2307/2288117.
Witten, I., Eibe, F. 2002. Data Mining: Practical Machine
Learning Tools and Techniques, Elsevier.
Ana, L., Jain, A., 2003. Robust data clustering. In: Proc.
CVPR 2003. IEEE, 2, 128 – 133.
Meilă, M., 2003. Comparing Clusterings by the Variation
of Information. Learning Theory and Kernel
Machines. LNCS, Springer, 2777, 173-187.
Meilă, M., 2005. Comparing Clusterings: An axiomatic
view. In: Proceedings of the 22nd International
Conference on Machine Learning (ICML 2005).
Frosio, I., Ratner, E., 2015. Adaptive Segmentation Based
on a Learned Quality Metric. In: Proc. VISAPP 2015,
SCITEPRESS, 1, 283-291.
Felzenszwalb, P., Huttenlocher, D., 2004. Efficient Graph-
Based Image Segmentation. International Journal of
Computer Vision, 59(2), 167–181.
Atick, J., Norman, A., 1990. Towards a theory of early
visual processing. Neural Computation archive, 2(3),
308–320.
Barlow, H., 1961. Possible Principles Underlying the
Transformations of Sensory Messages. In: Rosenblith,
W.A. (ed) Sensory Communication. Cambridge: M.I.T.
Press.
Haykin S. 1999. Neural Networks: A Comprehensive
Foundation. 2nd ed. Upper Saddle River, NJ, USA:
Prentice Hall Inc.
Achanta, R., Shaji, A., Smith, K., Lucchi, A., Fua, P.,
Susstrunk, S., 2010. SLIC Superpixels. Technical
report, EPFL, Lausanne.
Achanta, R., Shaji, A., Smith, K., Lucchi, A., Fua, P.,
Susstrunk, S., 2012. SLIC Superpixels Compared to
State-of-the-Art Superpixel Methods. IEEE
Transactions on Pattern Analysis and Machine
Intelligence, 34(11), 2274-2282.
0
10
20
30
40
50
60
‐0,6
‐0,5
‐0,4
‐0,3
‐0,2
‐0,1
0,0
0,1
0,2
0,3
0,4
0,5
0,6
K
VISAPP 2017 - International Conference on Computer Vision Theory and Applications
594
