
Segmenting High-quality Digital Images of Stomata using the Wavelet
Spot Detection and the Watershed Transform
Kau
ˆ
e T. N. Duarte, Marco A. G. de Carvalho and Paulo S. Martins
University of Campinas (UNICAMP), School of Technology, R. Paschoal Marmo, 1888, 13484 Limeira, Brazil
kaue.unicamp2011@gmail.com, {magic, paulo}@ft.unicamp.br
Keywords:
Stomata, Wavelets, Automatic Counting, Watershed, Image Processing, Image Segmentation.
Abstract:
Stomata are cells mostly found in plant leaves, stems and other organs. They are responsible for controlling the
gas exchange process, i.e. the plant absorbs air and water vapor is released through transpiration. Therefore,
stomata characteristics such as size and shape are important parameters to be taken into account. In this paper,
we present a method (aiming at improved efficiency) to detect and count stomata based on the analysis of
the multi-scale properties of the Wavelet, including a spot detection task working in the CIELab colorspace.
We also segmented stomata images using the Watershed Transform, assigning each spot initially detected as a
marker. Experiments with real and high-quality images were conducted and divided in two phases. In the first,
the results were compared to both manual enumeration and another recent method existing in the literature,
considering the same dataset. In the second, the segmented results were compared to a gold standard provided
by a specialist using the F-Measure. The experimental results demonstrate that the proposed method results in
better effectiveness for both stomata detection and segmentation.
1 INTRODUCTION
A stoma (also stomate; plural stomata) is a single
pore in the epidermis of leaves and other organs in
plants that is used to control gas exchange. The size
of its opening is regulated by two surrounding guard
cells (Willmer and Fricker, 1996). The word stomata
means mouth in Greek, due to the fact that it is re-
sponsible for the interaction between the internal and
external plant environment, and it provides the car-
bon dioxide and oxygen used in the photosynthesis
and respiration. Given that each type of plant has cor-
respondingly a characteristic type of stomata with its
own unique size, density and distribution, the detec-
tion and analysis of stomata poses a challenge.
Recently, the digital image processing of stomata
has received significant attention from researchers in
the academia, thus supporting the identification of the
level of environmental stress suffered by plants (Laga
et al., 2014)(Jian et al., 2011)(Oliveira et al., 2014).
For example, the work by (Vialet-Chabrand and Bren-
del, 2014) addresses the evaluation of stomata density
and the authors opt for processing groups of stomata
instead of individual ones. In essence, there are sev-
eral methods that aim at quantifying as well as seg-
menting the stomata present in plant epidermis.
The human visual perception of the context that
we are part of is different from how the computational
processes interpret the same type of information. Hu-
man beings possess the innate capability of identify-
ing patterns. It is not so straightforward to transfer
this capacity to the computational context. However,
a simple conversion of the color space to CIELab,
as described by Connolly and Fliess (Connolly and
Fleiss, 1997), allows the computer to simulate human
vision.
Spots are important features within an image con-
text. They usually correspond to bright small objects
such as cells that stand out locally in their neighbor-
hood. The application of computational processes to
automatically count and segment spots and cells (i.e.
stomata in our case) is not a trivial task and it clearly
offers the domain experts and field practitioners the
needed support to the identification of anomalies.
By not employing automatic routines for processing
stomata (e.g. counting, segmentation, estimation of
density), one must rely on manual procedures which
are not always viable due to the amount of time taken
(Stepka, 2013). There has been considerable work in
the past years dedicated to counting cells on digital bi-
ological images (Stepka, 2013; Oliveira et al., 2014;
Olivo-Marin, 2002; Lojk et al., 2014; Mallat, 1989;
Venkatalakshmi and Thilagavathi, 2013). However,
the issue of stomata detection still remains largely an
540
Duarte K., Carvalho M. and Martins P.
Segmenting High-quality Digital Images of Stomata using the Wavelet Spot Detection and the Watershed Transform.
DOI: 10.5220/0006168105400547
In Proceedings of the 12th International Joint Conference on Computer Vision, Imaging and Computer Graphics Theory and Applications (VISIGRAPP 2017), pages 540-547
ISBN: 978-989-758-225-7
Copyright
c
2017 by SCITEPRESS – Science and Technology Publications, Lda. All rights reserved
open gap in the literature.
The goal of this paper is to present a technique
to count and segment stomata based on the Wavelet
Spot Detection and the Watershed Transform. Be-
sides, we also intend to increase the accuracy of the
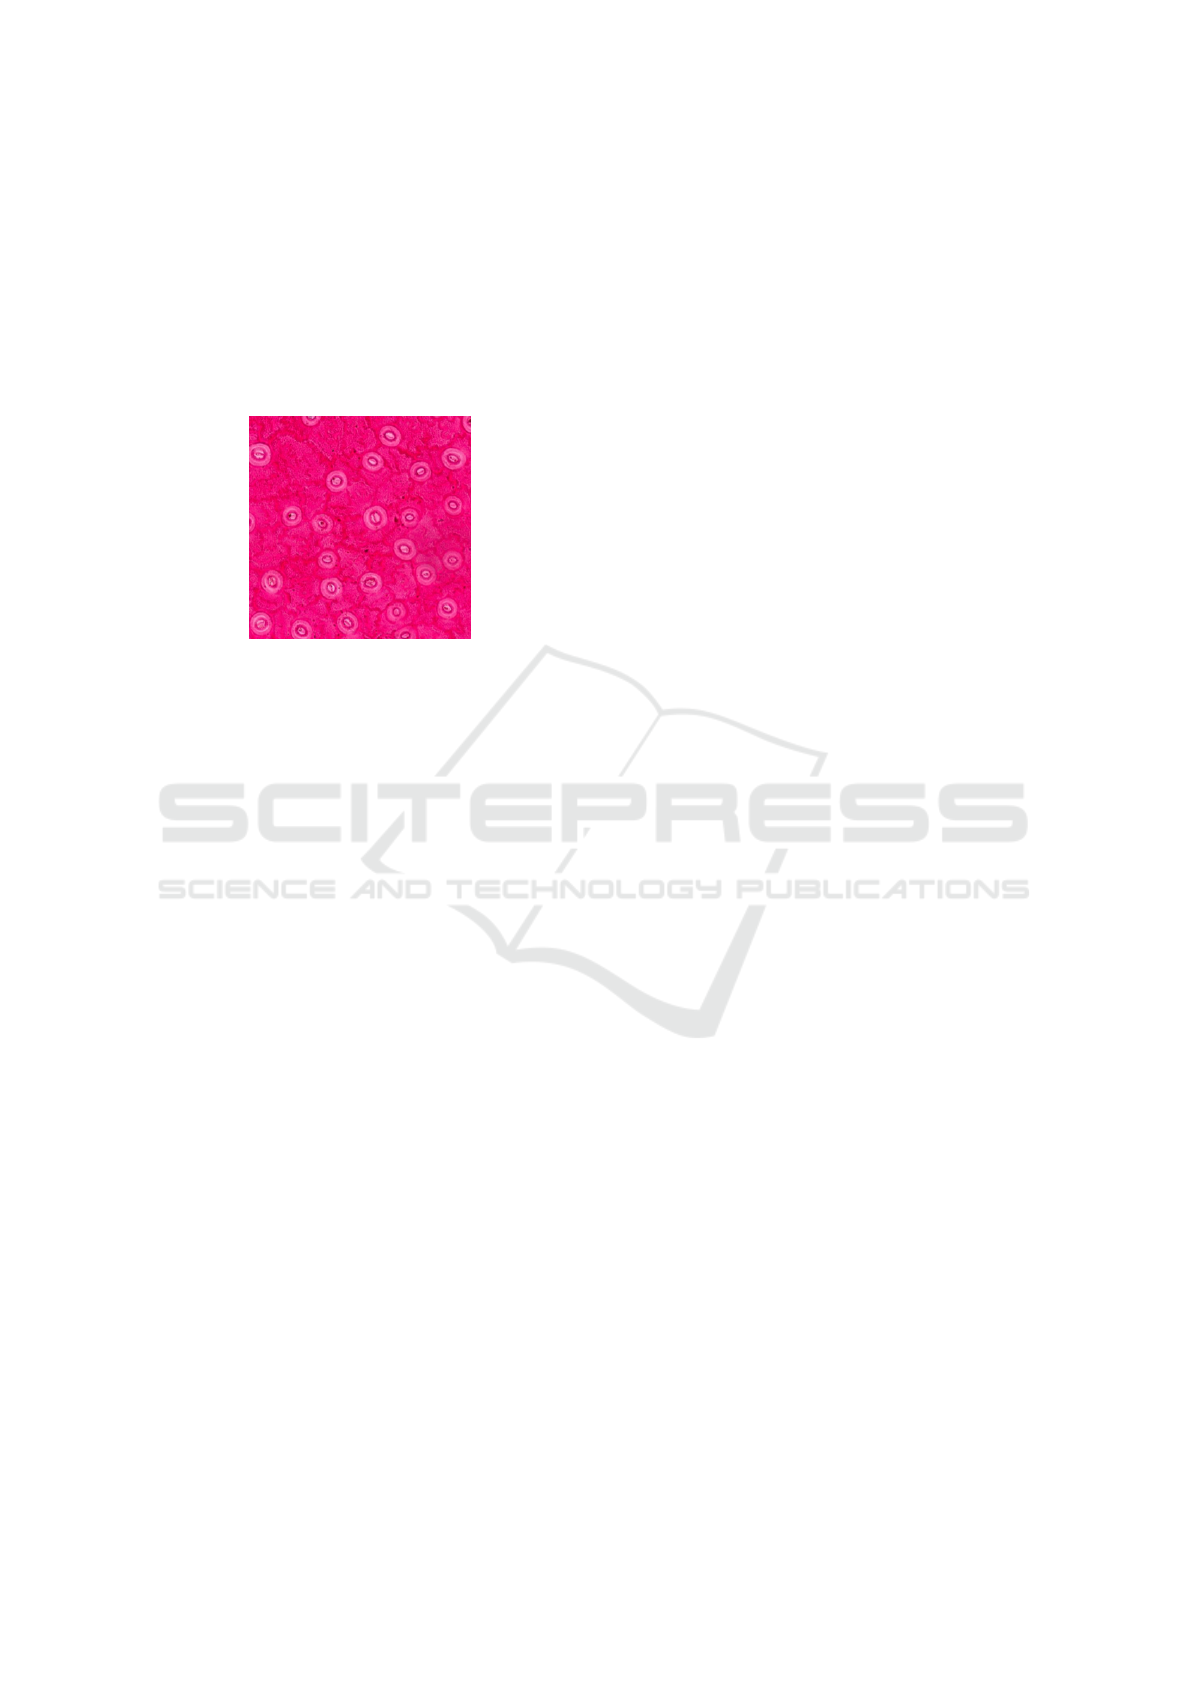
techniques that perform this task. Figure 1 illustrates
a high-resolution microscope image (through a com-
bined set of lens) of a Ugni Molinae species, with 40x
magnification.
Figure 1: Stomata from Ugni Molinae Species.
The remainder of this paper is organized as fol-
lows: In Section 2 we review previous work. The pro-
posed approach is described in Section 3. In Section
4 the results are presented and discussed. We summa-
rize and present our conclusions in Section 5.
2 RELATED WORK
Counting cells plays a key role in stomata analysis,
and it may include tasks such as segmentation and
classification. Within this context, Venkatalakshmi
and Thilagavathi (Venkatalakshmi and Thilagavathi,
2013) introduced a method to automatically count
red cells (Red Blood Cell Count - RBC), which is
used as a means to diagnose health issues in patients.
The following steps were defined: 1) Preprocessing,
which converts the color space to HSV, and then only
uses the S component; 2) Segmentation based on the
thresholding of the histogram and on mathematical
morphology operators; 3) Combination of the mor-
phological operators, logic and the Hough transform
technique to extract the RBC from other cells and
from the background; 4) Quantification of the RBC
in the image and 5) Definition of the interface for the
physician’s analysis. The results obtained were com-
pared to manual detection and sent to a doctor for pa-
tient analysis.
A general automated approach for detecting and
segmenting blood cells of different species was pro-
posed by Karel (Stepka, 2013). His approach can
also be directly used in chamber grids. The proposed
method comprises of four main steps: 1) preprocess-
ing, consisting of gray level transformation and noise
removal by use of Gaussian filtering; 2) use of Hough
Transform in order to identify linear structures; 3)
finding cell samples; 4) matching between the cell
samples and the other cells present in the image by
means of correlation. The author provided experi-
mental results that showed good performance in com-
parison to manual counting.
The method proposed by Oliveira (Oliveira et al.,
2014) is used to detect stomata using mathemati-
cal morphology. The images used by the authors
are from five types of plants. The method consists
of the following steps: 1) application of the Gaus-
sian filter; 2) application of the morphology opera-
tors opening-by-reconstruction and opening-closing-
by-reconstructions; 3) use the regional minima and
4) elimination of segments that exceed a threshold
perimeter value. The results show an average preci-
sion around 94%.
Olivo-Marin proposed a new method to detect lu-
minous (bright) points in fluorescent images from
biological immunomicroscopy experiments (Olivo-
Marin, 2002). The method provides a count of the
number of points using the Undecimated Wavelet
Transform and Spot Detection. The approach used
is to decompose the Wavelet and define, in all levels,
the combination of standards, better identifying the
spots across different resolutions. The advantage of
the method is the satisfactory identification of spots,
besides the fact that it may be applied to several types
of images.
Lojk (Lojk et al., 2014) proposed a method for au-
tomatic and semi-automatic counting in images from
fluorescent microscopy. It consists of the following
steps: 1) increase of the contrast with the Contrast
Limited Adaptive Histogram Equalization algorithm;
2) application of the Otsu Threshold to convert the im-
age to binary format; 3) image segmentation using the
Watershed Transform algorithm (allowing cell over-
lapping), and 4) blob detection. The accuracy of the
method was estimated as above 91% in comparison to
manual procedures.
Jian (Jian et al., 2011) proposed a remote sens-
ing processing technology using classification. Their
goal was to estimate the stomata density of Populus
euphratica leaves. Their method was defined as fol-
lows: 1) Each image is acquired and preprocessing is
applied in order to improve visualization. Three spec-
imens are collected from distinct parts of the leaf; 2)
Each image is classified using an object-oriented pro-
cedure and parameters such as shape, scale and com-
pactness are manually defined; 3) The results are im-
ported into ArcGIS in order to calculate the grid num-
Segmenting High-quality Digital Images of Stomata using the Wavelet Spot Detection and the Watershed Transform
541

ber for each stomata in all images; 4) The root mean
square error is calculated resulting in an accuracy of
98% (of tested samples) in relation to the manual pro-
cedure.
Laga (Laga et al., 2014) proposed an supervised
approach to stomata detection that measures both
their morphologic and structural features. They de-
fined the stomata aperture width as well as guard
cell length and width. These parameters are impor-
tant since they allow a better understanding of water
loss associated with the opening and closing of guard
cells. The goal was to count the number of stomata
and measure their morphological features. The re-
sults were obtained from 24 images and were very
close to the manual counting. The approach was de-
fined as follows: 1) Image acquisition: It was consid-
ered a flag leaf of a wheat plant captured by a “Le-
ica AS LMD” laser dissection microscope; 2) Stom-
ata cell detection, which is based on template fitting.
The templates are stored in a database and are distin-
guished by shape, size and orientation. In this step,
the image is preprocessed in order to convert it into
a representation that enhances its initial conditions,
and thus facilitates stomata detection; 3) Measure-
ment of stomata features: Once the stomata regions
have been identified, the method proceeds by mea-
suring the length and width of the stomata aperture
and its related guard cells., and 4) Detection refine-
ment: Stomata detection may result in a number of
false positives. Because of that, constraints on stom-
ata morphology were used to discard them.
Our work differs from previous works by the fol-
lowing features: 1) Stomata counting: we use the
wavelet transform and spot detection (Olivo-Marin,
2002) in order to detect and count stomata in digi-
tal images; previous work use different approaches;
2) Spot detection: compared to (Olivo-Marin, 2002),
we adapted the wavelet spot detection to work with
the detection of dark points instead of bright spots;
3) High-quality images: the set of images adopted in
our work were acquired from a high-resolution mi-
croscope; 4) CIELab colorspace: the use of this col-
orspace improves the efficiency of the method, since
the a* channel provides better information about the
stomata cells, and 5) Watershed Transform: the seg-
mentation process was used to improve the identifica-
tion of stomata, enabling various future calculations
such as stomata area and density.
3 PROPOSED APPROACH
In this section we present the proposed method to de-
tect and segment stomata images. The process con-
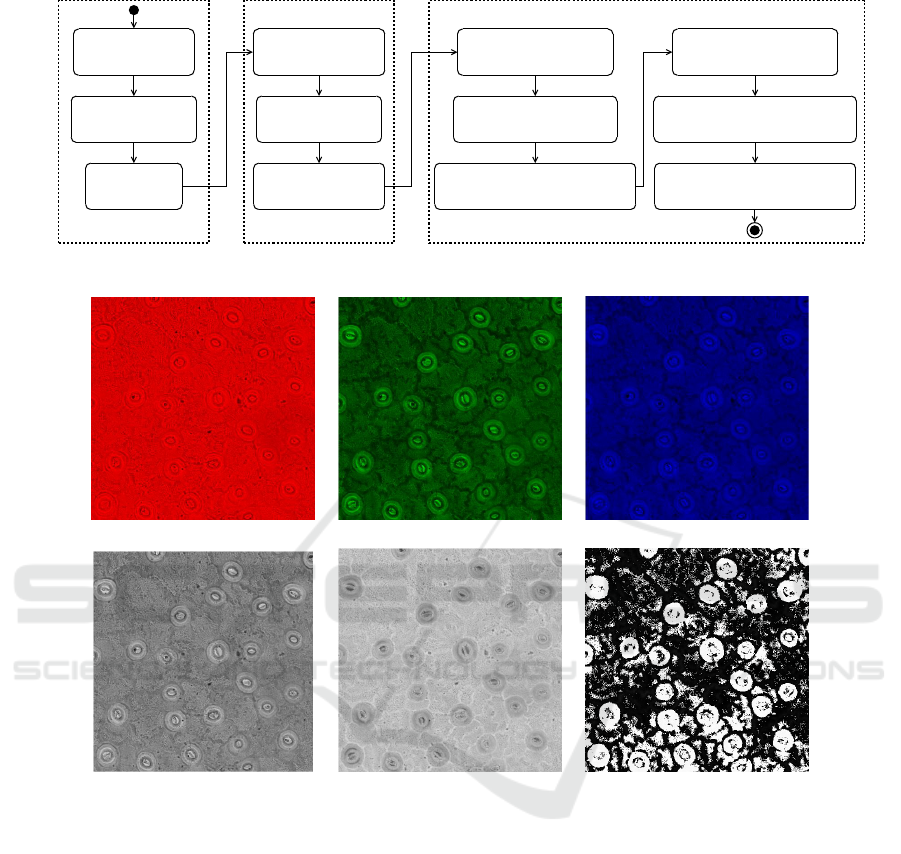
sists of three steps: 1) acquisition and extraction; 2)
cell detection, and 3) image segmentation. Each step
is labeled accordingly in Figure 2 and discussed in
turn in the following paragraphs.
3.1 Acquisition and Extraction
A total of 64 images were acquired by a high-
precision Hamamatsu Nanozoomer XR microscope
(Hamamatsu, 2016) and used in our process. Each
image has between 20 and 30 GB and 135168 x 78848
pixels. The initial task was to crop the original image
and to analyze each crop individually.
Each image is composed of three channels, i.e. R
(red), G(green) and B(blue) (Figure 3,a-c). However,
obtaining relevant information through these channels
alone is not trivial. Therefore, the conversion of color
space from RGB to CIELab is required. Each L*a*b*
channel has a distinct meaning: L* represents light-
ness (0 for black and 100 for white) and a* and b*
are chromatic values. This process is carried out in
two phases (Connolly and Fleiss, 1997): 1) conver-
sion from RGB to XYZ, and 2) conversion from XYZ
to CIELab. The trichromatic space was calculated as
follows:
X = R ∗ 0.4303 + G ∗ 0.3416 +B ∗0.1784 (1)
Y = R ∗0.2219 +G ∗ 0.7068 + B ∗ 0.0713 (2)
Z = R ∗ 0.0202 + G ∗ 0.1296 +B ∗0.9393 (3)
The values of L*a*b* were calculated as follows:
L
∗
= 116 f
Y
Y
0
− 16 (4)
a
∗
= 500
f
X
X
0
− f
Y
Y
0
(5)
b
∗
= 200
f
Y
Y
0
− f
Z
Z
0
(6)
where: X
0
, Y
0
and Z
0
are the trichromatic values for
lightness, which is D50 (see Figure 3 - bottom half,
as an example of separate channels L*a*b*).
Through the analysis of each channel indepen-
dently, we may decide which channel to use in the
detection and counting of stomata, i.e. the proposed
analysis elicits which channel may allow a better vis-
ibility of stomata. In the bottom half of Figure 3 we
may clearly identify the center of stomata, which is
emphasized in black. Therefore, this is the channel
that is used throughout the process.
3.2 Cell Detection
Having extracted the second channel in the CIELab
color space, we move on to determine the number of
VISAPP 2017 - International Conference on Computer Vision Theory and Applications
542
Acquisition and Extraction
1. Perform image
crop
2. Convert RGB to
CIELAB
3. Extract the
a* channel
Cell Detection
Image Segmentation
10. Set each binary spot
as a seed-pixel
7. Compute the
Morphological gradient
9. Apply the 1st Watershed to
detect the watershed lines
8. Apply the
Morphological operators
11. Group the binary spot and
the watershed lines
12. Apply the 2nd Watershed
to detect the stomata
4. Apply the
Wavelet Transform
5. Apply the Spot
Detection
6. Reconstruct into
binary image
Figure 2: Activity Diagram of the Proposed Approach.
(a) (b) (c)
(d) (e) (f)
Figure 3: Stomata from Ugni Molinae Species in RGB to CIELab (a) RGB-channel R; (b) RGB-channel G; (c) RGB-channel
B; (d) CIELab-channel L; (e) CIELab-channel a*; (f) CIELab-channel b*.
stomata cells by applying the Wavelet Spot Detection
algorithm (Olivo-Marin, 2002). The Wavelet Trans-
form is based on the “
`
a trous wavelet algorithm”, a
multi-scale representation where each level i is com-
puted as follows:
W
i
= A
i−1
(x, y)−A
i
(x, y) (7)
where 0 < i ≤ J, A
0
(x,y) is the original image, A
i
(x,y)
is the image after the convolution of A
i−1
(x,y) with
a specific and increased kernel, and J is the number
of scales. The W
i
(x,y) wavelet coefficients were then
filtered out, thus reducing the influence of noise and
eliminating the non-significant coefficients. Finally,
a correlation image PJ(x, y) is computed by means
of the direct product of the wavelet coefficients at all
J scales. The spot detection is obtained, therefore,
after a thresholding of the PJ(x,y) image. Contrary
to existing work which detects the bright points, our
work focus on detection of darker spots since they are
easier to be identified in the correlation image after
the conversion from RGB to CIELab.
3.3 Image Segmentation
After the spot detection analysis, we applied the
well-known Watershed Transform, used to find non-
uniform image contours. However, we used a slightly
adapted method proposed by Meyer (Meyer, 1994).
Firstly, we used the a* channel from the converted
image to extract a morphological gradient (dilate -
Segmenting High-quality Digital Images of Stomata using the Wavelet Spot Detection and the Watershed Transform
543

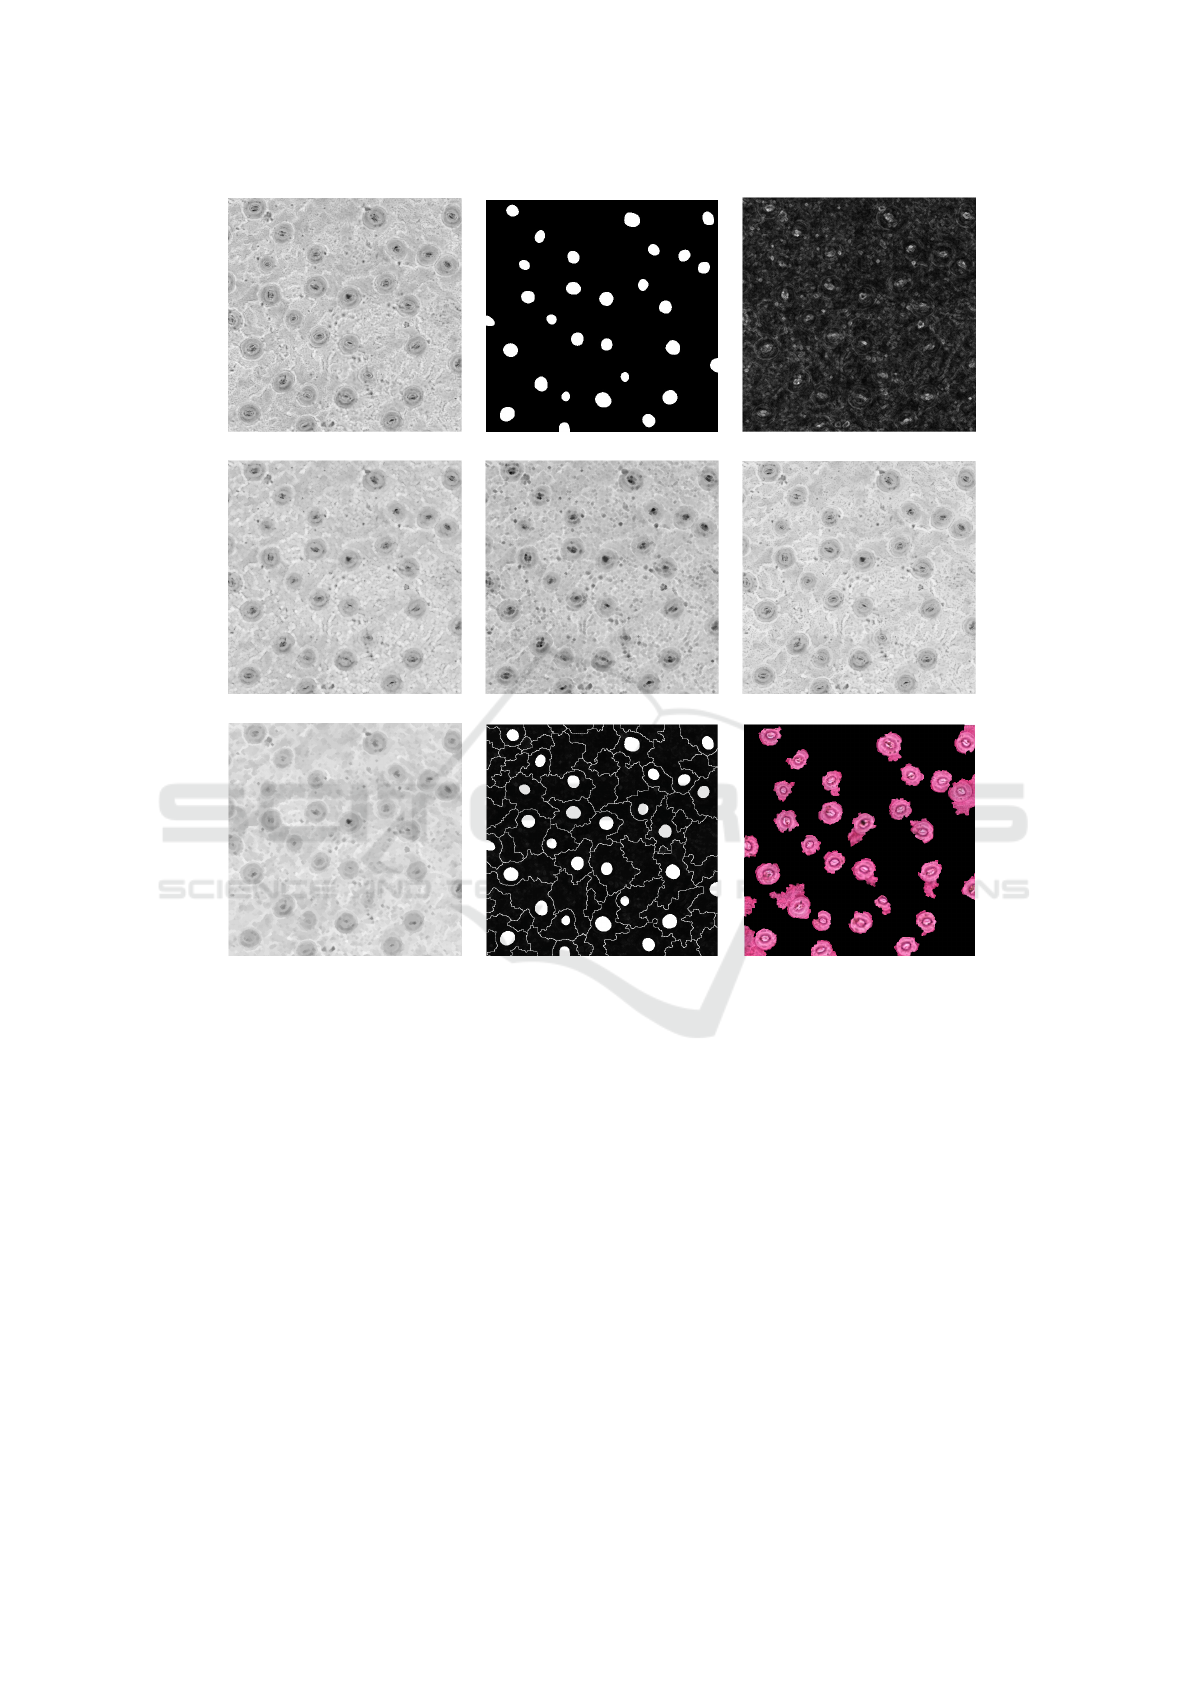
erode), as shown in Figure 4(c). Secondly, it is impor-
tant to notice that stomata images have texture on their
epidermis, what precludes the direct (or immediate)
application of the Watershed. Therefore, six morpho-
logical operators were applied into the same a* chan-
nel prior to the Watershed, in this order: Open, Erode,
Reconstruct, Close, Dilate and Reconstruct, using a
kernel k = 2. These operators were applied to smooth
the image.
Figure 4(d-g) illustrates the images resulting from
the application of the morphological operators. Then,
we applied the first Watershed producing an image
with watershed lines. We override the a* channel im-
age with both watershed lines and spots location.
Next, we used a second Watershed to find the re-
gions using the spots as markers, as illustrated in Fig-
ure 4(h). Finally, we combined the mask obtained
from the previous step with the original image to gen-
erate the result shown in Figure 4(i).
4 RESULTS
In this section we present the results divided into two
groups: 1) Detection/Counting, and 2) Segmentation.
The first group is a necessary (previous) step for the
second one. Both counting and segmentation are ap-
plied to the same dataset containing 64 image crops
(1024 x 1024 pixels each image). The same dataset
was used in both studies.
For performance evaluation of the counting and
segmentation approaches, we use recall, precision
(Baeza-Yates and Ribeiro-Neto, 1999) and the F-
Measure (Arbelaez et al., 2011), which are defined
as follows:
Recall =
T P
T P + FN
(8)
Precision =
T P
T P + FP
(9)
F =
2 ∗ Recall ∗ Precision
Recall + Precision
(10)
where T P is a true positive, FN is a false negative,
and FP is false positive. Note that in segmentation, a
T P indicates that a pixel is identified as representing
a stoma by both algorithm and gold standard; FN cor-
responds to the case where the algorithm finds a back-
ground pixel whereas the gold standard found a stoma
pixel; A FP occurs whenever the algorithm identifies
a stoma pixel, but it is in fact a background pixel set
by the gold standard.
In counting, a FP occurs when a dot is found in
an area where there is no stoma. A single dot found
within the actual stoma area represents a T P. Finally,
a FN represents the absence of a dot in an actual
stoma area.
Table 1 shows a sample with 5 randomly chosen
images, retrieved from the 64 image-set that was used
in this work. Its purpose is only to convey an idea of
how the results were calculated, i.e. the full range of
results are actually shown in the following subsection.
4.1 Detection and Counting
In the detection and counting step, we compare our
approach with two others methods: 1) manual, con-
sidered a gold standard, and 2) the method by Oliveira
et al (Oliveira et al., 2014). In order to test the pro-
posed method, we discarded all stomata that were
split in two across the center in the cropped image
before applying it to the image crops (1024 x 1024
pixels). Those stomata that were only partially cut by
the crop (but with the whole center preserved) were
considered. The results are shown in Table 1, which
compares the performance of the algorithm versus the
manual procedure using the recall and precision mea-
sures.
In Figure 4(b) we illustrate the results in terms
of the stomata identified directly on the image of the
plant tissue. As we have mentioned earlier, we used
64 cropped images of the plant (Ugni Molinae), and
the results show an improvement over the work by
Oliveira (Oliveira et al., 2014). The proposed ap-
proach was compared to manual detection for all the
samples, and the following results were obtained:
1. Recall: The average recall reached by our method
was 98.24% against 95.13% obtained by Oliveira
(Oliveira et al., 2014). Furthermore, recall was
improved upon the latter work in 84.37 % of the
images.
2. Precision: The average precision reached by the
proposed method was 98.34% against 92.81 %
from Oliveira (Oliveira et al., 2014). Moreover,
compared to the latter work, the proposed method
showed a more satisfactory precision in 90.62%
of images.
3. F-Measure: The average F-Measure found by
our method was 98.25% against 93.80% from
Oliveira (Oliveira et al., 2014). It is also impor-
tant to notice that 84.37% of images scored an
improved F-measure in comparison to latter work.
The graph shown in Figure 5 illustrates the com-
parison of the methods for each image using the
F-Measure.
VISAPP 2017 - International Conference on Computer Vision Theory and Applications
544
”
(a) (b) (c)
(d) (e) (f)
(g) (h) (i)
Figure 4: Stomata Segmentation Process from U gniMolinae Species (a) Channel a* ; (b) Binary spots from Wavelet Spot
Detection; (c) Morphological Gradient; (d) Open; (e) Erode; (f) Reconstruct; (g) Close; (h) Watershed lines and spots; (i)
Stomata detected. The images (a) and (c-g) had their contrast enhanced for better visualization.
4.2 Segmentation
The segmented image was compared to the gold stan-
dard pixel by pixel. For the test, we also discarded
all split stomata that occur during the crop process.
The gold standard was prepared by a specialist us-
ing the Interactive Segmentation Tool (McGuinness
and O’Connor, 2010), and then compared using the
F-Measure.
This new approach reaches an F-Measure of 70%.
Figure 6 shows a graph that represents the relationship
between Recall, Precision and F-Measure for each
tested image.
5 SUMMARY AND CONCLUSION
The analysis of stomata count is a crucial activity in
the assessment of plants and the state-of-the-art in this
field is still limited. In this work we introduced a
new method for detection/counting and segmentation
of stomata using the conversion of the color space, the
Nondecimated Wavelet Transform for the detection of
dark spots (i.e. stomata), and the Watershed Trans-
form. We conducted experiments with high quality
digital images and the results obtained indicated a sat-
isfactory determination of the number of stomata in
the tissue. The first case of the comparison analysis
showed that our approach provided precision and re-
Segmenting High-quality Digital Images of Stomata using the Wavelet Spot Detection and the Watershed Transform
545
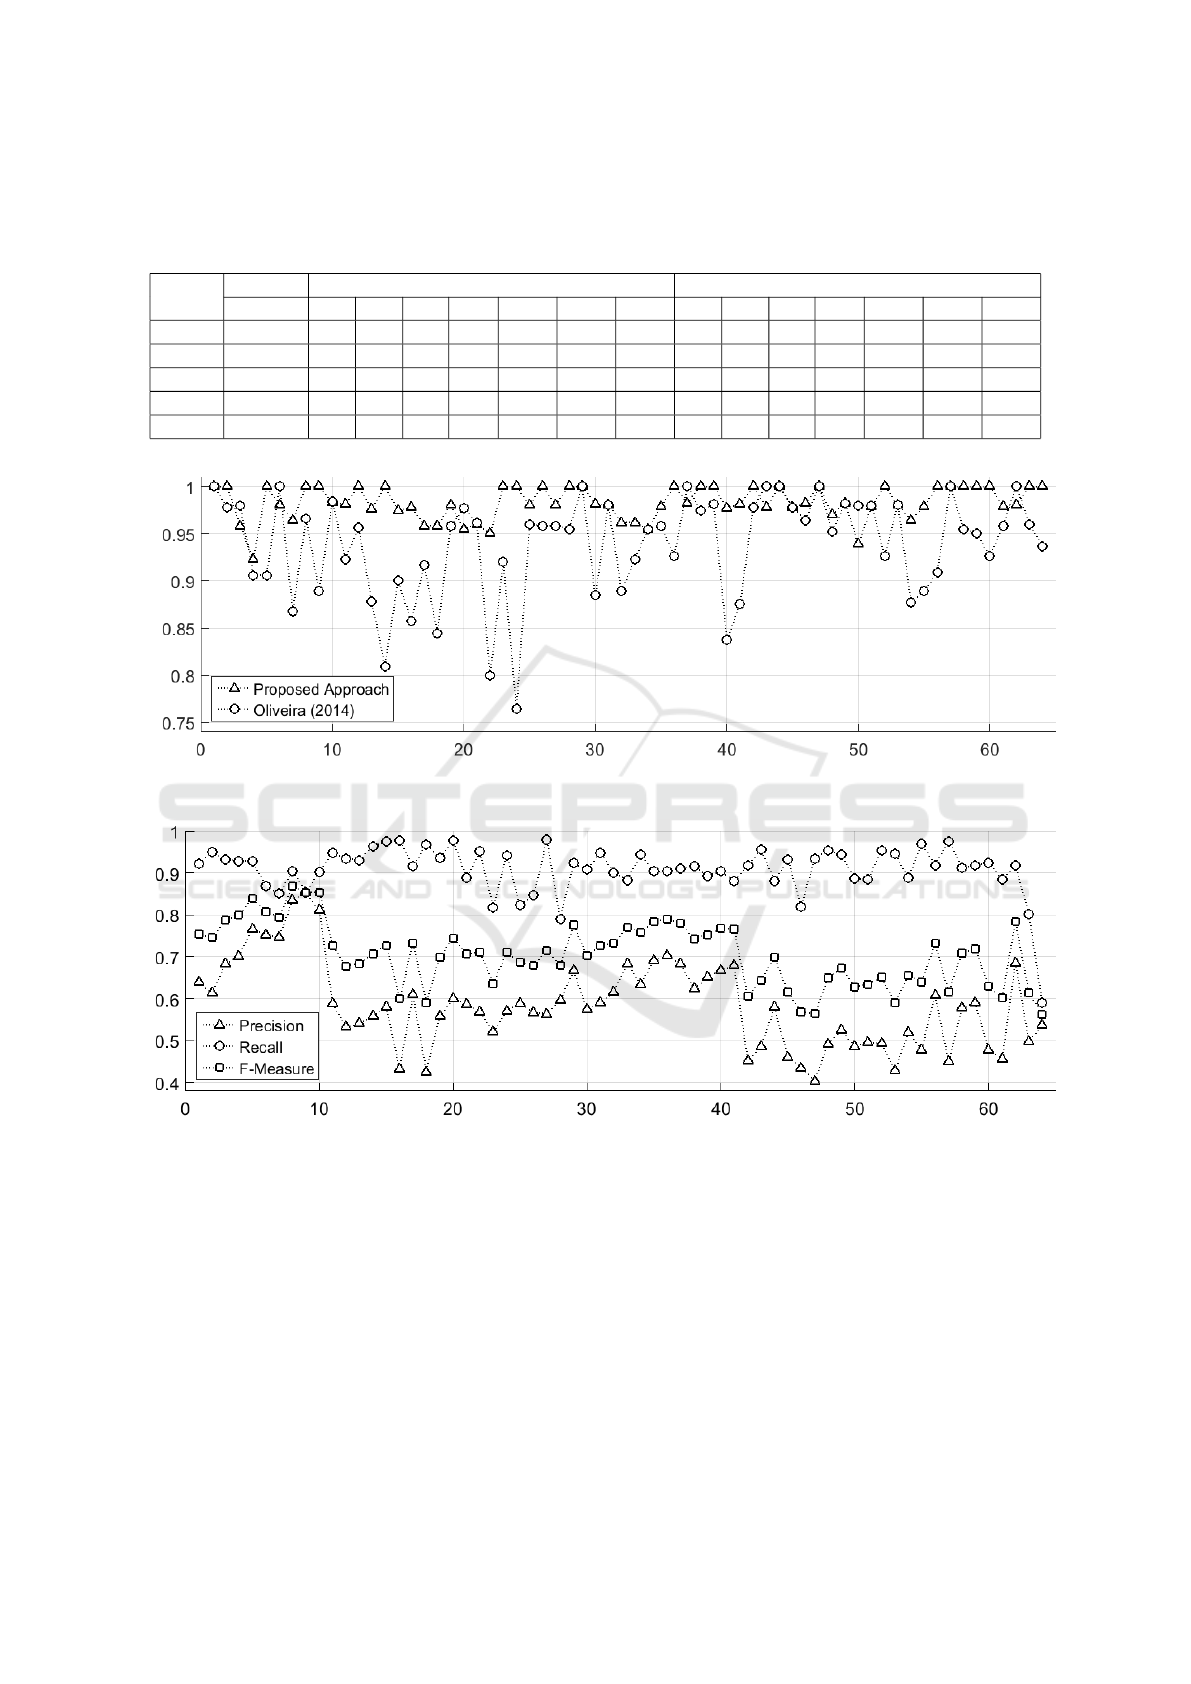
Table 1: Performance analysis of the proposed approach in comparison to the gold standard. N
h
is the number of stomata
detected by the specialist; N
a
represents the number of stomata detected automatically; FP is the number of false positives;
FN is the number of false negatives; P is the Precision; R represents Recall; F is the F-Measure.
Image Manual Our Method Oliveira (2014)
# Nh Na TP FP FN R P F Na TP FP FN R P F
1 27 29 27 2 0 93.1 100 96.4 30 25 5 2 83.3 92.6 87.7
2 24 23 23 0 1 100 95.8 97.8 21 20 1 4 95.2 83.3 88.8
3 21 21 21 0 0 100 100 100 23 20 3 1 86.9 95.2 90.8
4 23 24 23 1 0 95.8 100 97.8 25 23 2 0 92 100 95.8
5 25 27 25 2 0 92.6 100 96.1 20 20 0 5 100 80 88.8
Figure 5: Comparison Analysis by F-Measure for 64 images: Detection/Counting.
Figure 6: Performance evaluation of segmentation for 64 stomata images: Segmentation.
call values (84.37% and 90.62% respectively) larger
than previous work and comparable in performance to
manual, non-automatic counting. The second case in-
dicated an F-Measure of 70 % in comparison to man-
ual segmentation.
As future work, we will focus on a new approach
to count the stomata that were split in the image-
cropping process, in order to further improve preci-
sion. Deep Learning could be a future approach to
be applied, depending on the improvement of our
dataset, e.g. regarding a larger number of images.
We also aim at image segmentation using Spectral
Graph Theory (SGT) and Normalized Cut with tex-
ture analysis and comparison with the proposed ap-
proach, as well as the computation of additional in-
formation about stomata such as area, aperture width,
guard-cells width and length.
ACKNOWLEDGEMENTS
The authors would like to thank SCIANLab from the
University of Chile for providing the images of veg-
etable tissue used in this work.
VISAPP 2017 - International Conference on Computer Vision Theory and Applications
546

REFERENCES
Arbelaez, P., Maire, M., Fowlkes, C., and Malik, J. (2011).
Contour detection and hierarchical image segmenta-
tion. IEEE Transactions on Pattern Analysis and Ma-
chine Intelligence, 33(5):898–916.
Baeza-Yates, R. A. and Ribeiro-Neto, B. (1999). Mod-
ern Information Retrieval. Addison-Wesley Longman
Publishing Co., Inc., Boston, MA, USA.
Connolly, C. and Fleiss, T. (1997). A study of efficiency
and accuracy in the transformation from rgb to cielab
color space. IEEE Transactions on Image Processing,
6(7):1046–1048.
Hamamatsu (2016). Hamamatsu Nanozoomer XR micro-
scope. http://www.hamamatsu.com/eu/en/community/
nanozoomer/index.html. [Online; accessed 21-
September-2016].
Jian, S., Zhao, C., and Zhao, Y. (2011). Based on re-
mote sensing processing technology estimating leaves
stomatal density of populus euphratica. In Geo-
science and Remote Sensing Symposium (IGARSS),
2011 IEEE International, pages 547–550.
Laga, H., Shahinnia, F., and Fleury, D. (2014). Image-based
plant stomata phenotyping. In Control Automation
Robotics Vision (ICARCV), 2014 13th International
Conference on, pages 217–222.
Lojk, J., Sajn, L., Aibej, U., and Pavlin, M. (2014). Auto-
matic cell counter for cell viability estimation. In In-
formation and Communication Technology, Electron-
ics and Microelectronics (MIPRO), 2014 37th Inter-
national Convention on, pages 239–244.
Mallat, S. G. (1989). A theory for multi-resolution sig-
nal decomposition: the wavelet representation. IEEE
Transactions on Pattern Analysis and Machine Intel-
ligence, 11(7):674–693.
McGuinness, K. and O’Connor, N. E. (2010). A compara-
tive evaluation of interactive segmentation algorithms.
Pattern Recognition, 43(2):434–444.
Meyer, F. (1994). Mathematical morphology and its appli-
cations to signal processing topographic distance and
watershed lines. Signal Processing, 38(1):113 – 125.
Oliveira, M. C. S., Silva, N. R., Casanova, D., Pinheiro, L.
F. S., Kolb, R. M., and Bruno, O. M. (2014). Auto-
matic counting of stomata in epidermis microscopic
images. In X Workshop de Vis
˜
ao Computacional.
Olivo-Marin, J.-C. (2002). Extraction of spots in biological
images using multiscale products. Pattern Recogni-
tion, 35(9):1989 – 1996.
Stepka, K. (2013). Image Analysis: 18th Scandinavian
Conference, SCIA 2013, Espoo, Finland, June 17-20,
2013. Proceedings, chapter Automated Cell Counting
in B
¨
urker Chamber, pages 236–245. Springer Berlin
Heidelberg, Berlin, Heidelberg.
Venkatalakshmi, B. and Thilagavathi, K. (2013). Automatic
red blood cell counting using hough transform. In In-
formation Communication Technologies (ICT), 2013
IEEE Conference on, pages 267–271.
Vialet-Chabrand, S. and Brendel, O. (2014). Automatic
measurement of stomatal density from micropho-
tographs. Trees, 28(6):1859–1865.
Willmer, C. and Fricker, M. (1996). Stomata. Topics in
plant functional biology. Springer.
Segmenting High-quality Digital Images of Stomata using the Wavelet Spot Detection and the Watershed Transform
547
