
Characterization of Uterine Response to Misoprostol based on
Electrohysterogram
C. Benalcazar Parra
1
, R. Monfort-Orti
2
, Y. Ye-Lin
1
, J. Alberola-Rubio
2
, A. Perales Marin
2
,
J. Mas-Cabo
1
, J. Garcia-Casado
1
and G. Prats-Boluda
1
1
Centro de Investigación e Innovación en Bioingeniería, Universidad Politécnica de Valencia, Valencia, Spain
2
Obstetric service, Hospital Universitario y Politécnico La Fe de Valencia, Valencia, Spain
Keywords: Labor Induction, Electrohysterogram, EHG, Misoprostol, Cervical Ripening.
Abstract: When the maternal and fetal risks of prolonging gestation are higher than the benefits, labor induction is
performed in order to stimulate uterine contractions and to facilitate cervical ripening. Nevertheless, not all
cases end up in successful induction leading to an increase in the rate of caesarean sections. The aim of this
study was to study the electrophysiological uterine response to misoprostol drug by obtaining and analyzing
the evolution of temporal and spectral parameters from uterine electromyogram (electrohysterogram, EHG)
records picked up during the first 4 hours of labor induction. Successful inductions showed a progressive
increase in amplitude and a frequency shift in spectral content towards higher frequencies approximately
120 min after the initiation of labor induction; such response was not seen in failed inductions. In
conclusion, the electrophysiological response caused by effect of misoprostol in pregnant women has been
characterized by EHG parameters which showed patterns in their evolution that were different for
successful and failed labor inductions. EHG recording and analysis could serve as a very helpful tool to
predict the success of labor induction and hence reduce risks and facilitate labor management in this
frequent clinical situation.
1 INTRODUCTION
Labor induction is a common practice in obstetrics
accounting for 20% of all births (Martin, 2010). It is
indicated when the maternal and fetal risks of
prolonging gestation are higher than the benefits. It
is performed in order to stimulate uterine
contractions and to facilitate cervical ripening.
However almost 20% of all inductions are associated
to caesarean deliveries (Seyb, 1999). Successful
induction has been defined as woman achieving
active stage of labor within 48 h, although other
studies as Gudex et al (Gudex, 1993) define it as
vaginal delivery at any moment after the induction
of labor. A key factor to reduce the maternal and
fetal distress, time and hospital costs is to know
whether a woman will reach active stage of labor or
not within a few hours of the onset of labor
induction.
Assessment of cervical condition is important to
estimate successful of labor induction. The common
method to assess cervical status and to predict labor
induction is by Bishop score (Bishop, 1964). Despite
Bishop score is widely used by clinicians, some
studies have reported that this score is subjective and
with poor reproducibility (Faltin-Traub, 2004).
Other studies as Watson et al (Watson, 1996) and
Crane et al (Crane, 2004) have proven that the
information of cervical length, maternal age, height,
weight, parity, and birth weight could be used for
predicting labor induction success. Despite all these
efforts, no reliable models are available for
predicting success of labor induction in the clinical
setting.
The characterization of uterus
electrophysiological condition may provide
additional information for predicting labor induction
success. In this respect, electrohysterogram (EHG),
which is the recording of the uterine electrical
activity on abdominal surface, has been proven to be
a promising technique to assess not only the uterine
dynamics but also the uterus electrophysiological
condition (Garfield, 2007; Schlembach, 2009;
Euliano, 2013). To date, no efforts have been made
in predicting labor induction success by using EHG
records. So as to explore the possibility of predicting
labor induction success during the first 4 hours with
64
Benalcazar Parra C., Montfort-Orti R., Ye-Lin Y., Alberola-Rubio J., Perales Marin A., Mas-Cabo J., Garcia-Casado J. and Prats-Boluda G.
Characterization of Uterine Response to Misoprostol based on Electrohysterogram.
DOI: 10.5220/0006146700640069
In Proceedings of the 10th International Joint Conference on Biomedical Engineering Systems and Technologies (BIOSTEC 2017), pages 64-69
ISBN: 978-989-758-212-7
Copyright
c
2017 by SCITEPRESS – Science and Technology Publications, Lda. All rights reserved

the help of EHG information, the aim of this work
was to study the electrophysiological uterine
response to labor induction drug (misoprostol) by
obtaining and analyzing the evolution of temporal
and spectral parameters of EHG.
2 MATERIAL AND METHODS
2.1 Recording Protocol
The study adheres to the Declaration of Helsinki and
was approved by the ethics committee of the
hospital. All subjects were informed of the nature of
the study and signed an informed consent form.
Recording sessions were carried out in healthy
women with singleton pregnancies who were
determined to undergo labor induction at Hospital
Universitario y Politécnico La Fe de Valencia. All
women underwent labor induction with vaginal
insertion of 25 µg of Misoprostol (Misofar, BIAL,
Coronado, Portugal) with repeated doses every four
hours up to three administrations. The induction was
considered successful when woman reaches active
stage of labor. Women were divided into successful
(GS) and failed induction (GF) groups according to
such criterion.
For surface myoelectrical recording, the skin was
carefully prepared using an abrasive paste in order to
reduce the contact impedance. Subsequently four
monopolar Ag/AgCl electrodes were placed on
abdominal surface as shown in figure 1: 2 electrodes
supraumbilical at each side of the medial line with 8
cm of inter-electrode distance corresponding to EHG
monopolar records (M1, M2), 1 reference electrode
in the right hip and 1 ground electrode in the left hip.
The recorded abdominal signals were amplified and
band-pass filtered (0.1-30 Hz) using a commercial
biosignal amplifier (Grass 15LT+4 Grass 15A94;
Grass Instruments, West Warwick, RI) and
digitalized at a sampling rate of 1000 Hz.
Simultaneous tocographic signal (TOCO) was
obtained by placing a pressure sensor on the
abdominal surface and conditioned using monitor
Corometrix 250cx series (GE HealthCare, General
Electric Company, USA) which sends the data to a
personal computer at a sampling rate of 4 Hz. Both
signals were stored for subsequent analysis. Each
recording session comprises: 30 minutes of basal
activity (without drug) and 4 hours after the onset of
labor induction. Finally the following obstetrical
data were also collected: maternal age, gestational
age, body mass index (BMI), gestations, parity,
Bishop score, fetal weight and time to delivery from
the initiation of the labor induction.
Figure 1: Configuration of surface electrodes for obtaining
monopolar EHG recordings (M1, M2).
2.2 Signal Preprocessing and Analysis
Since EHG signal distributes its energy between 0.1
Hz and 4 Hz, a pre-processing step was required.
First, monopolar signals were band-pass filtered
between 0.1 and 4 Hz in order to remove undesired
components. Then signals were down sampled to a
sampling rate of 20 Hz to reduce the amount of data
and computational cost. Finally, bipolar EHG signal
were obtained digitally to reduce common mode
interferences as follows:
Bip = M2 - M1 (1)
Since counting the number of uterine
contractions in a period time is traditionally used to
study the progress of labor, first of all the number of
contractions detected by conventional method
(TOCO) and EHG was valued. TOCO contractions
were considered when detecting a significant rise in
amplitude (>20mmHg) and a minimum duration of
30s. EHG bursts associated to uterine contraction
were manually segmented from bipolar signal using
the following criteria: burst had to correspond to
significant increase in amplitude and/or frequency in
comparison to basal activity, present a minimum
duration of 30 seconds, and no artifact evidence
should have been observed during contraction.
Next, in order to characterize the EHG bursts, a
set of temporal and spectral parameters were
obtained in the range of (0.2-1Hz) since important
information is contained in this range (Garfield,
2007) (Marque, 1986):
• Duration (s)
• Peak to peak amplitude (μV)
• Mean frequency: MF (Hz)
• Dominant frequency in 2 frequency ranges:
DF1 (0.2-1 Hz) and DF2 (0.34-1 Hz)
• Ratio between the energy content in high
(0.34-1 Hz) and low frequency ranges (0.2-
0.34 Hz): H/L ratio
M1
M2
Reference
Ground
Characterization of Uterine Response to Misoprostol based on Electrohysterogram
65
So as to analyze the uterine electrophysiological
response to labor induction drugs, the median values
of parameters computed from EHG-bursts in
windows of 30 minutes were worked out for each
patient. Then, for each parameter and window of
analysis, the mean and standard deviation were
calculated over all the patients of each group (GS,
GF).
3 RESULTS
For a total of 14 patients, 79.6% ended in successful
induction. The obstetrics and clinical parameters of
the study groups are summarized in Table 1. Women
in both groups, GS and GF groups, were comparable
in terms of maternal age (31.9 ± 3.62 vs. 32±2) and
bishop scores (1.36±1.03 vs. 1.33±1.53). Time to
delivery was slightly shorter for women ending in
successful inductions than for those who did not
(22.98 ± 10.8 h vs. 26.62 ± 9.81 h) and newborn
weight was also shorter for GS group (3381 ± 484 g
vs. 3541.67 ± 9.81 h).
Table 1: Obstetrical and clinical parameters of patients
induced with misoprostol. Mean (std).
Variable
Success
N=11
Failure
N=3
Maternal age (years) 31.9 ± 3.62 32 ± 2
Gestational age (days) 287.64 ± 1.96 287.0 ± 0
BMI (kg/m2) 30.88 ± 6.15 31.13 ± 1.36
Gestations 1.27 ± 0.47 1 ± 0
Parity 0.18 ± 0.40 0 ± 0
Bishop score 1.36 ± 1.03 1,33 ± 1,53
Newborn weight (g) 3381 ± 484 3541.67 ± 271
Time to delivery (h) 22.98 ± 10.8 26.62 ± 9.81
Figure 2 shows the total number of contractions
detected by TOCO records and EHG records. For all
Figure 2: Contractions detected by TOCO and EHG
records.
recording session, the total number of detected
contractions in EHG records was almost double than
in TOCO records (627 vs. 324).
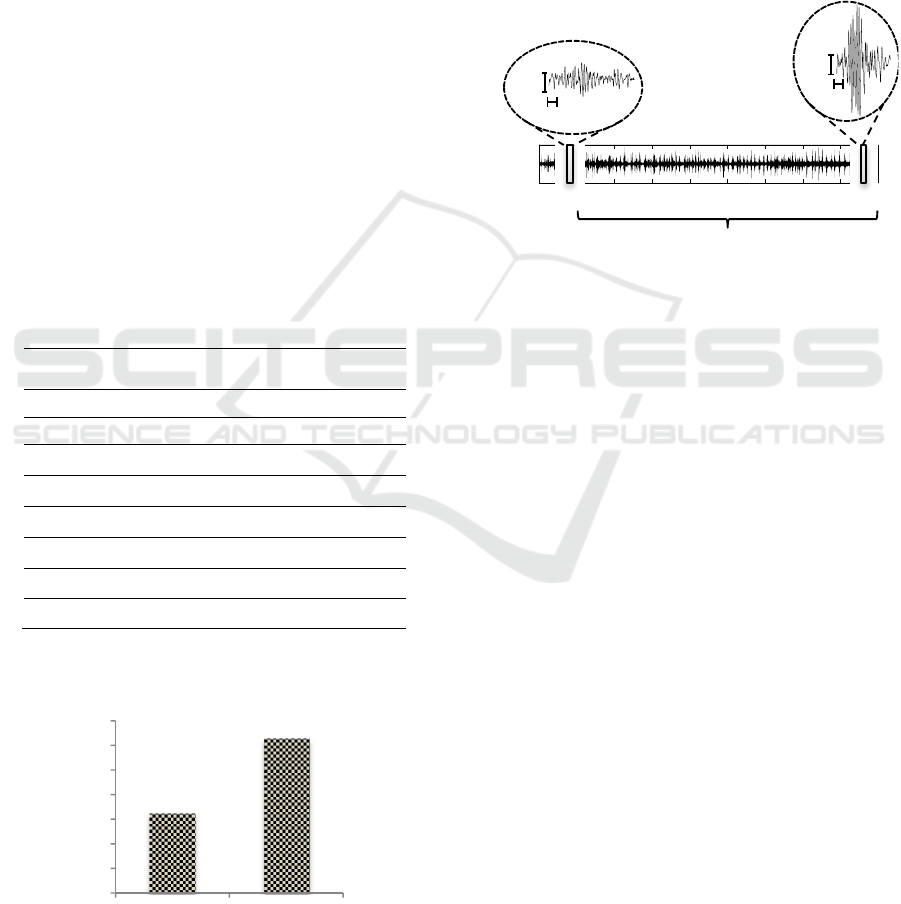
Figure 3 shows an EHG recording from a
woman who reached active stage of labor. When
comparing the EHG-burst obtained during the last
hour and basal activity, the EHG-burst amplitude
was significantly greater, contraction duration was
shortened, and the biopotentials oscillation was
faster suggesting the appearance of high frequency
components in EHG-burst.
Figure 3: Morphological changes in EHG burst of a
patient of the study (successful induction).
Means and standard deviations of the computed
parameters in each analysis window of 30 minutes
for GS and GF are shown in table 2 and evolution of
mean values are depicted in figure 4. For GS group,
EHG-burst duration tends to decrease, with values of
88.6±23.6 seconds at basal state (prior to drug
administration) to values of 61.6±13.0 seconds at the
last analysis window. By contrast, no clear trends
were observed in this parameter for GF group.
In regard to EHG-bursts amplitude, GS group
presented higher uterine contraction intensity than
GF group even in the basal state. In addition GS
group experiment a growing trend with values of
124.1±39.8 μV at basal state up to 167.8±58.9 μV at
the last analysis window. By contrast, the EHG-burst
amplitude changes were less noticeable in GF group
(from 83.4±15.1 μV to 102.9±11.2 μV).
Concerning to the spectral parameters, as it can
be seen in figure 4, mean frequency, DF1, DF2 and
H/L ratio parameters undergo an increasing trend for
GS group, showing a shift of the EHG-burst spectral
content towards higher frequencies (Fast wave high).
In GS patients, this shift is clearly revealed in the
H/L ratio (1.1±0.6 basal state vs. 2.8±2.0 4 hours
after labor induction onset), which measures the
energy ratio in between the high and low frequency
bands. Although similar H/L ratio values are
obtained for both GS and GF groups, this parameter
0
100
200
300
400
500
600
700
TOCO EHG
0
0
0
0
0
0
0
50 µV
10 s
0
3
0
6
0
9
0
1
2
0
1
5
0
1
8
0
2
1
0
2
4
0
2
7
0
0
30 60 90 120 150
180
210
240
270
-200
200
0
0
0
50 µV
10 s
t (min)
Amplitude
(µV)
Recording time after misoprostol
administration (4 h)
BIOSIGNALS 2017 - 10th International Conference on Bio-inspired Systems and Signal Processing
66

did not show a clear trend after labor induction onset
in the GF group, resulting in a considerably lower
value than GS group at hour 4.
4 DISCUSSION
Labor induction has become a common practice in
obstetrics. The number of labor inductions has
increased significantly in recent years. Studies
explain that this rise is due to an increase in
medically indicated induction as well as an increase
in elective induction (Grobman, 2007). Despite this,
not all inductions have successful outcomes,
resulting in an increase in the rate of caesarean
section. It is important to know whether a woman
will reach or not a successful induction so that
clinicians may be able to better plan deliveries,
preventing maternal and fetal stress which can
appear in long induction processes.
In this study, it was analyzed the response of
misoprostol drug used for preinduction cervical
ripening not only with traditional obstetrical
indicators, but also with parameters that characterize
the resulting myoelectrical activity of the uterus. Our
data shows that 25 µg of Misoprostol with repeated
dose up to three administrations has similar efficacy
in terms of success rate in comparison with other
authors (Mayer, 2016). Accordingly to Mayer et al,
success inductions with 200 µg of misoprostol
occurred in 77.3% of the cases and our results shows
a 79.6% of success inductions.
In addition, for patients involved in the study,
the time between induction and delivery for success
group was 22.98 ± 10.8 h. Although this result does
not match with those of other authors (Papanikolaou
et al, 2004) who obtain a shorter value of time to
delivery 11.9 h, this could be explained because of
the different dose employed for labor induction.
Instead of 25µg of misoprostol, they used a 50µg
dose with repeated doses up to three times.
On the other hand, our results show that EHG
records have better performance in detecting uterine
contractions than TOCO records (627 vs. 324).
Given that nowadays the number of contractions is a
basic parameter to assess labor progress, this
technique could provide a better assessment in this
sense. This is also consistent with other studies that
have seen the limitations concerning to the use of
TOCO records for monitoring uterine dynamics in
other conditions (Euliano, 2009).
Concerning to the characteristics of the EHG, the
results of this work indicate that patients from GS
and GF experiment a different electrophysiological
response to the induction drug. Failure group, except
for contraction duration, did not show any clear
trend. In contrast, in success group a gradual
increase is evident in values of EHG-burst amplitude
as well as spectral parameters. These results suggest
that misoprostol, as an agent for the stimulation of
uterine activity, acts favoring the increase of cell
junctions (gap junction); thus increasing the total
number of active cells during EHG-burst (Garfield,
2007) and so the presence of more intense
contractions and an increased ratio of the cells’
excitability. In comparison with basal state,
significant changes in EHG characteristics begin to
show as early as about 90-120 minutes after
misoprostol administration. These results coincide
with other authors who have analyzed the effect of
misoprostol on uterine contractility (Arronson et al,
2004). This study reported that the first effect of
misoprostol is an increment in uterine tonus. Then
after 1-2 h, the tonus began to decrease and is
replaced by regular uterine contractions being the
uterine activity, measured in Montevideo units,
significantly greater after 2 h of misoprostol
administration. Moreover the time required to
manifest the changes in EHG characteristics when
inducing with misoprostol is coherent with the
pharmacokinetic studies (Tang, 2002). In such study
it was found that plasma concentration of
misoprostol gradually increases after 400µg of
vaginal administration and peak plasma
concentration is reached between 75 and 80 minutes.
After that, plasma concentration slowly decreases
and undetectable levels of drug are seen even after 6
h.
Furthermore, other authors have analyzed the
evolution of the EMG activity up to 12 hours after
administration of dinoprostone which is another
commonly drug used for labor induction (Aviram et
al, 2014). They found that uterine EMG activity,
defined as mean electrical activity of the uterine
muscle over a period of 10 minutes, did not change
significantly during the first two hours, and then
increased between 2 and 8 hours after dinoprostone
administration. Another study that analyzed the
EMG activity during labor induction with oxytocin
and dinoprostone (Toth, 2005), found statistically
significant difference in the uterine activity index
between successful and unsuccessful labor induction
after 210 minutes of labor induction onset In
comparison with our results, the uterus response to
misoprostol is faster than the response to
dinoprostone shown in those other studies. Other
authors have used DF2 parameter of EHG to analyze
Characterization of Uterine Response to Misoprostol based on Electrohysterogram
67
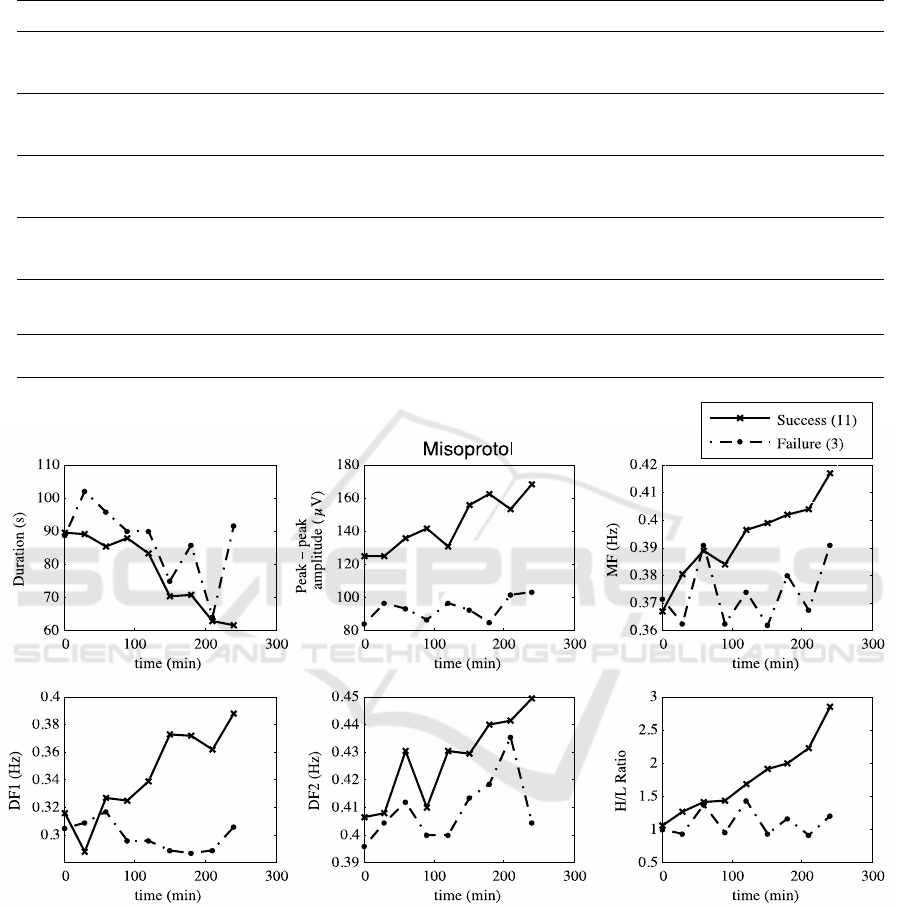
Table 2: Mean and standard deviation of parameters in each 30 minutes period. S: Successful induction F: Failure
induction.
Parameter 0' 30' 60' 90' 120' 150' 180' 210' 240'
Duration
(s)
S 88.6±23.6 87.5±25.2 76.3±16.7 87.9±25.4 76.7±20.9 70.0±13.6 69.6±16.1 60.8±6.7 61.6±13.0
F
88.5±20.9 97.3±11.0 95.8±33.3 83.7±27.0 89.7±45.9 75±2.8 85.8±23.7 64.0±7.0 90.8±49.6
Amplitude
(µV)
S
124.1±39.8 124.3±33.9 135.8±46.9 141.6±37.9 130.4±35.2 155.2±52.7 162.1±83.1 152.6±65.3 167.8±58.9
F
83.4±15.1 96.1±11.7 93.0±31.7 86.2±20.6 96.2±16.9 92.2±12 84.7±13.5 101.6±13.1 102.9±11.2
MF (Hz)
S
0.37±0.03 0.38±0.02 0.39±0.03 0.38±0.04 0.40±0.03 0.40±0.04 0.40±0.04 0.40±0.05 0.42±0.04
F
0.37±0.02 0.36±0.02 0.39±0.02 0.36±0.02 0.37±0.02 0.36±0.03 0.38±0.02 0.37±0.01 0.39±0.02
DF1 (Hz)
S
0.31±0.04 0.29±0.05 0.33±0.08 0.32±0.06 0.34±0.10 0.37±0.08 0.37±0.10 0.36±0.11 0.39±0.08
F
0.30±0.04 0.31±0.04 0.32±0.06 0.29±0.03 0.30±0.04 0.29±0.02 0.29±0.02 0.29±0.03 0.31±0.01
DF2 (Hz)
S
0.41±0.03 0.41±0.04 0.43±0.05 0.41±0.04 0.43±0.05 0.43±0.06 0.44±0.05 0.44±0.06 0.45±0.05
F
0.40±0.03 0.40±0.03 0.41±0.05 0.40±0.05 0.40±0.02 0.41±0.03 0.42±0.20 0.44±0.03 0.40±0.02
H/L
S
1.1±0.6 1.3±0.6 1.4±0.6 1.4±0.8 1.7±1.2 1.9±1.2 2.0±1.3 2.2±1.6 2.8±2.0
F
1.0±0.3 0.9±0.3 1.4±0.5 0.9±0.3 1.4±0.9 0.9±0.4 1.2±0.4 0.9±0.4 1.2±0.5
Figure 4: Temporal evolution of the EHG-burst parameters for women induced with misoprostol.
the effect of nifedipine which is tocolytic agent to
decrease uterine activity (Vinken, 2010). Our work
confirms the utility of spectral parameters to
characterize the electrophysiological response of the
uterus to drugs, and points to the possibility of
predicting the success of labor induction by
analyzing the EHG in the first 4 hours. For this final
aim, a more comprehensive database and the use of
machine learning methods would be needed.
5 CONCLUSION
To conclude, 25 µg of misoprostol with repeated
doses up to 3 administrations showed good
performance for labor induction. EHG can provide
relevant information about the electrophysiological
state in labor induction, In contrast to failed
inductions, a successful labor induction is associated
to remarkable changes in the characteristics of the
BIOSIGNALS 2017 - 10th International Conference on Bio-inspired Systems and Signal Processing
68

EHG signal (burst amplitude increase and energy
shift towards higher frequencies) after 120 minutes
of vaginal drug administration. These results point
that EHG analysis could help to predict the outcome
of labor induction.
ACKNOWLEDGEMENTS
The Ministry of Economy and Competitiveness and
the European Regional Development Fund
(DPI2015-68397-R) and Bial’s company support
this work.
REFERENCES
Martin J A, Hamilton B E, Ventura S J. et al. Births: final
data for 2010. Natl Vital Stat Rep. 2012;61:1–72.
Seyb ST. Risk of cesarean delivery with elective induction
of labor at term in nulliparous women. Obstet Gynecol
1999, 94:600–607
Gudex G. Induction of labour with prostaglandin E2 a
prospective audit. NJ Med J 1993; 106: 78–80.
Bishop EH. Pelvic scoring for elective induction. Obstet
Gynecol 1964;24:266–8
Faltin-Traub EF, Boulvain M, Faltin DL, Extermann P,
Irion O. Reliability of the Bishop score labour
induction at term. Eur J Obstet and Gynecol Reprod
Biol 2004; 112: 178–181
Watson WS, Stevens D, Welter S, Day D. Factor
predicting successful labor induction. Obstet Gynecol
1996; 88: 990–992.
Crane JM. Predictors of successful labor induction with
oral or vaginal misoprostol. J Matern Fetal Neonat
Med 2004;15: 319–323.
Garfield R, Maner W, "Physiology and electrical activity
of uterine contractions," Semin. Cell Dev. Biol., vol.
18, no. 3, pp. 289-295, June 2007
A. Aronsson, M. Bygdeman, and K. GemzellDanielsson,
“Effects of misoprostol on uterine contractility
following different routes of administration,” Hum.
Reprod., vol. 19, no. 1, pp. 81–84, Jan. 2004
Schlembach D, Maner WL, Garfield RE, Maul H.
Monitoring the progress of pregnancy and labor using
electromyography. European Journal of Obstetrics,
Gynecology, and Reproductive Biology 2009;
144(Suppl 1): S33–9.
Euliano TY, et al. Monitoring uterine activity during
labor: A comparison of 3 methods. Am J Obstet
Gynecol. 2013;208(1):66.e1–66.e6.
Marque C, Duchene JM, Leclercq S, Panczer GS,
Chaumont J. Uterine EHG processing for obstetrical
monitoring. IEEE Trans. Biomed. Eng. 1986; 33(12):
1182-7
Grobman, William A. Elective Induction: When? Ever?
Clinical obstetrics and gynecology (0009-9201). 50
(2), p. 537.
Mayer R, Oppelt P, Shebl O, Allerstofer, C, Weiss C.
Initial clinical experience with a misoprostol vaginal
insert in comparison with a dinoprostone insert for
inducing labor. Euro. Jour. of Obst. and Gyneco. and
Reprod. Biol. , Volume 200 , 89 – 93.
Papanikolaou E, Plachouras N, Drougia A, Andronikou S,
Vlachou C, Stefos T, Paraskevaidis E, Zikopoulos K.
Comparison of Misoprostol and Dinoprostone for
elective induction of labour in nulliparous women at
full term: A randomized prospective study.
Reproductive Biology and Endocrinology 2004, 2:70.
Vinken M, Rabotti C, Mischi M, van Laar J, Oei S.
Nifedipine-induced changes in the electrohysterogram
of preterm contractions: feasibility in clinical practice.
Obstet Gynecol, vol 2010, 2010, pp 1-8.
Tang OS, Schweer H, Seyberth HW, Lee SW and Ho PC
(2002) Pharmacokinetics of different routes of
administration of misoprostol. Hum Reprod 17,332-
336.
Aviram A, Melamed N, Hadar E, Raban O, Hiersch L,
Yogev Y, et al. Effect of Prostaglandin E2 on
Myometrial Electrical Activity in Women Undergoing
Induction of Labor. J Perinatol. 2014;31:413–8.
Toth T. Transcutaneous electromyography of uterus in
prediction of labor outcome induced by oxytocine and
prostaglandine shape. Gynaecologia et perinatologia:
journal for gynaecology, perinatology, reproductive
medicine and ultrasonic diagnostic, vol 14 no 2, 2005.
Characterization of Uterine Response to Misoprostol based on Electrohysterogram
69
