
Development of an Innovative Methodology Supporting
Project Risk Management in the Manufacturing Company
of the Automotive Industry
Anna Gembalska-Kwiecień
Faculty of Organization and Management, Institute of Production Engineering, Silesian University of Technology,
Roosevelta 26 str., Zabrze, Poland
Keywords: Innovations, Project Risk Management, Methodology, Optimization of the Decisions, Management Science.
Abstract: The presented article attempts to develop an innovative methodology for supporting risk management of the
implementation of projects. The methodology applies to manufacturing companies of the automotive
industry, because it is one of the industries where the projects are comparable to each other. On this basis, it
is possible to identify the risks that occurred in the past during the various stages of projects, which can
contribute to more effective risk management during the current and future projects. The paper presents
selected methods of data analysis: statistical method and method of graphical data visualization. There are
also shown recommendations for data collection and processing which will enable the development of the
innovation called authorial methodology. This developed methodology describes how to collect data on
ongoing projects, as well as how to make their analysis to allow their subsequent use. The presented
methodology is to aimed at optimizing decision making for project implementation in management
sciences.
1 INTRODUCTION
The basis of production companies of the
automotive industry is the completion of projects.
Extensive engineering centers, cooperating closely
with production facilities, are responsible for the
development of existing, and entirely new product
concepts. Starting with the implementation of the
developed solutions and ending in production. In
situation where the project involves cooperation
with crucial contractor for the company, or is
intended to implement a very important strategic
objectives of the company. The success depends on
whether the company is competitive on the market.
Regardless of market segment of the company,
the completion of projects involves many
challenges, which are diverse and complex.
However, the common feature for all difficulties is
that they carry a risk. It could threaten the planned
completion of the project, or lead to a total failure.
To avoid failure, people such as project managers,
operational managers, or leaders of the various units
use methods supporting the management of risks.
The aim of these methods is to prepare for the risk
(negative risk – called threat »Korczowski, 2010;
PMBOK Guide, 2012«) to respond in the incidents
of danger, and to eliminate or at least to reduce their
undesirable effects. Concept of the risk is also
associated with the possibility of incidents which
can lead to positive consequences: this risk is called
opportunity (Jaafari, 2001). The role of the person
responsible for this phase of the project is to make
the opportunity happen.
In the case of companies whose functioning is
based on the successful completion of projects, it is
very important to pay attention to various aspects of
the tasks. The aim is to improve efficiency, reduce
the amount of unplanned costs and to achieve the
intentions according to the plan. In such situations, it
is important to draw the appropriate conclusions
after, and during the completion of each project.
It should concern issues such as execution
management tasks, cooperation with subcontractors,
or the quality of the work performed by the
individual functional groups. Information about
these issues can be useful for risk management in the
future, because the knowledge of the past risks or
opportunities, combined with the knowledge on how
Gembalska-KwiecieÅ
ˇ
D A.
Development of an Innovative Methodology Supporting Project Risk Management in the Manufacturing Company of the Automotive Industry.
DOI: 10.5220/0006121102650271
In Proceedings of the 6th International Conference on Operations Research and Enterprise Systems (ICORES 2017), pages 265-271
ISBN: 978-989-758-218-9
Copyright
c
2017 by SCITEPRESS – Science and Technology Publications, Lda. All rights reserved
265

to deal with such situations, can contribute to the
fast, and appropriate risk response (Larose, 2006;
Pickett and Elliot, 2007).
Sometimes after the completion of the project,
there is not enough time to analyze it and draw
conclusions, because next project is started very
quickly.
In that case it is not possible to share the
knowledge gained during the completion of the
project with other employees of the company or to
catalogue it properly. That is why it would be useful
to have a tool to support fast archiving of
information and knowledge, and to be able to draw
conclusions on the basis of available data.
An obstacle to the practical use of such tool is
the fact that each of project is innovative and unique,
so their comparative analysis will not always make
sense. However if similar projects would be studied,
their comparison can provide useful information and
lead to conclusions which will be helpful in
managing the risk of other similar projects realized
by the company in the future.
This situation takes place in companies in
automotive industry, which realize many similar
projects. This means that the projects are
comparable to each other, and on this basis it is
possible to formulate a thesis that the identify the
risks that have occurred in the past at different stages
of projects, it can contribute to more effective risk
management during the current and future projects.
To be able to use this approach in practice, it is
necessary to know the methodology of data analysis
on completed projects in order to identify the risks
related with them.
The aim of this paper is to develop the
methodology for collecting and analyzing data on
completed projects that allow their subsequent
analysis, in order to identify key risks of projects,
and provide valuable information.
2 METHODS OF DATA
ANALYSIS
The development of the methodology of analysis of
projects and to implement it as a tool based on a
spreadsheet, it is helpful to have knowledge of
exploration topics (Dvir, Raz and Shenhar, 2003).
The following are methods for the analysis and
presentation of data:
The statistical method, which will be used in
creating the spreadsheet, supporting project risk
management. This method is based on the
analysis of the probability of risks. The
possibility of using this method is based on the
information gathered from past projects;
Method of graphical data visualization, which
enables to analyze the data through the visual,
and thus it gives the chance the data will be
noticed in a way that would be difficult to
determine through analysis of algorithm by a
computer. The method should be used in the
process of developing a spreadsheet, because it
can provide additional opportunities to draw
conclusions by the user through the observation
of graphical presentation of the data (Hand,
Mannila and Smyth, 2006).
Note, however, that before you can use the
selected method, it is necessary to determine the
appropriate method of collecting data on developing
on developing projects.
3 METHODOLOGY OF DATA
COLLECTION AND ANALYSIS
To make valuable data analysis it is necessary to
determine the appropriate method of data collection.
It was determined that the collection of data may
occur as follows:
1) At the beginning of the project and at each of its
stages, the following information should be
provided:
a) what budget has been allocated for the
completion of the project (planned cost of
completion);
b) time planned for completion;
c) the identified sources of uncertainty;
d) the identified risks.
e) the success factors of the project, which
should be provided.
2) After completion of the project and at each of
its stages, the following data should be
collected:
a) the amount of money that has been spent
on the completion (actual cost);
b) the duration of completion;
c) the person responsible for the result of the
work performed;
d) persons/functional group that carried out
the work;
e) other stakeholders involved in the
completion and their impact on the project;
f) sources of uncertainty identified during the
implementation;
ICORES 2017 - 6th International Conference on Operations Research and Enterprise Systems
266

g) sources of uncertainty, that resulted in
materialized risks;
h) risks identified during the completion;
i) materialized risks;
j) financial and timing impact of materialized
risks on project/stage;
k) success factors of the project, which
should be provided.
In a situation where the above mentioned data
was collected, it is possible to analyze it. Based on
the literature, its solutions (Atkinson, 1999; Gardiner
and Stewart, 2012; Pritchard 2002), and experience,
it has been attempted to create a methodology
supporting risk management of the completion of
projects in the manufacturing company of the
automotive industry.
The following is a developed methodology:
1) To conduct a separate analysis of each of the
projects/stages:
a) comparison of the project’s budget with
actual costs that had to be allocated for its
completion;
b) comparison of the budget of the project’s
stages with actual costs that had to be
allocated for their completion;
c) comparison of the planned completion time
of the project with the actual time that was
needed to complete it;
d) comparison of the planned execution time of
subsequent stages with the actual time that
was needed to complete them;
e) comparison of the list of sources of
uncertainty identified before the start of
project with those that have been identified
during the subsequent stages;
f) specification of the received summary list of
uncertainties, which resulted with
materialized risk during project’s
completion;
g) comparison of the list of risks identified
before the start of the project and at each of
the stages, with those that have been
identified during the completion of the
project;
h) specification of the received summary list of
risks that have materialized and note their
impact on the project in terms of cost and
completion time;
i) comparing the list of success factors of the
project, which should be provided during its
completion (and at each of the individual
stages) with a list of success factors, which
are guaranteed in the completion of tasks;
j) to determinate which of other stakeholders
involved in the project had positive, and
which ones had negative impact on its
completion;
k) to determinate which person was responsible
for the result of work performed on particular
stage, along with details which stage was
completed before planned time, which was
completed on time and which was delayed;
l) to determine which person was responsible
for the result of work performed on the
particular stage, along with details which
stage exceeded the budget, which took the
assumed costs and which was carried out
cheaper than it was expected;
m)
to determine which person/functional group
performed work at each stages, along with
details which stage was completed before
time, which was completed on time and
which was delayed;
n) which person/functional groups performed
work at each stage, with details which stage
exceeded the budget, which took the assumed
costs and which was carried out cheaper than
expected.
2) Determination of completion indicators,
separately for each of the projects/stages:
a) The index of the financial viability of the
project’s completion/stage:
=
· 100%
(1)
where:
– the actual cost of the phase/project;
– the planned cost of the phase/project.
b) The index of the time efficiency of the
project’s completion/stage:
=
· 100%
(2)
where:
– the actual duration of the project/phase;
– planned duration of the project/phase.
c) The efficiency indicator of identification
sources of uncertainty of the project/stage:
=
+
+
· 100%
(3)
where:
– the number of types of sources of
uncertainty identified before the project/stage
started, which have also been identified during
its completion;
Development of an Innovative Methodology Supporting Project Risk Management in the Manufacturing Company of the Automotive
Industry
267

– the number of types of sources of
uncertainty identified before the project/stage
started, which were not identified during its
completion;
– the number of types of sources of
uncertainty not identified before the
project/stage started, which were identified
during its completion.
d) The efficiency indicator of identification
of sources of uncertainty leading to the
materialization of risks:
=
+
+
· 100%
(4)
where:
– the number of types of sources of
uncertainty identified before the project/stage
started, which have also been identified during
its completion and led to the materialization of
risks;
– the number of types of sources of
uncertainty identified before the project/stage
started, which have also been identified during
its completion;
– the number of types of sources of
uncertainty identified before the project/stage
started, which were not identified during its
completion;
– the number of types of sources of
uncertainty not identified before the
project/stage started, which were identified
during its completion.
e) The efficiency indicator of ensuring of the
factors’ success of the project/stage:
=
· 100%
(5)
where:
– the number of success’ factors of the
project/stage provided during its completion;
– the number of success’ factors of the
project/stage, which should have been provided
during completion.
f) The indicator of financial efficiency of the
person responsible for the result of the
work carried out within the project/stage:
=
−
· 100%
(6)
where:
– the planned cost of the project/stage;
– the actual cost of the project/stage.
g) The indicator of time efficiency of the
person responsible for the result of the
work carried out within the project/stage:
=
−
· 100%
(7)
where:
– the planned duration of the project/stage;
– the actual duration of the project/stage.
h) The indicator of financial efficiency of the
person/functional group responsible for the
work carried out within the project/stage:
=
−
· 100%
(8)
where:
– the planned cost of the project/stage;
– the actual cost of the project/stage.
i) The indicator of time efficiency of the
person/functional group responsible for the
work carried out within the project/stage:
=
−
· 100%
(9)
where:
– the planned duration of the project/stage;
– the actual duration of the project/stage.
j) The indicator of efficiency of risk
identification of the project/stage:
=
+
+
· 100%
(10)
where:
– the number of the types of risks identified
before the project /stage started, which have also
been identified during its completion;
– the number of the types of risks identified
before the project/stage started, which were not
identified during its completion;
– the number of types of risks not
identified before the project/stage started, that
were identified during its completion.
k) The indicator of efficiency of
identification of materialized risks in the
project/stage:
=
+
+
· 100%
(11)
where:
– the number of types of risks identified
before the project/stage started, which were also
identified during its completion, and which were
materialized;
ICORES 2017 - 6th International Conference on Operations Research and Enterprise Systems
268
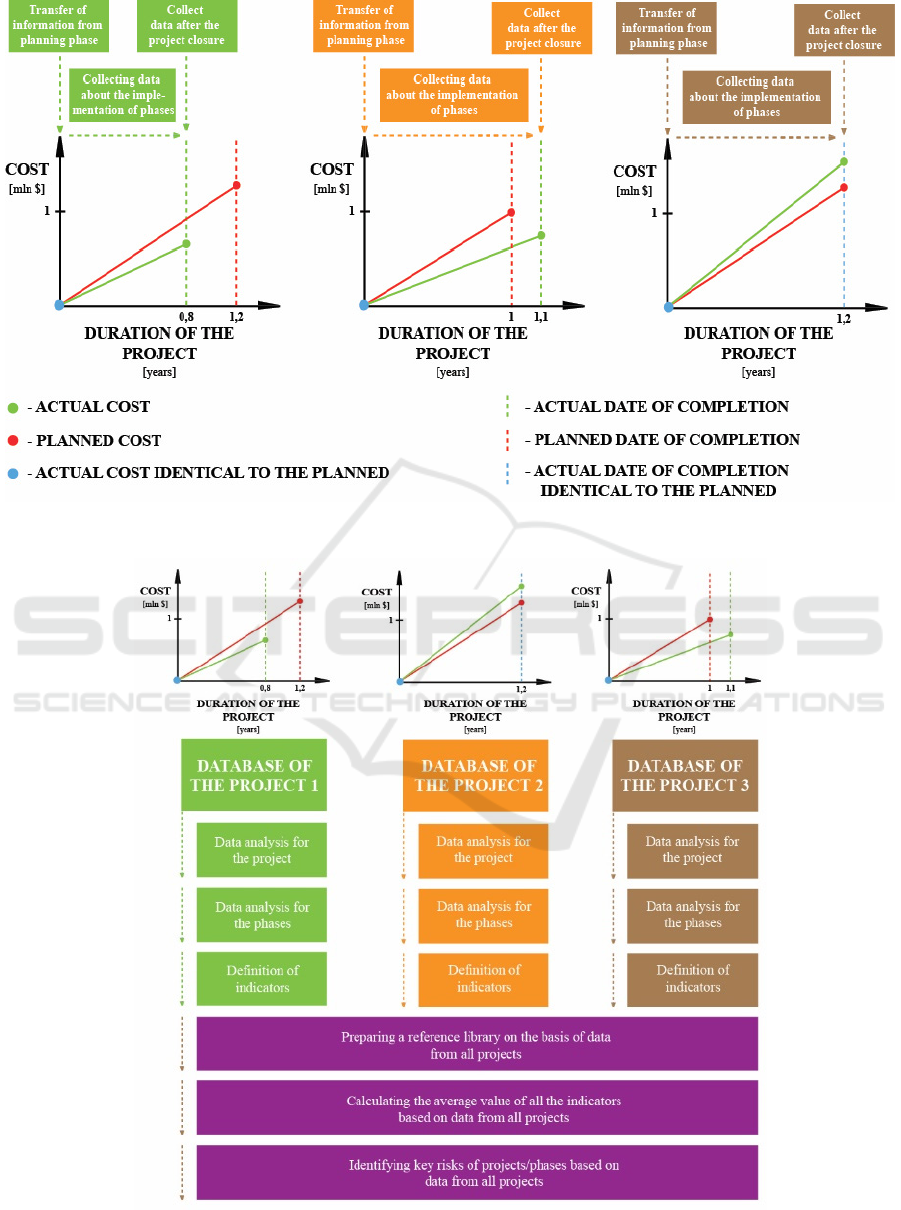
Figure 1: Main stages of the developed methodology (phase of data collection).
Figure 2: Main stages of the developed methodology (phase of data analysis).
Development of an Innovative Methodology Supporting Project Risk Management in the Manufacturing Company of the Automotive
Industry
269
– the number of the types of risks identified
before the project/stage started, which have also
been identified during its completion;
– the number of the types of risks identified
before the project/stage started, which were not
identified during its completion;
– the number of types of risks not
identified before the project/stage started, which
were identified during its completion.
3) Preparation of the reference library by
comparing of the corresponding data from all
projects, so that in the future it would be
possible to further analyze the available data
and to have a direct insight into its features.
4) The calculation of the average value of the each
of indicators of project/stages of completion
based on the values determined through the
completion in point 2.
5) Identifying key risks of projects/stages:
a) calculating the probability of occurrence of
each of the risks, based on the data;
b) determination of the level of severity for
each of the risks, keeping the
differentiation on the degree of financial
risk and the degree of time of the risk, in
sequence according to the following
formulas:
=|
∙
|
(12)
where:
– the probability of risk;
– the average financial impact (loss/gain
caused by the risk);
=|
∙
|
(13)
where:
– the probability of risk;
– medium time impact (shortening the
time/delay caused by the risk).
c) the risk categorization of particular phases
– selection of appropriate limit values
should be made on the basis of
information, experience of the project
manager and the nature of the
implemented project. For the purposes of
this paper categories were determined
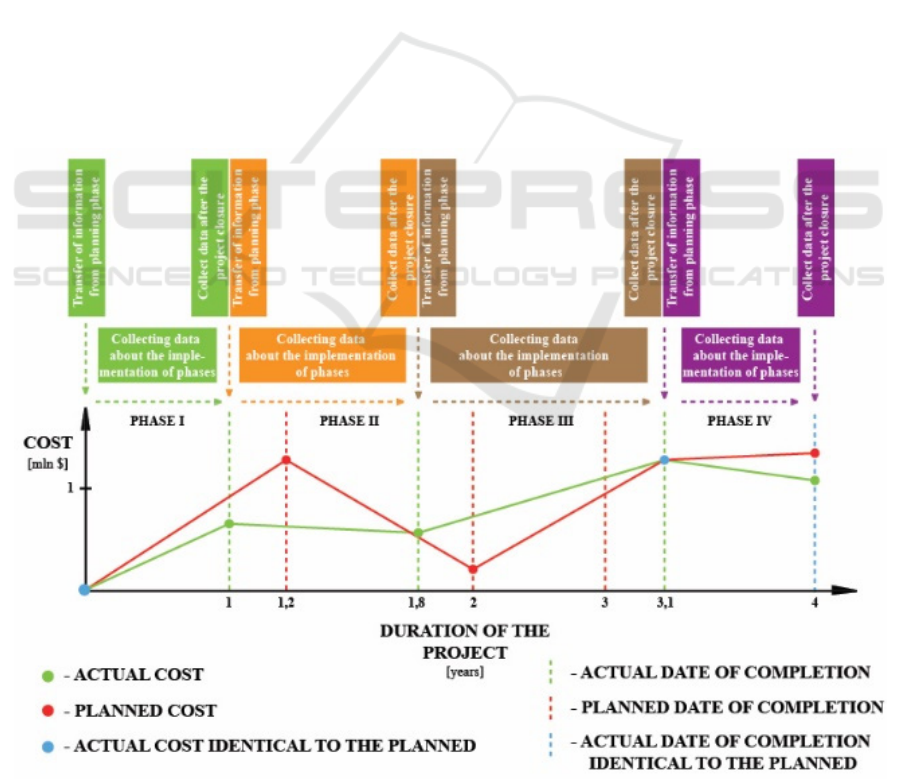
Figure 3: Phase of collect data on the implementation phases of the project.
ICORES 2017 - 6th International Conference on Operations Research and Enterprise Systems
270

according to the following criteria:
low risk – the value of the degree of risk
from 0 to 0.15;
moderate risk – the value of 0.16 to 0.37;
high risk – the value of 0.38 to 0.75;
critical risk – the value of 0.76 and above.
Implementation of the described methodology is
shown in the example below: Figure 1 (own
elaboration based on: Żmuda, 2016). shows the steps
of data collection in a situation where the company
has completed three projects.
In situation where data were collected for the
three projects, the analysis phase can occur, as it is
schematically presented below in Figure 2 (own
elaboration based on: Żmuda, 2016).
Both the collection and analysis of data for each
of particular phases is carried out similarly to
carrying out these activities for the project, the idea
is presented Figure 3 (own elaboration based on:
Żmuda, 2016).
4 CONCLUSIONS
In the presented paper it has been developed a
methodology for collecting data on completed
projects to allow their subsequent analysis, and also
a methodology of data analysis to identify the key
risks of projects and to provide a valuable
information. Using the developed methodology, in
the future it is planned to create a tool to support the
completion of projects in the form of a spreadsheet.
While continuing work on the field tackled in this
paper, it is recommended to implement the
developed methodology for the data collection and
analysis into a computer application.
While using the developed methodology it
should be borne in mind that phenomena such as risk
and uncertainty are often very dynamic and they
have interdisciplinary nature, thus the degree of
repeatability can vary depending on the nature and
level of innovation and uniqueness of the delivered
project (Gembalska-Kwiecień, 2016). Therefore,
using solutions developed from this paper it should
be taken into account that it is intended to only assist
the decision making process of project manager. It
means that in terms of risk management the project
manager should in the first place follow the logic,
experience gained in the industry and his own
assessment of the situation.
ACKNOWLEDGEMENTS
The article is the result of the registered work with
symbol 13/030/BK_16/0024 entitled "Production
engineering methods and tools for development of
smart specializations" carried out in the Institute of
the Production Engineering, Department of
Organization and Management at Silesian University
of Technology.
REFERENCES
Project Management Institute, 2012. A Guide to the
Project Management Body of Knowledge (PMBOK
Guide). USA, 5
th
edition.
Atkinson, R., 1999. Project management: cost, time and
quality, two best guesses and a phenomenon, it’s time
to accept other success criteria. “International Journal
of Project Management”, vol. 17, no. 6, pp. 337-342.
Gembalska-Kwiecień, A., 2016. Innovative forms
supporting safe methods of work in safety engineering
for the development of intelligent specializations.
“Management Systems in Production Engineering”,
vol. 24 no. 4, pp. 268-273.
Gardiner, P.D., Stewart, K., 2000. Revisiting the golden
triangle of cost, time and quality: the role of NPV in
project control, success and failure. “International
Journal of Project Management”, vol. 18, pp. 251-256.
Dvir, D., Raz, T., Shenhar, A., 2003. An empirical
analysis of the relationship between project planning
and project success. “International Journal of Project
Management”, vol. 21, pp. 89-95.
Hand, D., Mannila, H., Smyth, P., 2006. Eksploracja
danych, Wydawnictwo Naukowo-Techniczne.
Warszawa.
Jaafari, A., 2001. Management of risks, uncertainties and
opportunities on projects: time for a fundamental shift.
“International Journal of Project Management”, vol.
19, pp. 89-101.
Korczowski, A., 2010. Zarządzanie ryzykiem w projektach
informatycznych. Teoria i praktyka, Wydawnictwo
Helion. Gliwice.
Office of Government Commerce, 2010. PRINCE2™ –
Skuteczne zarządzanie projektami, The Stationery
Office. London.
Larose, D., 2006. Odkrywanie wiedzy z danych,
Wydawnictwo Naukowe PWN. Warszawa.
Pickett, T., Elliot, B., 2007. Transforming Historical
Project Data into Useful Information, AACE
International Transactions. Morgantown.
Pritchard, C., 2002. Zarządzanie ryzykiem w projektach.
Teoria i praktyka, WIG PRESS. Warszawa.
Żmuda, K., 2016. Opracowanie narzędzia
wspomagającego zarządzanie ryzykiem podczas
realizacji projektów w przedsiębiorstwie
produkcyjnym branży motoryzacyjnej (unpublished
MA thesis), Wydział Organizacji i Zarządzania,
Politechnika Śląska. Zabrze.
Development of an Innovative Methodology Supporting Project Risk Management in the Manufacturing Company of the Automotive
Industry
271
