
A High Resolution Optical Satellite Image Dataset for Ship Recognition
and Some New Baselines
Zikun Liu
1,2
, Liu Yuan
3
, Lubin Weng
1
and Yiping Yang
1
1
Institute of Automation Chinese Academy of Sciences, 95 Zhongguancun East Road, 100190, Beijing, China
2
University of Chinese Academy of Sciences, 80 Zhongguancun East Road, 100190, Beijing, China
3
China Academy of Electronics and Information Technology, 11 Shuanyuan Road, 100041, Beijing, China
{liuzikun2012, lubin.weng, yiping.yang}@ia.ac.cn, lyuan@csdslab.net
Keywords:
High Resolution Optical Remote Sensing Image, Sea-land Segmentation, Ship Detection, Ship Recognition,
Dataset.
Abstract:
Ship recognition in high-resolution optical satellite images is an important task. However, it is difficult to
recognize ships under complex backgrounds, which is the main bottleneck for ship recognition and needs
to be further explored and researched. As far as we know, there is no public remote sensing ship dataset
and few open source work. To facilitate future ship recognition related research, in this paper, we present a
public high-resolution ship dataset, “HRSC2016”, that covers not only bounding-box labeling way, but also
rotated bounding box way with three-level classes including ship, ship category and ship types. We also
provide the ship head position for all the ships with “V” shape heads and the segmentation mask for ev-
ery image in “Test set”. Besides, we volunteer a ship annotation tool and some development tools. Given
these rich annotations we perform a detailed analysis of some state-of-the-art methods, introduce a novel
metric, the separation fitness (SF), that is used for evaluating the performance of the sea-land segmenta-
tion task and we also build some new baselines for recognition. The latest dataset can be downloaded from
“http://www.escience.cn/people/liuzikun/DataSet.html”.
1 INTRODUCTION
In the past decade, many countries have launched
more and more satellites. We have entered an era of
big data in remote sensing domain (Liu, 2015). We
can now easily collect massive high-resolution remote
sensing imageries.
With the progress of image’s resolution and a rich
supply of data, ship recognition from remote sens-
ing imagery is becoming more and more important.
There are a wide array of ship recognition related
applications including fishery management, smug-
gling activities, vessel traffic services and naval war-
fare (Proia and Page, 2010; Zhu et al., 2010). Espe-
cially, due to political interest in security, maritime
and docks surveillance has been highly prized. Ship
monitoring by the way of remote sensing has some
advantages such as a long operating distance and a
wide monitoring range (Proia and Page, 2010).
Synthetic aperture radar (SAR) image data is the
main data source for ship recognition and the opti-
cal remote sensing image is the helpful complement
which is becoming more and more important, espe-
cially for ship recognition and accurate ship location .
Many existing ship detection related works are based
on SAR images, because SAR can work on day and
night and can also resist interferences from clouds or
some other factors. However, with the long term de-
velopment of the optical remote sensing technique,
the optical imagery can provide more details that is
very important to be used to locate ships precisely
and recognize ship types. At the same time, compared
with SAR images, the interpretation results of optical
images have also made information more intuitive to
a human decision maker.
Most of the existing works are based on private
dataset. The data sources include SPOT-5 (Corbane
and Petit, 2008; Corbane et al., 2010; Proia and
Page, 2010; Yang et al., 2014; Tang et al., 2015),
WorldView-2 (Yokoya and Iwasaki, 2015), Quick-
bird (Liu et al., 2014), Venezuelan Remote Sensing
Satellite (VRSS-1) (Zou and Shi, 2016), GaoFen-
1 (GF-1) (Qi et al., 2015; Zou and Shi, 2016) and
Google Earth (Guo et al., 2014; Shi et al., 2014;
Xu et al., 2014; Yang et al., 2014; Qi et al., 2015;
Yu et al., 2015; Zhang et al., 2016; Zou and Shi,
324
Liu, Z., Yuan, L., Weng, L. and Yang, Y.
A High Resolution Optical Satellite Image Dataset for Ship Recognition and Some New Baselines.
DOI: 10.5220/0006120603240331
In Proceedings of the 6th International Conference on Pattern Recognition Applications and Methods (ICPRAM 2017), pages 324-331
ISBN: 978-989-758-222-6
Copyright
c
2017 by SCITEPRESS – Science and Technology Publications, Lda. All rights reserved
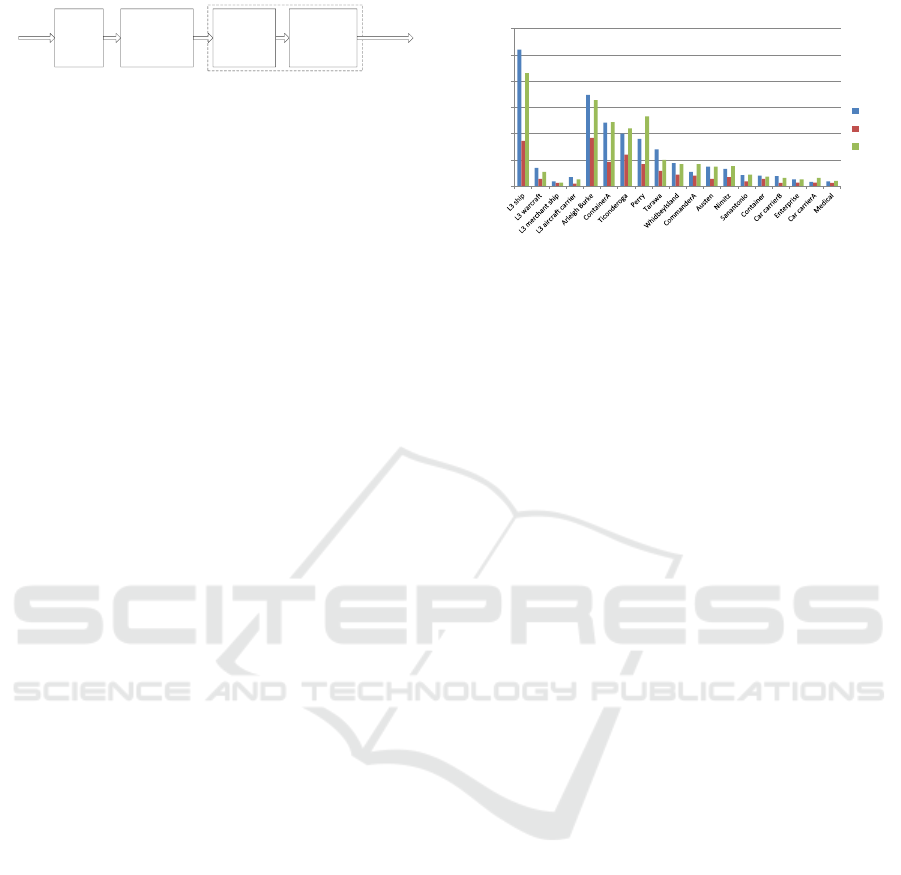
Images
Candidates
Dividing
into
blocks
Sea-land
segmentation
Candidate
generation
Ship
classification
Figure 1: The four stages of ship recognition.
2016). The space resolution of the data from these
data sources are about 5-m, 0.5-m, 0.61-m, 2.5-m,
2-m and 5m-0.4m respectively. Because of contain-
ing sensing data or copyrights, many private ship
datasets are difficult to be publicly available. Yang
et al. (Yang and Newsam, 2010) introduced a public
dataset “LULC”, which contains some overhead ship
images collected from the United States Geological
Survey National Map. However, “LULC” is used for
land-use classification. High-resolution overhead im-
ageries from Google Earth, which are publicly avail-
able for academic research, are collected by Landsat-
7, QuickBird, IKONOS and SPOT-5, etc. Now, we
plan to further build an open project for ship recogni-
tion based on images from Google Earth, which can
be seen on our website. As far as we know, our dataset
is the first unconcealed ground truth collection for
ship recognition derived from publicly available high-
resolution overhead imagery. Liu et al. (Liu et al.,
2016) had done some experiments on our dataset.
Experiments on ship images derived from Google
Earth are important references to practical appli-
cations with optical data directly collected from
space-borne devices. Besides many existing works
only based on images from Google Earth, some
researchers performed experiments on both Google
Earth images and the ones directly derived from
satellites. For example, Zou et al. (Zou and Shi,
2016) used images from different data sources includ-
ing Google Earth to train their SVD Networks and
got much better classification performance by adding
Google samples. Han et al. (Han et al., 2015) com-
pared different methods on Google dataset and other
datasets and gained similar performance differences
between these methods.
Ship recognition can be divided into 4 stages
demonstrated in Figure. 1. In the first stage, a large
volume image is divided into small blocks laid to
overlap each other which will be computed indepen-
dently in the stages followed. However, this is not
an indispensable step if the computing resource is
not limited. The second stage is sea-land segmenta-
tion (You and Li, 2011; Liu et al., 2014; Tang et al.,
2015), that is designed to speed up computing and
help to extract ships. In the third stage, ship candi-
dates with a lot of false alarms are proposed. And
the fourth stage includes feature extraction, classifi-
cation and non-maximal suppression (NMS). Most of
the existing works covered both the third and fourth
0
50
100
150
200
250
300
L3 Class Number Distribution
train
val
test
Figure 2: The level 3 class number distribution.
stage (Liu et al., 2014; Yu et al., 2015; Zhang et al.,
2016; Zou and Shi, 2016). Liu et al. (Liu et al., 2016)
proposed a method of candidate generation only with
stage III. It is worth noting that Zou et al. (Zou and
Shi, 2016) performed ship candidate generation and
classification using one unified end-to-end training
model which will be the future tendency.
However, due to lack of public dataset, it is diffi-
cult to compare different methods directly. Especially
in sea-land segmentation task, the authors of exist-
ing works performed comparison on private dataset
by visual inspection. Furthermore, very few public
ship classification works explored ship type recogni-
tion which is an important task in naval warfare ap-
plication. In fact, sub-class recognition is not uncom-
mon in natural image domain (Yang et al., 2015).
The goal of our work is to promote the develop-
ment of optical remote sensing ship recognition. In
this paper, we build a standard public dataset with
four unique features for ship recognition task, provide
helping tools, analyze some state-of-the-art methods,
propose a metric to evaluate the performance of sea-
land segmentation and introduce a few new baselines.
2 HRSC2016
We call our dataset “High Resolution Ship Collection
2016” (HRSC2016). In section. 1, we have already
introduced the demand of building a public optical re-
mote sensing ship dataset and the important reference
value of images derived from Google Earth. In this
section, we describe the details of our dataset.
2.1 Dataset Setup
The HRSC2016 dataset contains images from two
scenarios including ships on sea and ships close in-
shore. All the images are collected from six famous
harbors. We not only collect the default images shown
by Google Earth, but also download the history im-
A High Resolution Optical Satellite Image Dataset for Ship Recognition and Some New Baselines
325
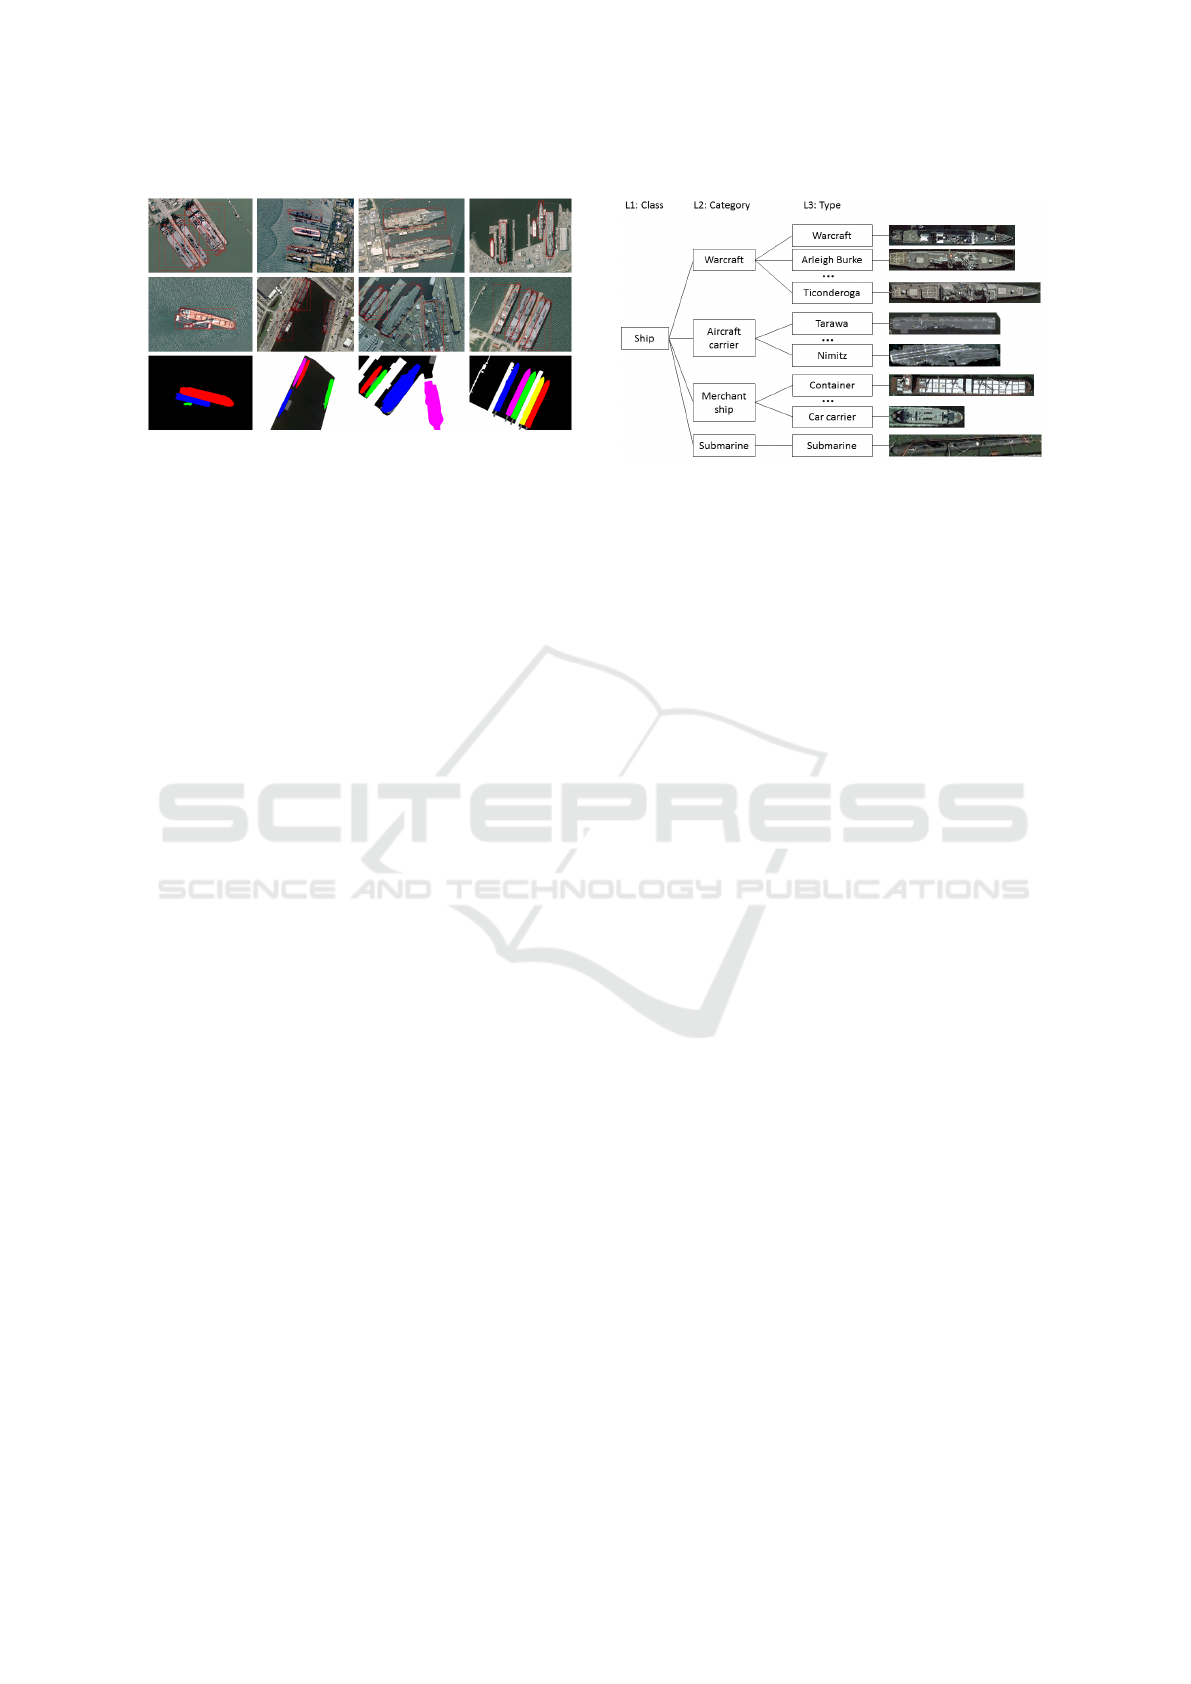
Figure 3: HRSC2016 samples. Training samples, test sam-
ples and segmentation masks are displayed in the first, sec-
ond and third rows respectively. Each sample in HRSC2016
is annotated with bounding box, rotated bounding box and
ship head location.
ages in the same place. The image resolutions are
between 2-m and 0.4-m. The image sizes range from
300×300 to 1500×900 and most of them are larger
than 1000×600.
In the process of collecting data, we recorded
the image information including harbor, data source,
image date, geographic coordinate, resolution layer,
scale, etc. It is worth noting that Google Earth’s ge-
ographic coordinate system may assign slightly dif-
ferent coordinates to the same location on the earth.
And we just recorded a near geographic coordinate
for each image.
We get 1061 images including 70 sea images with
90 samples and 991 sea-land images with 2886 sam-
ples. After adding annotations to these samples, we
split the dataset into training, validation and test set
which contains 436 images including 1207 samples,
181 images including 541 samples and 444 images
including 1228 samples respectively.
Most of the HRSC2016 dataset images are inshore
data. In order to satisfy the needs of the works for
ship detection on sea, we provide another 610 images
from Mumansk harbor, including 156 sea images and
454 sea-land images but without annotations. In the
future, we will further extend our dataset.
2.2 Properties of HRSC2016
The HRSC2016 dataset has four unique features in
comparison to existing private ship datasets, namely
ship hierarchy, an abundance of bounding informa-
tion, unbiasedness and rich helping tools.
2.2.1 Ship Hierarchy
In most of existing ship recognition related works,
the candidates were only categorized into background
or ship. Guo et al. (Guo et al., 2014) tried to di-
vide ships into six sub-classes. However, it is still
Figure 4: Ship model hierarchy. In the third level, ships
with unknown types are marked by level 2 class.
in a coarse-grained level. In HRSC2016 dataset, the
ship models are organized into a tree structure, con-
sisting of three levels, namely ship class, ship cate-
gory and ship type, as can be seen in Figure 4. In
level three, ships with unknown types (the ones out-
side HRSC2016 ship type table) are marked by level
2 label. In the ship recognition task, we should recog-
nize the right label in the tree as deeply as we possibly
can.
2.2.2 An Abundance of Bounding Information
Ships with various rotation angles in optical remote
sensing images are different from objects, most of
which are stand-alone, in natural pictures. Because
of bar-like objects, they are also different from other
classical objects in optical remote sensing images,
such as planes, cars, etc. It is not enough to only label
ships by bounding box commonly used. Many exist-
ing works based on bounding box (Tang et al., 2015;
Zou and Shi, 2016) are difficult to deal with ships in
a cluster, as can be seen in Figure 3. Gan et al. (Gan
et al., 2015) explored the rotation sliding box for ship
detection. Liu et al. (Liu et al., 2016) proposed ship
rotated bounding box space which is effective for ex-
tracting ships from complex backgrounds. In the fu-
ture, there is a tendency to detect ships by machine
learning methods based on rotated bounding box.
In HRSC2016 dataset, we provide three kinds of
bounding information, namely bounding box, rotated
bounding box and pixel-based segmentation, as can
be seen in Figure 3. However, currently, we only pro-
vide segmentation masks for test set to evaluate al-
gorithms. Furthermore, some existing methods (Liu
et al., 2014) detected ships by locating ship heads.
These part-detector based methods are very promis-
ing. In HRSC2016, we also provide ship head lo-
cation information for all the ships with “V” shape
heads.
ICPRAM 2017 - 6th International Conference on Pattern Recognition Applications and Methods
326
2.2.3 Unbiasedness
In the world, the number of samples per ship type
varies hugely. When we collected data, we down-
loaded the image with a random rotation angle if only
it contains any ship. So the distribution of ship num-
ber in HRSC2016 reflects the real distribution, as can
be seen in Figure 2. There are only 2976 samples for
more than 25 ship classes. Several ship types come
with only 1 to 20 samples in the dataset. Because of
this, our dataset looks like the dataset of “Right Whale
Recognition” for identifying endangered right whales
on Kaggle’s open data platform
1
. But our dataset
is more complicated because there are always many
ships in one image. It is not suitable to split all the
images directly into training-validation and test set.
In fact, we do this work using Algorithm 1 and get
good result seen in Section 2.1 and Figure 2. We get
training and validation set in the same way.
Algorithm 1: Splitting dataset algorithm.
Require:
The set of ship classes, C;
The set of ship samples, O;
The set of images, I;
Ensure:
The set of splitting result for each image in I;
1: Ordering C by “level” descending;
2: for each c ∈ C do
3: Finding samples (O
c
) belong to c;
4: for each o ∈ O
c
do
5: Getting the image (i) that o belongs to;
6: if i has been labeled then
7: continue;
8: end if
9: Getting a random number r between [0,1];
10: if r > 0.6 then
11: Labeling i as test image;
12: else
13: Labeling i as train-val image;
14: end if
15: end for
16: end for
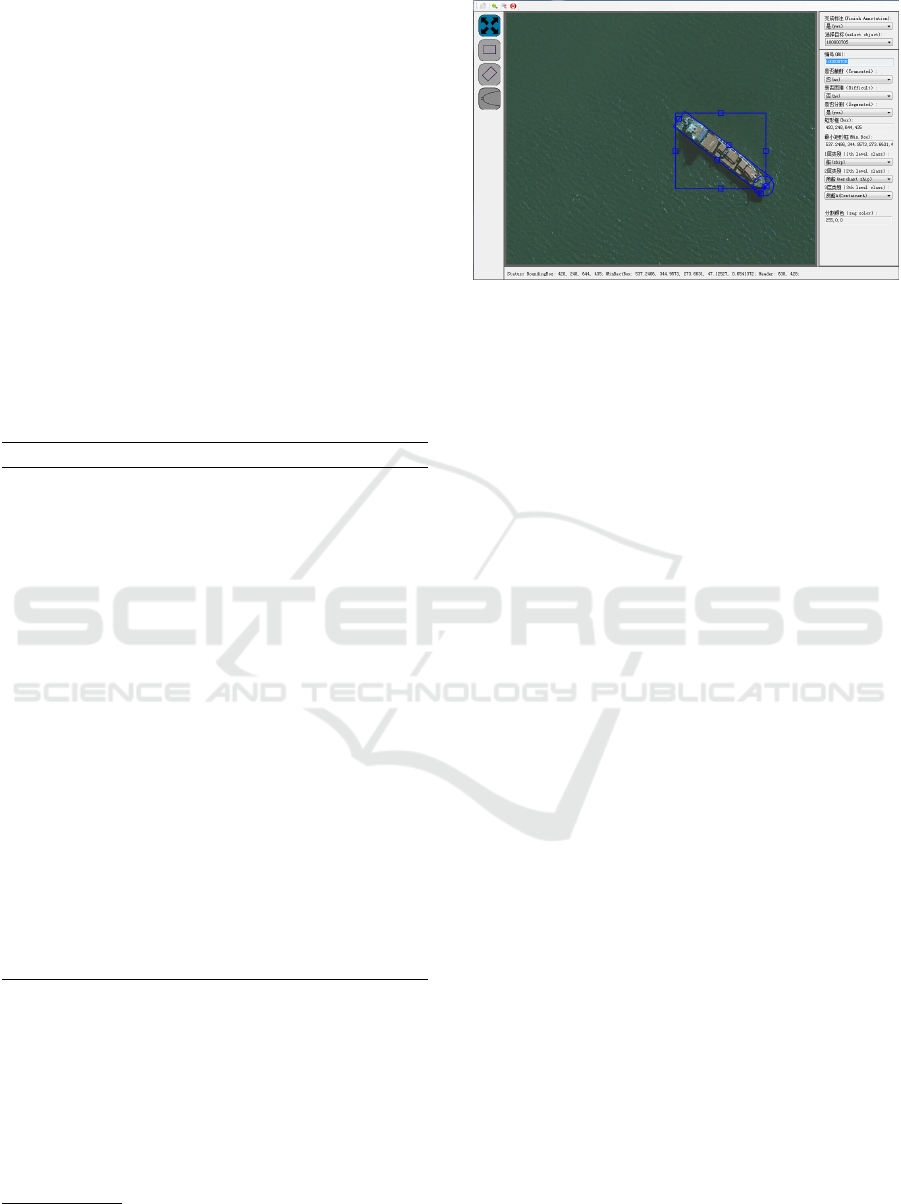
2.2.4 Rich Helping Tools
We provide a development toolkit including an an-
notation tool, a database tool and some development
tools. Currently, the annotation tool, shown in Fig-
ure. 5, only works in local host. In fact, the annota-
tion work for ships needs professional knowledge. It
is difficult for us to recognize all kinds of ship types in
1
The URL https://www.kaggle.com/c/noaa-right-whale-
recognition
Figure 5: The annotation tool.
HRSC2016. The cost of finding an expert is too high
to us. Inspired by Van Horn et al. (Van Horn et al.,
2015), we plan to seek help from citizen scientist ex-
perts to expand the size of the dataset. In the future,
we need to develop a web-based annotation tool to
support collaboration with citizen scientist experts.
3 BASELINES ANALYSIS
In Section 1, we have introduced the four stages of
ship detection, namely dividing an image into blocks,
sea-land segmentation, candidate generation and ship
classification. Dividing an image into blocks is nec-
essary for space-based system. However, we assume
that images in HRSC2016 dataset are blocks from
large volume images. In the future, we will pro-
vide some large volume images to evaluate comput-
ing time for algorithms. In this section, we analyze
other three stages on HRSC2016 dataset.
3.1 Sea-land Segmentation
Sea-land segmentation for ship detection can be di-
vided into two stages including sea separation and
land separation. In sea separation task, sea regions
are separated from land and ship foregrounds by fast
segmentation methods (You and Li, 2011; Liu et al.,
2014; Tang et al., 2015). In land separation task, land
regions are always masked by the land masks gener-
ated by geographic information (Zou and Shi, 2016)
or removed by region classification methods (Tang
et al., 2015) which is also called false alarm remov-
ing. However, HRSC2016 does not support evalu-
ating land separation methods based on public geo-
graphic information because of Google Earth’s geo-
graphic coordinate shift. In this section, we mainly
focus on evaluating sea separation task also called
sea-land segmentation in many works.
A High Resolution Optical Satellite Image Dataset for Ship Recognition and Some New Baselines
327
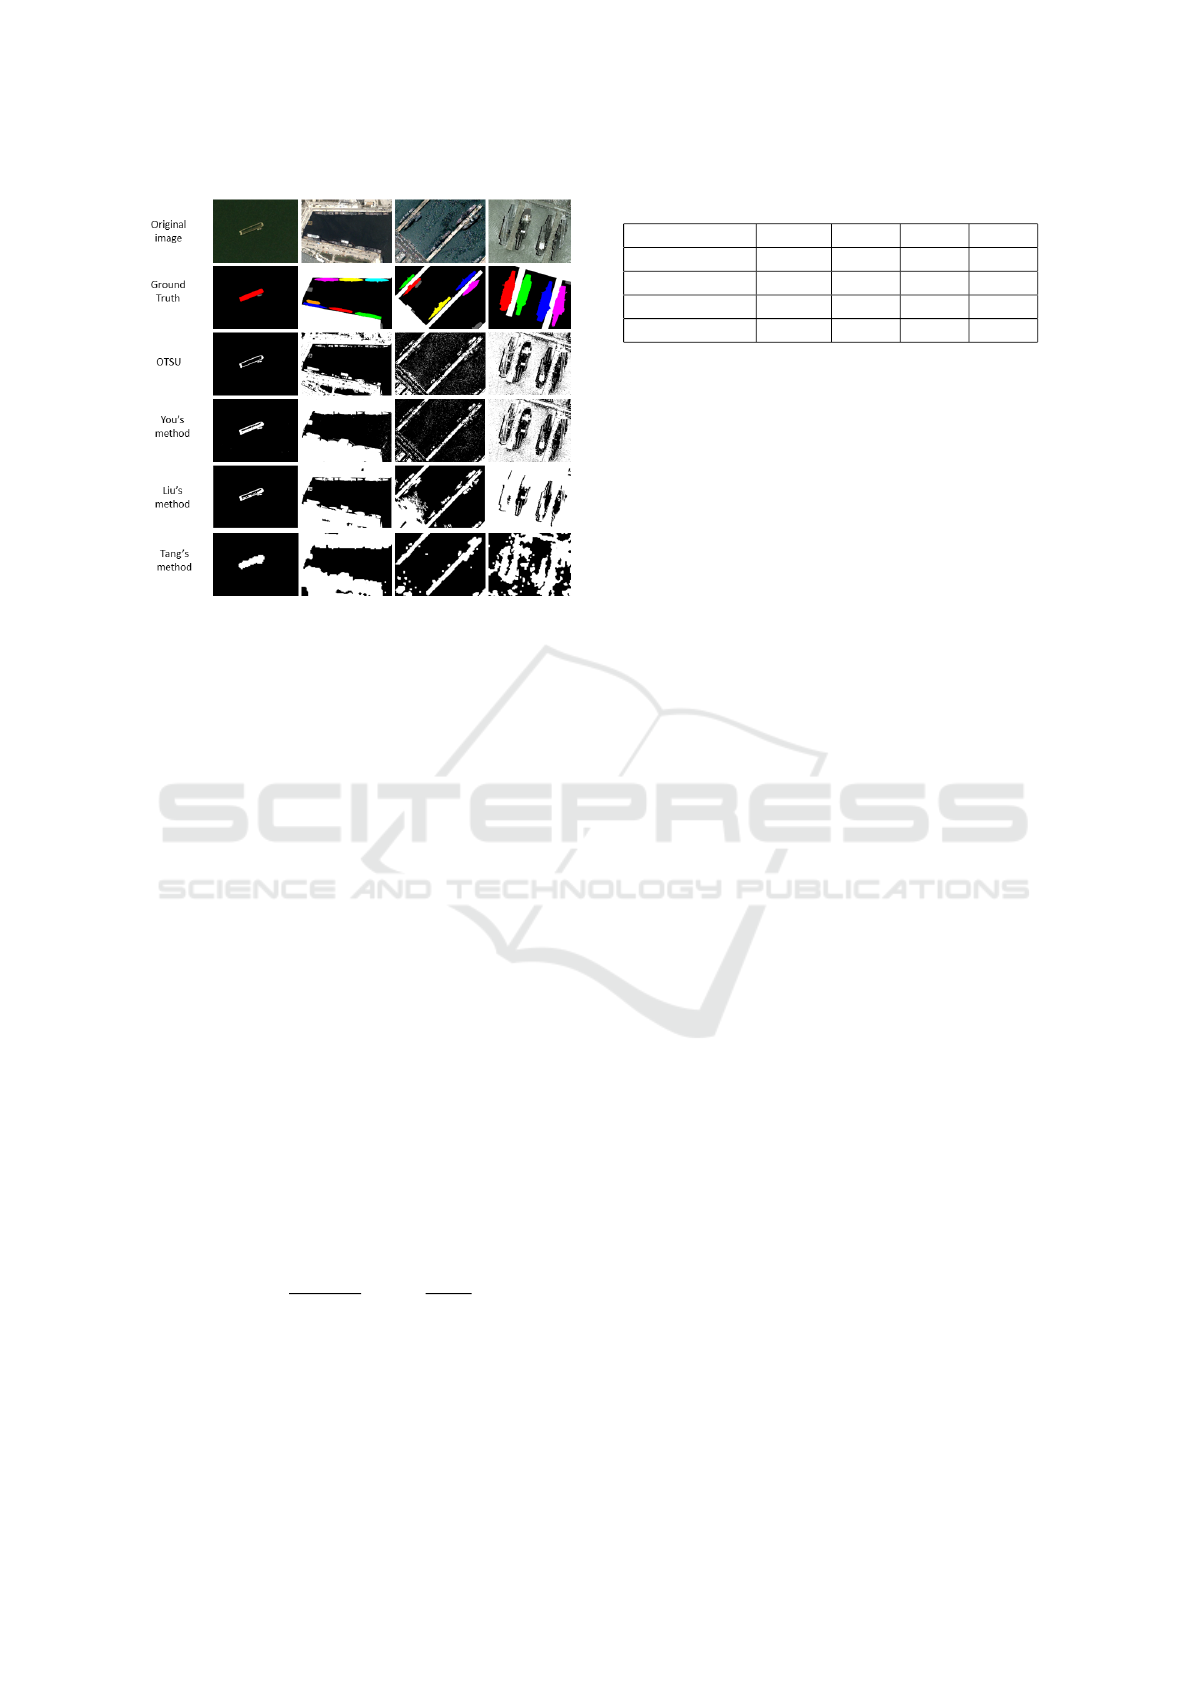
Figure 6: Samples of the sea-land segmentation results.
The authors of existing sea-land segmentation re-
lated works evaluated experimental performance by
visual inspection which is subjective and coarse-
grained. We need to design an evaluation criterion
used for quantitative analysis.
The sea-land segmentation plays two roles in ship
detection task. On the one hand, it can improve
the computational efficiency by quickly removing the
large sea regions to avoid computation. On the other
hand, it can help to extract ships on sea. However, you
should try your best to keep ship regions from being
destroyed while removing sea regions. This requires
the new evaluation criterion not only can evaluate the
accuracy of sea separation, but also can measure the
integrity of ships reserved.
We propose a metric called separation fitness (SF)
to measure the performance of sea-land segmenta-
tion. We introduce the typically intersection over
union (IoU) criterion to evaluate the accuracy of sea
segmentation. Here IoU is used to compute the in-
tersection of the candidate sea regions segmented and
the ground truth sea regions divided by the area of
their union. IoU value is between 0 and 1. We intro-
duce ship integrity to measure the intactness of ship
regions after segmentation. Then we define separa-
tion fitness as IoU multiplies ship integrity:
SF =
A(S
0
∩ S)
A(S
0
∪ S)
× (1 −
A(S
0
o
)
A(O)
) (1)
where A(.) is a function used to calculate the area,
S
0
is the candidate sea region segmented, S is the
ground truth sea region, O and S
0
o
are the ground truth
ship regions and the overlaps between the candidate
sea regions and the ground truth ship regions, respec-
Table 1: Evaluating baselines using separation fitness (SF).
OTSU You Liu Tang
Sea IoU 0.858 0.873 0.901 0.868
Ship integrity 0.656 0.839 0.828 0.944
SF 0.569 0.739 0.751 0.823
Avg Time (S) 0.023 0.447 0.317 0.026
tively. SF rewards both high accuracy and good ship
integrity.
We select three state-of-the-art methods including
You’s method (You and Li, 2011), Liu’s method (Liu
et al., 2014) and Tang’s method (Tang et al., 2015). In
addition, we also choose OTSU (Otsu, 1975) method,
that is often used as a comparison method, as one of
our baselines. The samples of the experimental results
can be seen in Figure 6 and the performance evalua-
tion can be seen in Table 1. We can see that Liu’s
method has the highest Sea IoU, but much lower ship
integrity than Tang’s method. Tang’s method has the
highest ship integrity, the best SF and very short av-
erage computation time per image. However, from
the last column in Figure 6, we can see that all these
methods are difficult to deal with clutter sea.
3.2 Ship Candidate Generation
The purpose of ship candidate (proposal) generation
is to locate ships. The ship candidates generated in
this stage contains a lot of false alarms which will
be further removed by strong classifiers followed.
The state-of-the-art ship candidate generation meth-
ods had been compared on our dataset by Liu et
al. (Liu et al., 2016) who proposed a method with the
best performance based on ship rotated bounding box
space (called SRBBS method for convenience). The
baselines of ship candidate generation include the fol-
lowing methods:
• SRBBS method (Liu et al., 2016);
• BING based on SRBBS (Liu et al., 2016);
• Liu’s method (Liu et al., 2014);
• Tang’s method (Tang et al., 2015).
In this paper, we do not discuss these methods any
more.
3.3 Ship Classification
In this section, we will build ship recognition base-
lines on the classification tasks of all the three lev-
els of HRSC2016. After ship candidate generation,
false alarms need to be further removed and the true
positives need to be properly classified. In Sec-
tion 1, we have introduced that most of the existing
ICPRAM 2017 - 6th International Conference on Pattern Recognition Applications and Methods
328
Table 2: The 9 variants’ mAP values in the level 1 task.
REG-BB REG-RBB REG-BOTH
NBEB 0.797 0.784 0.773
NREB 0.791 0.790 0.780
NRER 0.557 0.696 0.681
methods only classified candidates into two classes,
namely background and ship. Some methods iden-
tified ships by commonly Geometric features (Yang
et al., 2014; Tang et al., 2015), such as compactness,
Length-width ratio, etc. Shi et al. (Shi et al., 2014;
Qi et al., 2015) designed some new improved hand-
crafted features based on HOG (Dalal and Triggs,
2005) feature. Recently, automatically learned fea-
tures for ship detection based on Convolutional Neu-
ral Network(CNN) were used (Yu et al., 2015; Zou
and Shi, 2016; Zhang et al., 2016). And HOG (Dalal
and Triggs, 2005) combined with SVM is commonly
used as a comparison method. However, experiments
had shown that HOG has much weaker representative
ability than CNN feature which achieves great suc-
cesses in many computer vision problems. In order to
promote the improvement of ship recognition, CNN
features should be introduced into the ship recogni-
tion task as baselines.
The state of the art ship detection frameworks with
deep CNN models as backbones include R-CNN (Gir-
shick et al., 2014), Fast RCNN (Girshick, 2015) and
Faster RCNN (Ren et al., 2015), etc. R-CNN model
can be divided into two stages, namely region pro-
posal generation and CNN feature extraction followed
by classifiers that usually are Softmax Regression
classifiers or linear SVMs. However, It is inefficient
for R-CNN to perform feature extraction for each
region independently, because the magnitude of the
proposal number may be around 10
3
. Fast RCNN,
which is suitable for ship recognition, can greatly im-
prove the efficiency by sharing convolutional com-
putation before region of interest pooling (RoI pool-
ing). Instead of independent method for region pro-
posal generation, Faster RCNN generates candidate
regions by a Region Proposal Network(RPN) model.
The RPN together with an Object Detection Network
are trained for sharing convolutional layers for fast
computation. Faster RCNN has better performance
and higher efficiency than Fast RCNN. However, it is
inappropriate to introduce Faster RCNN directly into
ship detection, because the RPN is not strong enough
to deal with rotations and ship clusters. It will be fur-
ther researched in the future.
Based on Fast RCNN framework, we select
SRBBS method (Liu et al., 2016) as region proposal
generation method and the AlexNet (Krizhevsky
et al., 2012) as the backbone. In addition to the ex-
Table 3: The AP and mAP values of the two baselines in the
level 2 task.
ship air. war. mer. mAP
BL1 0.451 0.844 0.872 0.741 0.727
BL2 0.451 0.510 0.752 0.639 0.588
isting bounding box regression model (REG-BB), we
design another 2 different region regression models
for Fast RCNN, namely rotated bounding box regres-
sion model (REG-RBB) and bounding box together
with rotated bounding box regression model (REG-
BOTH). To regress rotated bounding box, we define
the regression loss for REG-RBB model as
L
loc
(t
u
,v) =
∑
i∈{x,y,w,h,a}
smooth
L
1
(t
u
i
− v
i
), (2)
smooth
L
1
(x) =
0.5x
2
i f |x| < 1
|x| − 0.5 other wise
, (3)
t
x
= (G
x
− P
x
)/(P
w
cosθ + P
h
sin|θ|), (4)
t
y
= (G
y
− P
y
)/(P
w
sin|θ| + P
h
cosθ), (5)
t
w
= log(G
w
/P
w
), (6)
t
h
= log(G
h
/P
h
), (7)
t
a
= (G
a
− P
a
)/(λ180), (8)
where u is the ground-truth class of a training RoI, v =
(v
x
,v
y
,v
w
,v
h
,v
a
) is the ground-truth rotated bound-
ing box regression target, t
u
= (t
u
x
,t
u
y
,t
u
w
,t
u
h
,t
u
a
) is a
predicted tuple, P = (P
x
,P
y
,P
w
,P
h
,P
a
) specifies the
pixel coordinates of the center of proposal P’s rotated
bounding box together with P’s width, height in pix-
els and rotation angle (between -90 and 90), θ is P
a
, G
is defined in the same way: G = (G
x
,G
y
,G
w
,G
h
,G
a
)
and λ is a constant number (λ = 0.5). For REG-
BOTH model, we design the loss function similar to
Equation (2), but with t
u
and v of 9 dimensions. In
the test mode, after NMS between bounding box can-
didates, the Fast RCNN evaluates performance us-
ing the criterion IoU, that candidates with IoU ≥ 0.5
are seen as true positive candidates, between a pro-
posal’s bounding box and the corresponding ground
truth’s bounding box. Besides this strategy (NBEB
for short), we add another two strategies includ-
ing evaluation by corresponding bounding box can-
didates after NMS on Rotated bounding box candi-
dates (NREB) and evaluation by rotated bounding box
candidates after NMS on them (NRER). By the com-
bination of these three evaluation strategies with the
three regression models, we get nine variants of Fast
RCNN shown in Table 2.
Thanks to the RBB candidates from SRBBS
method, we can get a series of corresponding pro-
posals with both RBB and BB (minimum bounding
rectangle of RBB) information. Benefiting from this,
A High Resolution Optical Satellite Image Dataset for Ship Recognition and Some New Baselines
329

Table 4: The two baselines’ AP values in the level 3 task. BL1’s and BL2’s mAP values are 0.608 and 0.452 respectively.
class BL1 BL2 class BL1 BL2 class BL1 BL2 class BL1 BL2
ship 0.463 0.419 air. 0.844 0.412 mer. 0.355 0.128 war. 0.078 0.039
Arl. 0.778 0.710 Aus. 0.569 0.432 Car.A 0.804 0.531 Car.B 0.831 0.678
Com.A 0.643 0.571 Con. 0.465 0.368 Con.A 0.675 0.496 Ent. 0.229 0.030
Med. 0.887 0.788 Nim. 0.642 0.446 Per. 0.632 0.439 San. 0.535 0.514
Tar. 0.771 0.509 Tic. 0.746 0.574 Whi. 0.599 0.509
we can also get both BB and RBB information for
predicted candidates without BB or RBB regression
information. In the classification experiments, we
exclude submarine, hovercraft classes and samples
with “difficult” label as Liu did in (Liu et al., 2016).
We use the same pre-trained network as Fast RCNN
method and select linear SVMs as classifiers. Using
the 9 variants, We perform level 1 task of HRSC2016.
The results are shown in Table 2. The IoU thresh-
olds of NBEB, NREB and NRER for NMS are em-
pirically set as 0.3,0.05 and 0.05 respectively. We
use criteria average precision (AP) and mean average
precision (mAP) (Girshick et al., 2014) to measure
the performances. We can see that performances of
variants with bounding box evaluation way are close.
But when we perform evaluation on RBB candidates,
the variants with the RBB regression model achieve
much better performance. The variants with REG-
BOTH model has close but lower mAP values than the
ones with REG-RBB model. We also find that vari-
ants with RBB evaluation way has much lower mAP
values than the ones with bounding box evaluation
way. However, RBB labeling way can provide more
accurate bounding information. In this paper, from
the nine variants, we select NBEB combined with
REG-BB method and NRER combined with REG-
RBB method as our baselines respectively called as
the following:
• SRBBS-Fast-RCNN (BL1);
• SRBBS-Fast-RCNN-R (BL2).
The two baseline methods also apply to the level
2 and level 3 tasks of HRSC2016. The experimen-
tal results are shown in Table 3 and Table 4. Due
to the reduction in the number of each class and the
shorter distances between classes, we got worse per-
formances on the level 2 and level 3 tasks. It can be
found that the finer the granularity of recognition, the
worse the performance is. It is worth noting that it
is a big challenge to recognize higher level classes,
such as ship, warcraft, etc, in level 3 task, because
distances between samples in a higher level class may
be much longer than distances between samples with
different classes.
4 CONCLUSIONS
In this paper, we wish to promote the field of ship
recognition by optical remote sensing images, which
is getting more and more attention. We introduced
a high resolution optical remote sensing dataset for
ship recognition, namely HRSC2016. To the best of
our knowledge, this is the first public remote sens-
ing dataset for ship recognition. We analyzed sev-
eral unique features of HRSC2016, including ship hi-
erarchy, an abundance of bounding information, un-
biasedness and rich helping tools, etc. We also per-
formed a detailed analysis of the state of the art meth-
ods on HRSC2016. For sea-land segmentation, we
introduced a novel metric SF to measure the perfor-
mance. For ship classification, we proposed some
new baselines based on deep CNN features and per-
formed them on the three level ship recognition tasks
of HRSC2016. There are still many challenges about
ship recognition including the problem about how
to recognize ships in a cluster, the problem of ship
recognition with small number of samples and the
problem about rotated RoI pooling, etc.
In the future, we will further extent HRSC2016
in the help of citizen scientist experts and build
more baselines, for example, the HOG feature com-
bined with SVMs, the SRBBS method combined with
RCNN model and variants of Faster-RCNN, etc.
ACKNOWLEDGEMENTS
This work was supported by the National Natural Sci-
ence Foundation of China under Grant 91338202.
REFERENCES
Corbane, C., Najman, L., Pecoul, E., Demagistri, L., and
Petit, M. (2010). A complete processing chain for ship
detection using optical satellite imagery. International
Journal of Remote Sensing, 31(22):5837–5854.
Corbane, C. and Petit, M. (2008). Fully automated proce-
dure for ship detection using optical satellite imagery.
ICPRAM 2017 - 6th International Conference on Pattern Recognition Applications and Methods
330

Proceedings of SPIE - The International Society for
Optical Engineering, 7150(10):2752–65.
Dalal, N. and Triggs, B. (2005). Histograms of oriented gra-
dients for human detection. In Proc. IEEE Int. Conf.
Comput. Vis. Pattern Recognit., volume 1, pages 886–
893. IEEE.
Gan, L., Liu, P., and Wang, L. (2015). Rotation sliding win-
dow of the hog feature in remote sensing images for
ship detection. In 2015 8th International Symposium
on Computational Intelligence and Design (ISCID),
volume 1, pages 401–404. IEEE.
Girshick, R. (2015). Fast r-cnn. In Proc. IEEE Int. Conf.
Comput. Vis., pages 1440–1448.
Girshick, R., Donahue, J., Darrell, T., and Malik, J. (2014).
Rich feature hierarchies for accurate object detection
and semantic segmentation. In Proc. IEEE Int. Conf.
Comput. Vis. Pattern Recognit., pages 580–587.
Guo, W., Xia, X., and Wang, X. (2014). A remote sensing
ship recognition method based on dynamic probability
generative model. Expert Systems with Applications,
41(14):6446–6458.
Han, J., Zhang, D., Cheng, G., Guo, L., and Ren, J. (2015).
Object detection in optical remote sensing images
based on weakly supervised learning and high-level
feature learning. IEEE Trans. Geosci. Remote Sens.,
53(6):3325–3337.
Krizhevsky, A., Sutskever, I., and Hinton, G. E. (2012). Im-
agenet classification with deep convolutional neural
networks. In Advances in neural information process-
ing systems, pages 1097–1105.
Liu, G., Zhang, Y., Zheng, X., Sun, X., Fu, K., and Wang,
H. (2014). A new method on inshore ship detection in
high-resolution satellite images using shape and con-
text information. IEEE Geosci. Remote Sens. Lett.,
11(3):617–621.
Liu, P. (2015). A survey of remote-sensing big data. Fron-
tiers in Environmental Science, 3:45.
Liu, Z., Wang, H., Weng, L., and Yang, Y. (2016). Ship
rotated bounding box space for ship extraction from
high-resolution optical satellite images with com-
plex backgrounds. IEEE Geosci. Remote Sens. Lett.,
13(8):1074–1078.
Otsu, N. (1975). A threshold selection method from gray-
level histograms. Automatica, 11(285-296):23–27.
Proia, N. and Page, V. (2010). Characterization of a
bayesian ship detection method in optical satellite im-
ages. IEEE Geosci. Remote Sens. Lett., 7(2):226–230.
Qi, S., Ma, J., Lin, J., and Li, Y. (2015). Unsupervised ship
detection based on saliency and s-hog descriptor from
optical satellite images. IEEE Geosci. Remote Sens.
Lett., 12(7):1–5.
Ren, S., He, K., Girshick, R., and Sun, J. (2015). Faster
r-cnn: Towards real-time object detection with region
proposal networks. In Advances in neural information
processing systems, pages 91–99.
Shi, Z., Yu, X., Jiang, Z., and Li, B. (2014). Ship detection
in high-resolution optical imagery based on anomaly
detector and local shape feature. IEEE Trans. Geosci.
Remote Sens., 52(8):4511–4523.
Tang, J., Deng, C., Huang, G. B., and Zhao, B. (2015).
Compressed-domain ship detection on spaceborne op-
tical image using deep neural network and extreme
learning machine. IEEE Trans. Geosci. Remote Sens.,
53(3):1174–1185.
Van Horn, G., Branson, S., Farrell, R., Haber, S., Barry,
J., Ipeirotis, P., Perona, P., and Belongie, S. (2015).
Building a bird recognition app and large scale dataset
with citizen scientists: The fine print in fine-grained
dataset collection. In Proc. IEEE Int. Conf. Comput.
Vis. Pattern Recognit., pages 595–604.
Xu, J., Sun, X., Zhang, D., and Fu, K. (2014). Auto-
matic detection of inshore ships in high-resolution re-
mote sensing images using robust invariant general-
ized hough transform. IEEE Geosci. Remote Sens.
Lett., 11(12):2070–2074.
Yang, G., Li, B., Ji, S., Gao, F., and Xu, Q. (2014). Ship
detection from optical satellite images based on sea
surface analysis. IEEE Geosci. Remote Sens. Lett.,
11(3):641–645.
Yang, L., Luo, P., Change Loy, C., and Tang, X. (2015). A
large-scale car dataset for fine-grained categorization
and verification. In Proc. IEEE Int. Conf. Comput. Vis.
Pattern Recognit., pages 3973–3981.
Yang, Y. and Newsam, S. (2010). Bag-of-visual-words and
spatial extensions for land-use classification. In Pro-
ceedings of the 18th SIGSPATIAL international con-
ference on advances in geographic information sys-
tems, pages 270–279. ACM.
Yokoya, N. and Iwasaki, A. (2015). Object detection based
on sparse representation and hough voting for opti-
cal remote sensing imagery. IEEE Journal of Selected
Topics in Applied Earth Observations & Remote Sens-
ing, 8(5):1–1.
You, X. and Li, W. (2011). A sea-land segmentation
scheme based on statistical model of sea. In Inter-
national Congress on Image and Signal Processing,
pages 1155–1159.
Yu, Y., Guan, H., and Ji, Z. (2015). Rotation-invariant
object detection in high-resolution satellite imagery
using superpixel-based deep hough forests. IEEE
Geosci. Remote Sens. Lett., 12(11):2183–2187.
Zhang, R., Yao, J., Zhang, K., Feng, C., and Zhang, J.
(2016). S-cnn ship detection from high-resolution re-
mote sensing images. ISPRS - International Archives
of the Photogrammetry, Remote Sensing and Spatial
Information Sciences.
Zhu, C., Zhou, H., Wang, R., and Guo, J. (2010). A novel
hierarchical method of ship detection from spaceborne
optical image based on shape and texture features.
IEEE Trans. Geosci. Remote Sens., 48(9):3446–3456.
Zou, Z. and Shi, Z. (2016). Ship detection in spaceborne
optical image with svd networks. IEEE Trans. Geosci.
Remote Sens., 54(10):5832–5845.
A High Resolution Optical Satellite Image Dataset for Ship Recognition and Some New Baselines
331
