
Visual-Interactive Similarity Search for Complex Objects
by Example of Soccer Player Analysis
J
¨
urgen Bernard
1
, Christian Ritter
1
, David Sessler
1
, Matthias Zeppelzauer
2
, J
¨
orn Kohlhammer
1,3
and Dieter Fellner
1,3
1
Technische Universit
¨
at Darmstadt, Darmstadt, Germany
2
St. P
¨
olten University of Applied Sciences, St. P
¨
olten, Austria
3
Fraunhofer Institute for Computer Graphics Research, IGD, Darmstadt, Germany
Keywords:
Information Visualization, Visual Analytics, Active Learning, Similarity Search, Similarity Learning,
Distance Measures, Feature Selection, Complex Data Objects, Soccer Player Analysis, Information Retrieval.
Abstract:
The definition of similarity is a key prerequisite when analyzing complex data types in data mining, informa-
tion retrieval, or machine learning. However, the meaningful definition is often hampered by the complexity
of data objects and particularly by different notions of subjective similarity latent in targeted user groups. Tak-
ing the example of soccer players, we present a visual-interactive system that learns users’ mental models of
similarity. In a visual-interactive interface, users are able to label pairs of soccer players with respect to their
subjective notion of similarity. Our proposed similarity model automatically learns the respective concept of
similarity using an active learning strategy. A visual-interactive retrieval technique is provided to validate the
model and to execute downstream retrieval tasks for soccer player analysis. The applicability of the approach
is demonstrated in different evaluation strategies, including usage scenarions and cross-validation tests.
1 INTRODUCTION
The way how similarity of data objects is defined and
represented in an analytical system has a decisive in-
fluence on the results of the algorithmic workflow for
downstream data analysis. From an algorithmic per-
spective the notion of object similarity is often imple-
mented with distance measures resembling an inverse
relation to similarity.
Many data mining approaches necessarily require
the definition of distance measures, e.g., for conduct-
ing clustering or dimension reduction. In the same
way, most information retrieval algorithms carry out
indexing and retrieval tasks based on distance mea-
sures. Finally, the performance of many supervised
and unsupervised machine learning methods depends
on meaningful definitions of object similarity. The
classical approach for the definition of object simi-
larity includes the identification, extraction, and se-
lection of relevant attributes (features), as well as the
definition of a distance measure and optionally a map-
ping from distance to similarity. Furthermore, many
real-world examples require additional steps in the al-
gorithmic pipeline such as data cleansing or normal-
ization. In practice, quality measures such as preci-
sion and recall are used to assess the quality of the
similarity models and the classifiers built upon them.
In this work, we strengthen the connection be-
tween the notion of similarity of individual users and
its adoption to the algorithmic definition of object
similarity. Taking the example of soccer players from
European soccer leagues, a manager may want to
identify previously unknown soccer players match-
ing a reference player, e.g., to occupy an important
position in the team lineup. This is contrasted by a
national coach who is also interested in selecting a
good team. However, the national coach is indepen-
dent from transfer fees and salaries while his choice
is limited to players of the respective nationality. The
example sheds light on various remaining problems
that many classical approaches are confronted with.
First, in many approaches designers do not know be-
forehand which definition of object similarity is most
meaningful. Second, many real-world approaches re-
quire multiple definitions of similarity for being us-
able for different users or user groups. Moreover, it
is not even determined that the notion of similarity
of single users remains constant. Third, the example
Bernard J., Ritter C., Sessler D., Zeppelzauer M., Kohlhammer J. and Fellner D.
Visual-Interactive Similarity Search for Complex Objects by Example of Soccer Player Analysis.
DOI: 10.5220/0006116400750087
In Proceedings of the 12th International Joint Conference on Computer Vision, Imaging and Computer Graphics Theory and Applications (VISIGRAPP 2017), pages 75-87
ISBN: 978-989-758-228-8
Copyright
c
2017 by SCITEPRESS – Science and Technology Publications, Lda. All rights reser ved
75
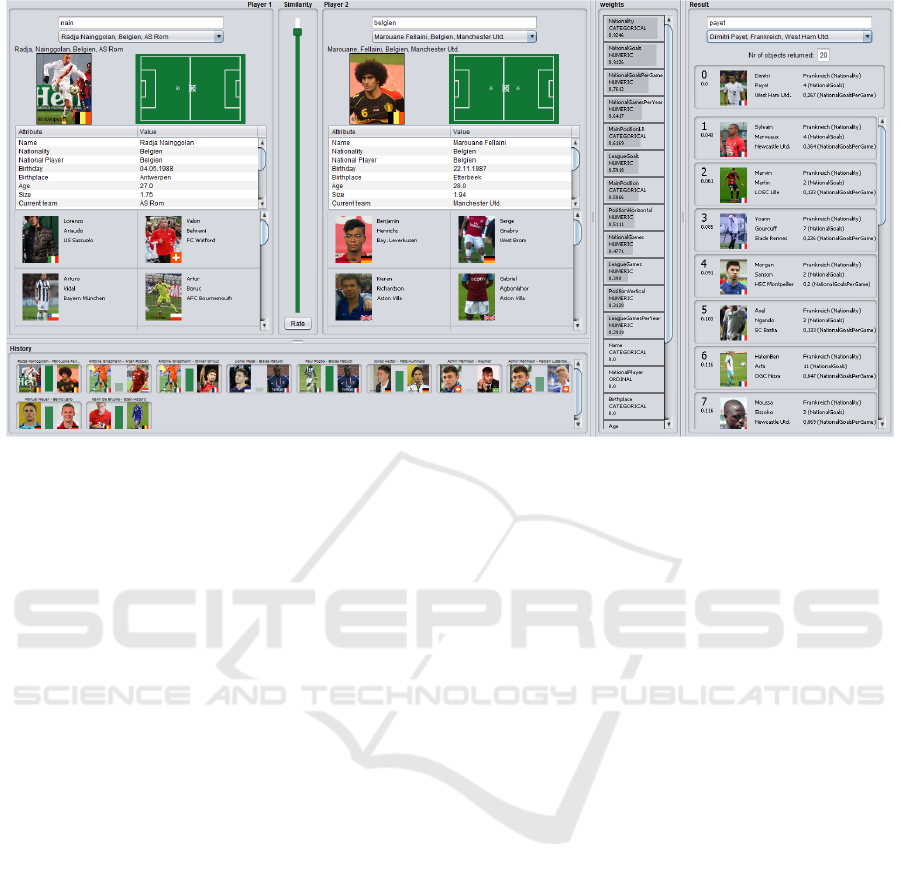
Figure 1: Overview of the visual-interactive tool. Left: users are enabled to label the similarity between two soccer players
(here: Radja Nainggolan and Marouane Fellaini, both from Belgium). The user’s notion of similarity is propagated to the
similarity learning model. Right: a visual search interface shows the model results (query: Dimitri Payet). The example
resembles the similarity notion typically for a national trainer: only players from the same country have very high similarity
scores. Subsequently, the nearest neighbors for Dimitri Payet are all coming from France and have a similar field position.
of soccer players implicitly indicates that definition
of similarity becomes considerably more difficult for
high-dimensional data. Finally, many real-word ob-
jects consist of mixed data, i.e. attributes of numeri-
cal, categorical, and binary type. However, most cur-
rent approaches for similarity measurement are lim-
ited to numerical attributes.
We hypothesize that it is desirable to shift the def-
inition of object similarity from an offline preprocess-
ing routine to an integral part of future analysis sys-
tems. In this way the individual notions of similarity
of different users will be reflected more comprehen-
sively. The precondition for the effectiveness of such
an approach is a means that enables users to commu-
nicate their notion of similarity to the system. Logi-
cally, such a system requires the functionality to grasp
and adopt the notion of similarity communicated by
the user. Provided that users are able to conduct var-
ious data analysis tasks relying on object similarity
in a more dynamic and individual manner. This re-
quirement shifts the definition of similarity towards
active learning approaches. Active learning is a re-
search field in the area of semi-supervised learning
where machine learning models are trained with as
few user feedback as possible, learning models that
are as generalizable as possible. Beyond classical ac-
tive learning, the research direction of this approach
is towards visual-interactive learning allowing users
to give feedback for those objects they have precise
knowledge about.
We present a visual-interactive learning system
that learns the similarity of complex data objects on
the basis of user feedback. The use case of soccer
players will serve as a relevant and intuitive example.
Overall this paper makes three primary contributions.
First, we present a visual-interactive interface that en-
ables users to select two soccer players and to submit
feedback regarding their subjective similarity. The set
of labeled pairs of players is depicted in a history vi-
sualization for lookup and reuse. Second, a machine
learning model accepts the pairwise notions of simi-
larity and learns a similarity model for the entire data
set. An active learning model identifies player ob-
jects where user feedback would be most beneficial
for the generalization of the learned model, and prop-
agates them to a visual-interactive interface. Third,
we present a visual-interactive retrieval interface en-
abling users to directly submit example soccer players
to query for nearest neighbors. The interface com-
bines both validation support as well as a downstream
application of model results. The results of differ-
ent types of evaluation techniques particularly assess
the efficiency of the approach. In many cases it takes
only five labeled pairs of players to learn a robust and
meaningful model.
The remaining paper is organized as follows. Sec-
tion 2 shows related work. We present our approach
in Section 3. The evaluation results are described in
Section 4, followed by a discussion in Section 5 and
the conclusion in Section 6.
IVAPP 2017 - International Conference on Information Visualization Theory and Applications
76

2 RELATED WORK
The contributions of this work are based on two core
building blocks, i.e., visual-interactive interfaces (in-
formation visualization, visual analytics) and algo-
rithmic similarity modeling (metric learning). We
provide a subsection of related work for both fields.
2.1 Visual-Interactive Instance Labeling
We focus on visual-interactive interfaces allowing
users to submit feedback about the underlying data
collection. In the terminology of the related work, a
data element is often referred to as an instance, the
feedback for an instance is called a label. Different
types of labels can be gathered to create some sort
of learning model. Before we survey existing ap-
proaches dealing with similarity in detail, we outline
inspiring techniques supporting other types of labels.
Some techniques for learning similarity metrics
are based on rules. The approach of (Fogarty et al.,
2008) allows users to create rules for ranking im-
ages based on their visual characteristics. The rules
are then used to improve a distance metric for image
retrieval and categorization. Another class of inter-
faces facilitates techniques related to interestingness
or relevance feedback strategies, e.g., to improve re-
trieval performance (Salton and Buckley, 1997). One
popular application field is evaluation, e.g,. to ask
users which of a set of image candidates is best,
with respect to a pre-defined quality criterion (Weber
et al., 2016). In the visual analytics domain, relevance
feedback and interestingness-based labeling has been
applied to learn users’ notions of interest, e.g., to
improve the data analysis process. Behrisch et al.
(Behrisch et al., 2014) present a technique for speci-
fying features of interest in multiple views of multidi-
mensional data. With the user distinguishing relevant
from irrelevant views, the system deduces the pre-
ferred views for further exploration. Seebacher et al.
(Seebacher et al., 2016) apply a relevance feedback
technique in the domain of patent retrieval, supporting
user-based labeling of relevance scores. Similar to our
approach, the authors visualize the weight of different
modalities (attributes/features). The weights are sub-
ject to change with respect to the iterative nature of
the learning approach. In the visual-interactive image
retrieval domain the Pixolution Web interface
1
com-
bines tag-based and example-based queries to adopt
users’ notions of interestingness. Recently the no-
tion of interestingness was adopted to prostate cancer
research. A visual-interactive user interface enables
1
Pixolution, http://demo.pixolution.de, last accessed on
September 22th, 2016
physicians to give feedback about the well-being sta-
tus of patients (Bernard et al., 2015b). The underly-
ing active-learning approach calculates the numerical
learning function by means of a regression tree.
Classification tasks require categorical labels for
the available instances. Ware et al. (Ware et al.,
2001) present a visual interface enabling users to
build classifiers in a visual-interactive way. The ap-
proach works well for few and well-known attributes,
but requires labeled data sets for learning classifiers.
Seifert and Granitzer’s (Seifert and Granitzer, 2010)
approach outlines user-based selection and labeling
of instances as meaningful extension of classical ac-
tive learning strategies (Settles, 2009). The authors
point towards the potential of combining active learn-
ing strategies with information visualization which
we adopt for both the representation of instances and
learned model results. H
¨
oferlin et al. (H
¨
oferlin
et al., 2012) define interactive learning as an exten-
sion, which includes the direct manipulation of the
classifier and the selection of instances. The applica-
tion focus is on building ad-hoc classifiers for visual
video analytics. Heimerl at al. (Heimerl et al., 2012)
propose an active learning approach for learning clas-
sifiers for text documents. Their approach includes
three user interfaces: basic active learning, visualiza-
tion of instances along the classifier boundary, and in-
teractive instance selection. Similar to our approach
the classification-based visual analytics tool by Janet-
zko et al. (Janetzko et al., 2014) also applies to the
soccer application domain. In contrast to our appli-
cation goal, the approach supports building classifiers
for interesting events in soccer games by taking user-
defined training data into consideration.
User-defined labels for relevance feedback, inter-
estingness, or class assignment share the idea to bind
a single label to an instance, reflecting the classi-
cal machine learning approach ( f (i) = y). However,
functions for learning the concept of similarity require
a label representing the relation of pairs or groups
of instances, e.g., in our case, f (i
1
, i
2
) = y, where
y represents a similarity score in this case. Visual-
interactive user interfaces supporting such learning
functions have to deal with this additional complex-
ity. A workaround strategy often applied for the vali-
dation of information retrieval results shows multiple
candidates and asks the user for the most similar in-
stances with respect to a given query. We neglect this
approach since our users do not necessarily have the
knowledge to give feedback for any query instance
suggested by the system. Rather, we follow a user-
centered strategy where users themselves have an in-
fluence on the selection of pairs of instances.
Another way to avoid complex learning functions
Visual-Interactive Similarity Search for Complex Objects by Example of Soccer Player Analysis
77

is allowing users to explicitly assign weights to the
attributes of the data set (Ware et al., 2001; Jeong
et al., 2009). The drawback of this strategy is the ne-
cessity of users knowing the attribute space in its en-
tirety. Especially when sophisticated descriptors are
applied for the extraction of features (e.g., Fourier co-
efficients) or deep learned features, explicit weighting
of individual features is inconceivable. Rather, our
approach applies an implicit attribute learning strat-
egy. While the similarity model indeed uses weighted
attributes for calculating distances between instances
(see Section 2.2), an algorithmic model derives at-
tribute weights based on the user feedback at object-
level. We conclude with a visual-interactive feedback
interface where users are enabled to align small sets of
instances on a two-dimensional arrangement (Bernard
et al., 2014). The relative pairwise distances between
the instances are then used by the similarity model.
We neglect strategies for arranging small sets of more
than two instances in 2D since we explicitly want to
include categorical and boolean attributes. It has been
shown that the interpretation of relative distances for
categorical data is non-trivial (Sessler et al., 2014).
2.2 Similarity Modeling
Aside from methods that employ visual interactive in-
terfaces for learning the similarity between objects
from user input as presented in the previous sec-
tion, methods for the autonomous learning of sim-
ilarity relations have been introduced (Kulis, 2012;
Bellet et al., 2013). Human similarity perception is
a psychologically complex process which is difficult
to formalize and model mathematically. It has been
shown previously that the human perception of simi-
larity does not follow the rules of mathematical met-
rics, such as identity, symmetry and transitivity (Tver-
sky, 1977). Nevertheless, today most approaches em-
ploy distance metrics to approximate similarity esti-
mates between two items (e.g., objects, images, etc.).
Common distance metrics are Euclidean distance (L2
distance) and Manhattan distance (L1 distance) (Yu
et al., 2008), as well as warping or edit distance met-
rics. The edit distance was, e.g., applied to the soccer
domain in a search system where users can sketch tra-
jectories of player movement (Shao et al., 2016).
To better take human perception into account and
to better adapt the distance metric to the underly-
ing data and task an increasingly popular approach
is to learn similarity or distance measures from data
(metric learning). For this purpose different strategies
have been developed.
In linear metric learning the general idea is to
adapt a given distance function (e.g., a Mahalanobis-
like distance function) to the given task by esti-
mating its parameters from underlying training data
The learning is usually performed in a supervised or
weakly-supervised fashion by providing ground truth
in the form of (i) examples of similar and dissimi-
lar items (positive and negative examples), (ii) con-
tinuous similarity assessments for pairs of items (e.g.,
provided by a human) and (iii) triplets of items with
relative constraints, such as A is more similar to B
and C (Bellet et al., 2013; Xing et al., 2003). During
training the goal is to find parameters of the selected
metric that maximizes the agreement between the dis-
tance estimates and the ground truth, i.e., by minimiz-
ing a loss function that measures the differences to the
ground truth. The learned metric can then be used to
better cluster the data or to improve the classification
performance in supervised learning.
Similar to these approaches, we also apply a lin-
ear model. Instead of learning the distance metric di-
rectly, we estimate the Pearson correlation between
the attributes and the provided similarity assessments.
In this way, the approach is applicable even to small
sets of labeled pairs of instances. The weights ex-
plicitly model the importance of each attribute and,
as a by-product, enable the selection of the most im-
portant features for downstream approaches. To fa-
cilitate the full potential, we apply weighted distance
measures for internal similarity calculations, includ-
ing measures for categorical (Boriah et al., 2008) and
boolean (Cha et al., 2005) attributes.
In non-linear metric learning, one approach is to
learn similarity (kernels) directly without explicitly
selecting a distance metric. The advantage of kernel-
based approaches is that non-linear distance relation-
ships can be modeled more easily. For this purpose
the data is first transformed by a non-linear kernel
function. Subsequently, non-linear distance estimates
can be realized by applying linear distance measure-
ments in the transformed non-linear space (Abbas-
nejad et al., 2012; Torresani and Lee, 2006). Other
authors propose multiple kernel learning, which is a
parametric approach that tries to learn a combination
of predefined base kernels for a given task (G
¨
onen
and Alpaydın, 2011). Another group of non-linear ap-
proaches employs neural networks to learn a similar-
ity function (Norouzi et al., 2012; Salakhutdinov and
Hinton, 2007). This approach has gained increasing
importance due to the recent success of deep learn-
ing architectures (Chopra et al., 2005; Zagoruyko and
Komodakis, 2015; Bell and Bala, 2015). The major
drawback of these methods is that they require huge
amounts of labeled instances for training which is not
available in our case.
The above methods have in common that the
IVAPP 2017 - International Conference on Information Visualization Theory and Applications
78

Table 1: Overview of primary data attributes about soccer players retrieved from DBpedia with SPARQL.
Attribute Description Variable Type Value Domain Quality
Issues
Name Name of the soccer player, unique identifier Nominal (String) Alphabet of names perfect
Description Abstract of a player - for tooltips Nominal (String) Full text good
Nationality Nation of the player Nominal (String) 103 countries perfect
National Team National team, if applicable. Can be a youth team. Nominal (String) 155 nat. teams sparse
Birthday Day of birth (dd.mm.yyyy) Date perfect
Birthplace Place of birth Nominal (String) Alphabet of cities good
Size Size of the player in meters Numerical [1.59, 2.03] good
Current Team Team of the player (end of last season) Nominal (String) Alphabet of teams perfect
Main Position Main position on the field Nominal (String) 13 positions perfect
Other positions
Other positions on the field Nominal (String) 13 positions sparse, list
League Games No. of games played in the current soccer league Numerical [0, 591] sparse
League Goals No. of goals scored in the current soccer league Numerical [0, 289] sparse
Nat. Games No. of games played for the current nat. team Numerical [0, 150] sparse
Nat. Goals No. of goals scored for the current nat. team Numerical [0, 71] sparse
learned metric is applied globally to all instances in
the dataset. An alternative approach is local metric
learning that learns specific similarity measures for
subsets of the data or even separate measures for each
data item (Frome et al., 2007; Weinberger and Saul,
2009; Noh et al., 2010). Such approaches have advan-
tages especially when the underlying data has hetero-
geneous characteristics. A related approach are per-
exemplar classifiers which even allow to select dif-
ferent features (attributes) and distance measures for
each item. Per-exemplar classification has been ap-
plied successfully for different tasks in computer vi-
sion (Malisiewicz et al., 2011). While our proposed
approach to similarity modeling operates in a global
manner, our active learning approach exploits local
characteristics of the feature space by analyzing the
density of labeled instances in different regions for
making suggestions to the user.
The approaches above mostly require large
amounts of data as well as ground truth in terms of
pairs or triplets of labeled instances. Furthermore,
they rely on numerical data (or at least non-mixed
data) as input. We propose an approach for met-
ric learning for unlabeled data (without any ground
truth) with mixed data types (categorial, binary, and
numerical), which is also applicable to small datasets
and data sets with initially no labeled instances. For
this purpose, we combine metric learning with active
learning (Yang et al., 2007) and embed it in an inter-
active visualization system for immediate feedback.
Our approach allows the generation of useful distance
metrics from a small number of user inputs.
3 APPROACH
An overview of the visual-interactive system is shown
in Figure 1. Figure 2 illustrates the interplay of the
technical components assembled to a workflow. In
Sections 3.2, 3.3, and 3.4, we describe the three core
components in detail, after we discuss data character-
istics and abstractions in Section 3.1.
3.1 Data Characterization
3.1.1 Data Source
Various web references provide data about soccer
players with information differing in its scope and
depth. For example some websites offer information
about market price values or sports betting statistics,
while other sources provide statistics about pass accu-
racy in every detail. Our prior requirement to the data
is its public availability to guarantee the reproducibil-
ity of our experiments. In addition, the information
about players should be comprehensible for broad au-
diences and demonstrate the applicability. Finally,
the attributes should be of mixed types (numerical,
categorical, boolean). This is why Wikipedia
2
the
2
Wikipedia, https://en.wikipedia.org/wiki/Main Page,
last accessed on September 22th, 2016
Visual-Interactive Similarity Search for Complex Objects by Example of Soccer Player Analysis
79

Table 2: Overview of secondary data attributes about soccer players deduced from the primary data.
Attribute Description Variable Type Value Domain Quality
Age Age of the player (end of last season) Numerical (int) [16-43] perfect
National Player Whether the player has played as a national player Boolean [false, true] sparse
Nat. games p.a. Average number of national games per year Numerical [0.0, 24.0] sparse
Nat. goals per game Average number of goals per national game Numerical < 3.0 sparse
League games p.a. Average number of league games per year Numerical [0.0, 73.5] sparse
League goals p. game Average number of goals per league game Numerical < 3.0 sparse
Position Vertical The aggregated positions of the player as y-
Coordinate (from “Keeper” to “Striker”)
Numerical [0.0, 1.0] perfect
Position Horizontal The aggregated positions of the player as x-
Coordinate (from left to right)
Numerical [0.0, 1.0] perfect
Main Position LR The horizontal position of the player as String Nominal {left, center, right} perfect
free encyclopedia serves as our primary data source.
The structured information about players presented
at Wikipedia is retrieved from DBpedia
3
. We ac-
cess DBpedia with SPARQL (Prud’hommeaux and
Seaborne, 2008) the query language for RDF
4
recom-
mended by W3C
5
. We focused on the Europe’s five
top leagues (Premier League in England, Seria A in
Italy, Ligue 1 in France, Bundesliga in Germany, and
LaLiga in Spain). Overall, we gathered 2,613 players
engaged by the teams of respective leagues.
3.1.2 Data Abstraction
Table 1 provides an overview of the available infor-
mation about soccer players. Important attributes for
the player (re-)identification are the unique name in
combination with the nationality and the current team.
Moreover, a various numerical and categorical infor-
mation is provided for similarity modeling.
Table 2 depicts the secondary data (i.e., attributes
deduced from primary data). Our strategy for the ex-
traction of additional information is to obtain as much
meaningful attributes as possible. One benefit of our
approach will be a weighing of all involved attributes,
making the selection of relevant features for down-
stream analyses an easy task. This strategy is inspired
by user-centered design approaches in different appli-
cation domains where we asked domain experts about
the importance of attributes (features) for the similar-
ity definition process (Bernard et al., 2013; Bernard
et al., 2015a). One of the common responses was “ev-
erything can be important!” In the usage scenarios,
3
DBpedia, http://wiki.dbpedia.org/about, last accessed
on September 22th, 2016
4
RDF, https://www.w3.org/RDF, last accessed on
September 22th, 2016
5
RDF, https://www.w3.org, last accessed on September
22th, 2016
we demonstrate how the similarity model will weight
the importance of primary and secondary attributes
with respect to the learned pairs of labeled players.
3.1.3 Preprocessing
One of the data-centered challenges was the sparsity
of some data attributes. This phenomenon can of-
ten be observed when querying less popular instances
of concepts from DBpedia. To tackle this challenge
we removed attributes and instances from the data set
containing only little information. Remaining miss-
ing values were marked with missing value indica-
tors, with respect to the type of attribute. For illus-
tration purposes, we also removed players without an
image in Wikipedia. The final data set consists of
1,172 players. An important step in the preprocessing
pipeline is normalization. By default, we rescaled ev-
ery numerical attribute into the relative value domain
to foster metrical comparability.
3.2 Visual-Interactive Learning
Interface
One of the primary views of the approach enables
users to give feedback about individual instances. Ex-
amples of the feedback interface can be seen in the
Figures 1 and 3. The interface for the definition of
similarity between soccer players shows two players
in combination with a slider control in between. The
slider allows the communication of similarity scores
between the two players. We decided for a quasi-
continuous slider, in accordance to the continuous
numerical function to be learned. However, one of
possible design alternative would propose a feedback
control with discrete levels of similarity.
Every player is represented with an image (when
available and permitted), a flag icon showing the
IVAPP 2017 - International Conference on Information Visualization Theory and Applications
80
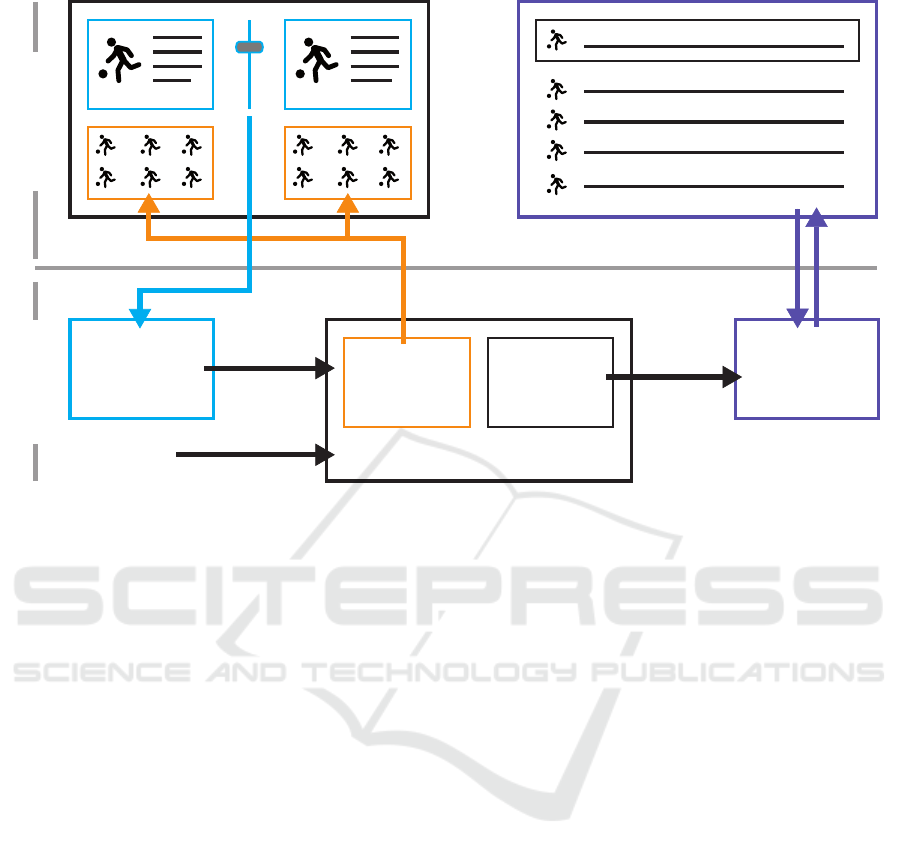
Feedback
Interpreter
Active
Learning
Support
Similarity
Learner
Similarity Model
Data
Feedback Interface Result Visualization
Use Case:
k-Nearest
Neighbors
FrontendBackend
Figure 2: Workflow of the approach. Users assign similarity scores for pairs of players in the feedback interface. In the
backend, the feedback is interpreted (blue) and delegated to the similarity model. Active learning support suggests players to
improve the model (orange). A kNN-search supports the use case of the workflow shown in the result visualization (purple).
player’s nationality, as well as textual labels for the
player name and the current team. These four at-
tributes are also used for compact representations
of players in other views of the tool. The visual
metaphor of a soccer field represents the players’
main positions. In addition, a list-based view provides
the details about the players’ attribute values.
The feedback interface combines three additional
functionalities most relevant for the visual-interactive
learning approach.
First, users need to be able to define and select play-
ers of interest. This supports the idea to grasp detailed
feedback about instances matching the users’ expert
knowledge (Seifert and Granitzer, 2010; H
¨
oferlin
et al., 2012). For this purpose a textual query in-
terface is provided in combination with a combobox
showing players matching a user-defined query. In
this way, we combine query-by-sketch and the query-
by-example paradigm for the straightforward lookup
of known players.
The second ingredient for an effective active learn-
ing approach is the propagation of instances to the
user reducing the remaining model uncertainty. One
crucial design decision determined that users should
always be able to label players they actually know.
Thus, we created a solution for the candidate selec-
tion combining automated suggestions by the model
with the preference of users. The feedback interface
provides two sets of candidate players, one set is lo-
cated at the left and the other one right of the interface.
Replacing the left feedback instance with one of the
suggested players at the left will reduce the remaining
entropy regarding the current instance at the right, and
vice-versa. However, we are aware that other strate-
gies for proposing unlabeled instances exist. Two of
the obvious alternative strategies for labeling players
would be a) providing a global pool of unlabeled play-
ers (e.g., in combination with drag-and-drop) or b) of-
fering pairs of instances with low confidence. While
these two strategies may be implemented in alterna-
tive designs, we recall the design decision that users
need to know the instances to be labeled. In this way,
we combine a classical active learning paradigm with
the user-defined selection of players matching their
expert knowledge.
Finally, the interface provides a history functionality
for labeled pairs of players at the bottom of the feed-
back view (cf. Figure 1). For every pair of players
images are shown and the assigned similarity score is
depicted in the center.
3.3 Similarity Modeling
3.3.1 Similarity Learning
The visual-interactive learning interface provides
feedback about the similarity of pairs of instances.
Visual-Interactive Similarity Search for Complex Objects by Example of Soccer Player Analysis
81
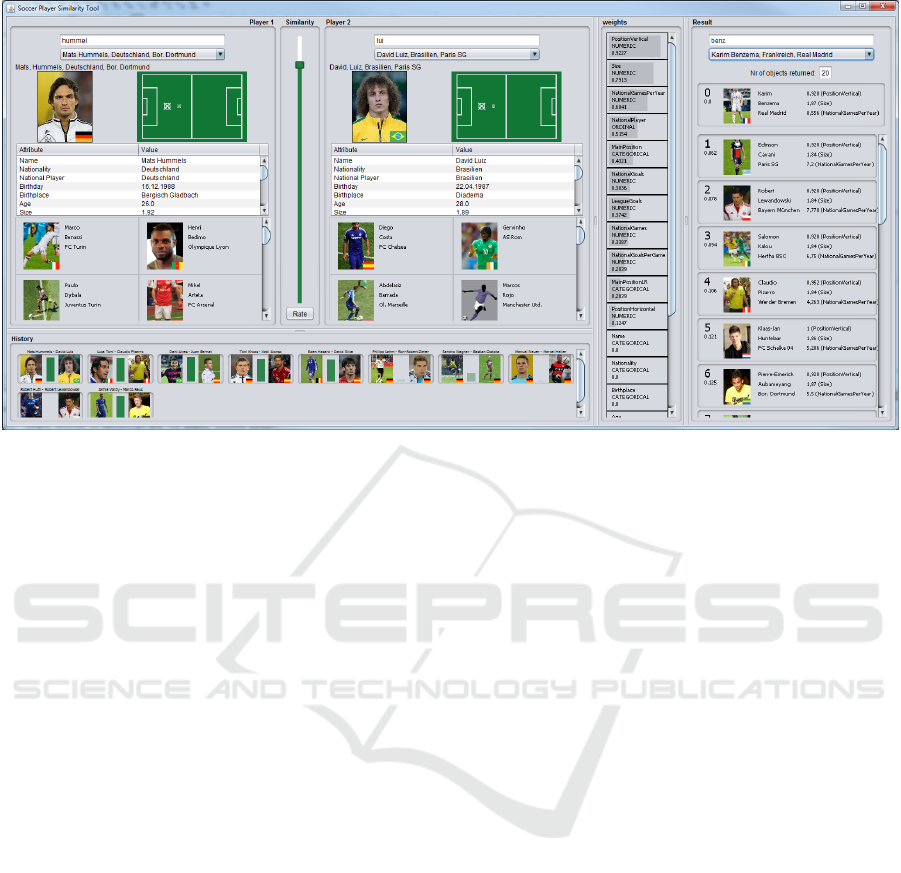
Figure 3: Similarity model learned with stars in the European soccer scene. The history provides an overview of ten labeled
pairs of players. The ranking of weighted attributes assigns high correlations to the vertical position, player size, and national
games. Karim Benzema served as the query player: all retrieved players share quite similar attributes with Benzema.
Thus, the feedback propagated to the system is ac-
cording to the learning function f (i
1
, i
2
) = y whereas
y is a numerical value between 0 (unsimilar) and 1
(very similar). Similarity learning is designed as a
two-step approach. First, every attribute (feature) of
the data set is correlated with the user feedback. Sec-
ond, pairwise distances are calculated for any given
instance of the data set.
The correlation of attributes is estimated with
Pearson’s correlation coefficient. Pairwise distances
between categorical attributes are transformed into
the numerical space with the Kronecker delta func-
tion. The correlation for a given attribute is then es-
timated between the labeled pairs of instances pro-
vided by the user and the distance in the value do-
main obtained by that attribute. In the current state
of the approach every attribute is correlated indepen-
dently to reduce computation time and to maximize
interpretability of the resulting weights. The result of
this first step of the learning model is a weighting of
the attributes that is proportional to the correlation.
In a second step, the learning model calculates dis-
tances between any pair of instances. As the under-
lying data may consist of mixed attribute types, dif-
ferent distance measures are used for different types
of attributes. For numerical data we employ the
(weighted) Euclidean distance. For categorical at-
tributes we choose the Goodall distance (Boriah et al.,
2008) since it is sensitive to the probability of attribute
values and less frequent observations are assigned
higher scores. The weighted Jaccard distance (Cha
et al., 2005) is used for binary attributes. The Jac-
card distance neglects negative matches (both inputs
false), which might be advantageous for many simi-
larity concepts, i.e. the absence of an attribute in two
items does not add to their similarity (Sneath et al.,
1973). After all distance measures have been com-
puted in separate distance matrices all matrices are
condensed into a single distance matrix by a weighted
sum, where the weights represent the fraction of the
sum of weights for each attribute type.
3.3.2 Active Learning Strategy
We follow an interactive learning strategy that allows
for keeping the user in the loop. To support the it-
erative nature, we designed an active learning strat-
egy that fosters user input for instances for which
no or little information is available yet. As a start-
ing point for active learning the user selects a known
instance from the database. Note that this is impor-
tant as the user needs a certain amount of knowledge
about the instance to make similarity assessments in
the following (see Section 3.2). After an instance
has been selected, we identify the attribute with the
highest weight. Next, we estimate the farthest neigh-
bors to the selected item under the given attribute for
which no similarity assessments exist so far. A set
of respective candidates is then presented to the user.
This strategy is useful as it identifies pairs of items
for which the system cannot make assumptions so far.
The user can now select one or more proposed items
and add similarity assessments. By adding assess-
IVAPP 2017 - International Conference on Information Visualization Theory and Applications
82
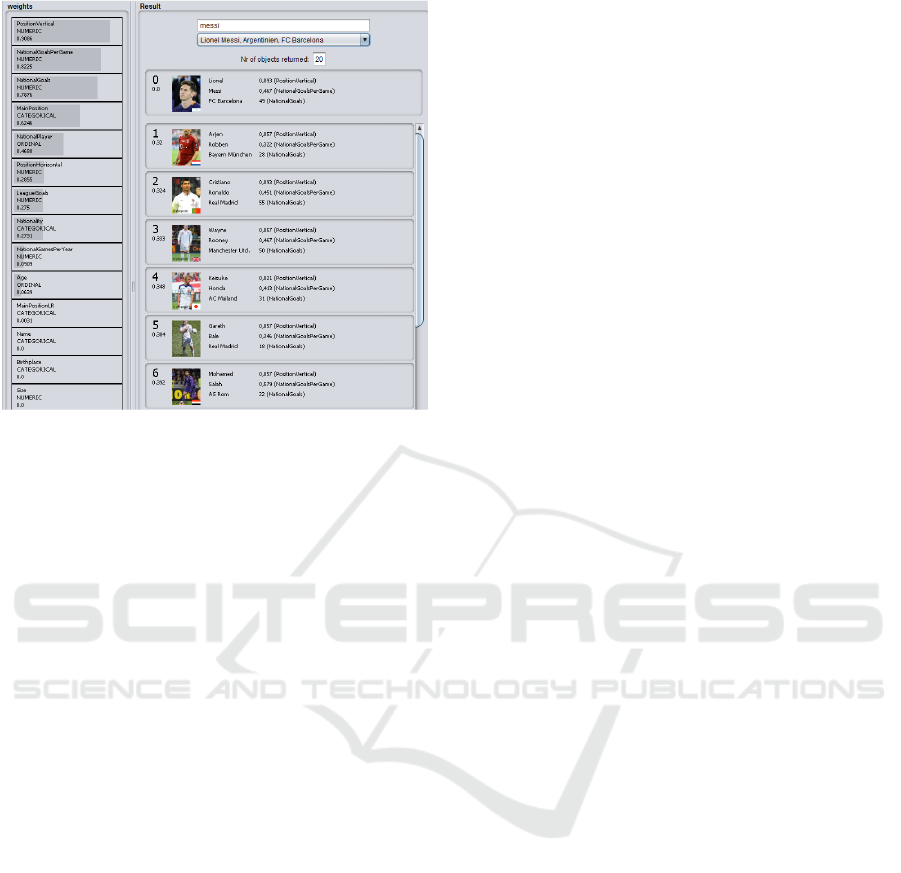
Figure 4: Nearest neighbor search for Lionel Messi. Even if
superstars are difficult to replace, the set of provided nearest
neighbors is quite reasonable. Keisuke Honda may be sur-
prising, nevertheless Honda has similar performance values
in the national team of Japan.
ments the coverage of the attribute space is success-
fully improved especially in sparse areas where little
information was available so far.
3.3.3 Model Visualization
Visualizing the output of algorithmic models is cru-
cial, e.g., to execute downstream analysis tasks (see
Section 3.4). In addition, we visualize the current
state of the model itself. In this way, designers and
experienced users can keep track of the model im-
provement, its quality improvement, and its determin-
ism. The core black-box information of this two-step
learning approach is the set of attribute weights repre-
senting the correlation between attributes and labeled
pairs of instances. Halfway right in the tool, we make
the attribute weights explicit (between the feedback
interface and the model result visualization), as it can
be seen in the title figure. An enlarged version of the
model visualization is shown at the left of Figure 4
where the model is used to execute a kNN search for
Lionel Messi. From top to bottom the list of attributes
is ranked in the order of their weights. It is a reason-
able point of discussion whether the attribute weights
should be visualized to the final group of users of
such a system. A positive argument (especially in this
scientific context) is the transparency of the system
which raises trust and allows the visual validation.
However, a counter argument is biasing users with in-
formation about the attribute/feature space. Recalling
that especially in complex feature spaces users do not
necessarily know any attribute in detail, it may be a
valid design decision to exclude the model visualiza-
tion from the visual-interactive system.
3.4 Result Visualization –
Visual-Interactive NN Search
We provide a visual-interactive interface for the visu-
alization of the model output (see Figure 4). A pop-
ular use case regarding soccer players is the identifi-
cation of similar players for a reference player, e.g.,
when a player is replaced in a team due to an upcom-
ing transfer event. Thus, the interface of the result vi-
sualization will provide a means to query for similar
soccer players. We combine a query interface (query-
by-sketch, query-by-example) with a list-based visu-
alization of retrieved players. The retrieval algorithm
is based on a standard k-NN search (k nearest neigh-
bors) using the model output. For every list element of
the result set a reduced visual representation of a soc-
cer player is depicted, including the player’s image,
name, nationality, position, and team. Moreover, we
show information about three attributes contributing
to the current similarity model significantly. Finally,
we depict rank information as well as the distance to
the query for ever element. The result visualization
rounds up the functionality. Users can train individ-
ual similarity models of soccer player similarity and
subsequently perform retrieval tasks. From a more
technical perspective, the result visualization closes
the feedback loop of the visual-interactive learning
approach. In this connection, users can analyze re-
trieved sets of players and give additional feedback
for weakly learned instances. An example can be seen
in Figure 4 showing a retrieved result set for Lionel
Messi used as an example query.
4 EVALUATION
Providing scientific proof for this research effort
is non-trivial since the number of comparable ap-
proaches is scarce. Moreover, we address the chal-
lenge of dealing with data sets which are completely
unlabeled at start, making classical quantitative eval-
uations with ground truth test data impossible.
In the following, we demonstrate and validate the ap-
plicability of the approach with different strategies. In
a first proof of concept scenario a similarity model is
trained for an explicitly known mental model, answer-
ing the question whether the similarity model will be
able to capture a human’s notion of similarity. Sec-
ond, we assess the effectiveness of the approach in
two usage scenarios. We demonstrate how the tool
Visual-Interactive Similarity Search for Complex Objects by Example of Soccer Player Analysis
83
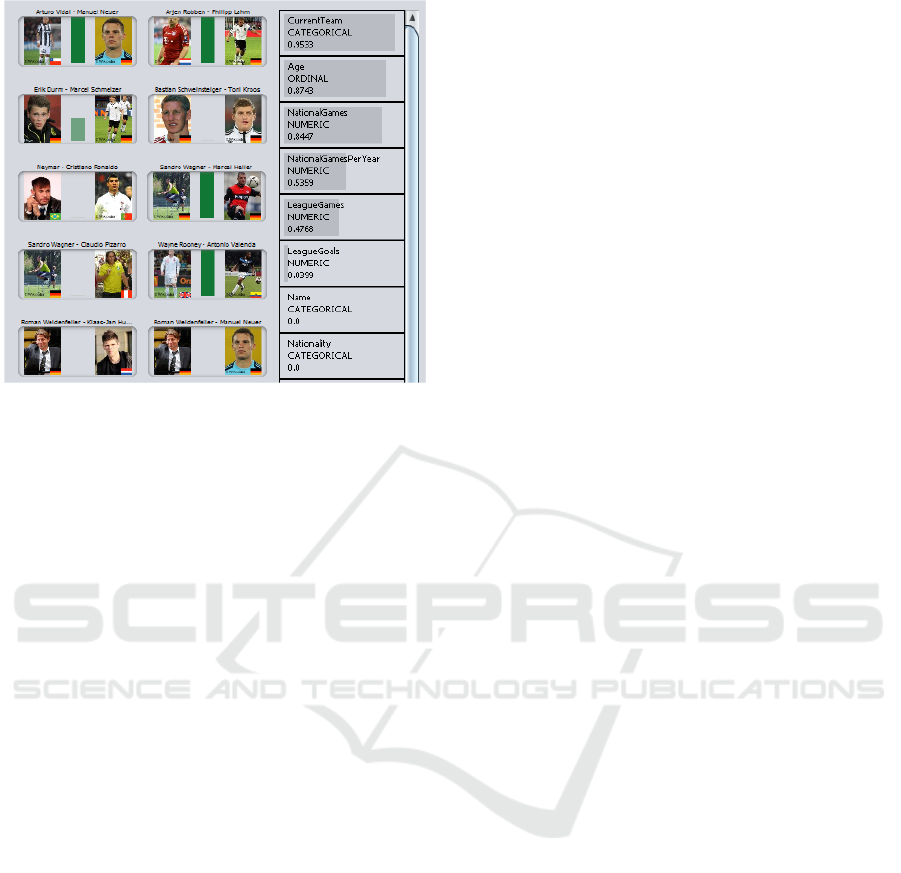
Figure 5: Experiment with a mental model based on teams
and player age. It can be seen that for ten labeled pairs of
players the system is able to grasp this mental model.
can be used to learn different similarity models, e.g.,
to replace a player in the team by a set of relevant
candidates. Finally, we report on experiments for the
quantification of model efficiency.
4.1 Proof of Concept - Fixed Mental
Model
The first experiment assesses whether the similarity
model of the system is able to grasp the mental sim-
ilarity model of a user. As an additional constraint,
we limit the number of labeled pairs to ten, repre-
senting the requirement of very fast model learning.
As a proof of concept, we predefine a mental model
and express it with ten labels. In particular, we sim-
ulate a fictitious user who is only interested in the
age of players, as well as their current team. In other
words, a numerical and a categorical attribute defines
the mental similarity model of the experiment. If
two players are likely identical with respect to these
two attributes (age +-1) the user assigns the similarity
score 1.0. If only one of the two attributes match, the
user feedback is 0.5 and if both attributes disagree a
pair of players is labeled with the similarity score 0.0.
The ten pairs of players used for the experiment are
shown in Figure 5. In addition to the labeled pairs,
the final attribute weights calculated by the system
are depicted. Three insights can be identified. First,
it becomes apparent that the two attributes with the
highest weights exactly match the pre-defined men-
tal model. Second, the number of national games, the
number of national games per year, and the number
of league games also received weights. Third, the set
of remaining attributes received zero weights. While
the first insight validates the experiment, the second
insight sheds light on attributes correlated with the
mental model. As an example, we hypothesize that
the age of players is correlated with the number of
games. This is a beneficial starting point for down-
stream feature selection tasks, e.g., when the model is
to be implemented as a static similarity function. Fi-
nally, the absence of weights for most other attributes
demonstrates that only few labels are needed to obtain
a precise focus on relevant attributes.
4.2 Usage Scenario 1 - Top Leagues
The following usage scenario demonstrates the effec-
tiveness of the approach. A user with much experi-
ence in Europe’s top leagues (Premier League, Se-
ria A, Ligue 1, Bundesliga, LaLiga) rates ten pairs
of prominent players with similarity values from very
high to very low. The state of the system after ten la-
beling iterations can be seen in Figure 3. The history
view shows that high similarity scores are assigned to
the pairs: Mats Hummels vs. David Luiz, Luca Toni
vs. Claudio Pizarro, Dani Alves vs. Juan Bernat, Toni
Kroos vs. Xabi Alonso, Eden Hazard vs. David Silva,
and Jamie Vardi vs. Marco Reus. Comparatively
low similarity values are assigned to the pairs Philipp
Lahm vs. Ron-Robert Zieler, Sandro Wagner cs. Bas-
tian Oczipka, Manuel Neuer vs. Marcel Heller, and
Robert Huth vs. Robert Lewandowski. The set of
player instances resembles a vast spectrum of nation-
alities, ages, positions, as well as numbers of games
and goals. The resulting leaning model depicts high
weights to the vertical position on the field, the player
size, the national games per year. Further, being a na-
tional player and the goals for the respective national
teams contribute to the global notion of player simi-
larity. In the result visualization, the user chose Karim
Benzema for the nearest neighbor search. The result
set (Edison Cavani, Robert Lewandowski, Salomon
Kalou, Claudio Pizarro, Klass-Jan Huntelaar, Pierre-
Emerick Aubameyang) represents the learned model
quite well. All these players are strikers, in a similar
age, and very successful in their national teams. In
contrast, there is not a single player listed in the result
who does not stick to the described notion of similar-
ity. In summary, this usage scenario demonstrates that
the tool was able to reflect the notion of similarity of
the user with a very low number of training instances.
4.3 Usage Scenario 2 - National Trainer
In this usage scenario, we envision to be a national
trainer. Our goal is to engage a similarity model
IVAPP 2017 - International Conference on Information Visualization Theory and Applications
84

which especially resembles the quality of soccer play-
ers, but additionally takes the nationality of players
into account. As a result, similar players coming from
the same country are classified similar. The reason is
simple; players from foreign countries cannot be po-
sitioned in a national team. Figure 1 shows the his-
tory of the ten labeled pairs of players. We assigned
similar scores to two midfielders from Belgium, two
strikers from France, two defenders from Germany,
two goalkeepers from Germany, and two strikers from
Belgium. In addition, four pairs of players with dif-
ferent nationalities were assigned with considerably
lower similarity scores, even if the players play at
very similar positions. The result visualization shows
the search result for Dimitri Payet who was used as a
query player. In this usage scenario, the result can be
used to investigate alternative players for the French
national team. With only ten labels, the algorithm re-
trieves exclusively players from France, all having ex-
pertise in the national team, and all sharing Dimitri
Payets position (offensive midfielder).
4.4 Quantification of Efficiency
In the final evaluation strategy, we conduct an exper-
iment to yield quantitative results for the efficiency.
We assess the ‘speed’ of the convergence of the at-
tribute weighting for a given mental model, i.e. how
many learning iterations the model needs to achieve
stable attribute weights. The independent variable
of the experiment is the number of learned itera-
tions, i.e., the number of instances already learned by
the similarity model. The dependent variable is the
change of the attribute weights of the similarity model
between two learning iterations, assessed by the quan-
titative variable ∆w. To avoid other degrees of free-
dom, we fix the mental model used in the experiment.
For this purpose, a small group of colleagues all hav-
ing an interest in soccer defined labels of similarity
for 50 pairs of players.
To guarantee robustness and generalizability, we
run the experiment 100 times. Inspired by cross-
validation, the set of training instances is permuted in
every run. The result is depicted in Figure 6. Ob-
viously, the most substantial difference of attribute
weights is in the beginning of the learning process
between the 1st and the 2nd learning iteration (∆w =
0.36). In the following, the differences significantly
decrease before reaching a saturation point approxi-
mately after the 5th iteration. For the 6th and later
learning iterations ∆w is already below 0.1 and 0.03
after the 30th iteration. To summarize, the approach
only requires very few labeled instances to produce a
robust learning model. This is particularly beneficial
when users have very limited time, e.g., important ex-
perts in the respective application field.
5 DISCUSSION
In the evaluation section, we demonstrated the appli-
cability of the approach from different perspectives.
However, we want to shed light on aspects that allow
alternative design decisions, or may be beneficial sub-
jects to further investigation.
Similarity vs. Distance. Distance measures are
usually applied to approximate similarity relation-
ships. This is also the case in our work. We are, how-
ever, aware that metric distances can in general not be
mapped directly to similarities, especially when the
dimension of the data becomes high and the points
in the feature space move far away from each other.
Finding suitable mappings between distance and sim-
ilarity is a challenging topic that we will focus on in
future research.
Active Learning Strategy. The active learning sup-
port of this approach builds on the importance
(weights) of attributes to suggest new learning in-
stances to be queried. Thus, we focus on a scalable
solution that takes the current state of the model into
account and binds suggestions to previously-labeled
instances. Alternative strategies may involve other in-
trinsic aspects of the data (attributes or instances) or
the model itself. For example statistical data analy-
sis, distributions of value domains, or correlation tests
could be considered. Other active learning strate-
gies may be inspired by classification approaches, i.e.,
models learning categorical label information. Con-
crete classes of strategies involve uncertainty sam-
pling or query by committee (Settles, 2009).
Numerical vs. Categorical. This research effort
explicitly addressed a complex data object with mixed
data, i.e., objects characterized by numerical, categor-
ical, and boolean attributes. This class of objects is
widespread in the real-world, and we argue that it is
worth to address this additional analytical complexity.
However, coping with mixed data can benefit from a
more in-depth investigation at different steps of the
algorithmic pipeline.
Usability. We presented a technique that actually
works but has not been throughoutly evaluated with
users. Will users be able to interact with the sys-
tem? We did cognitive walkthroughs and created the
Visual-Interactive Similarity Search for Complex Objects by Example of Soccer Player Analysis
85
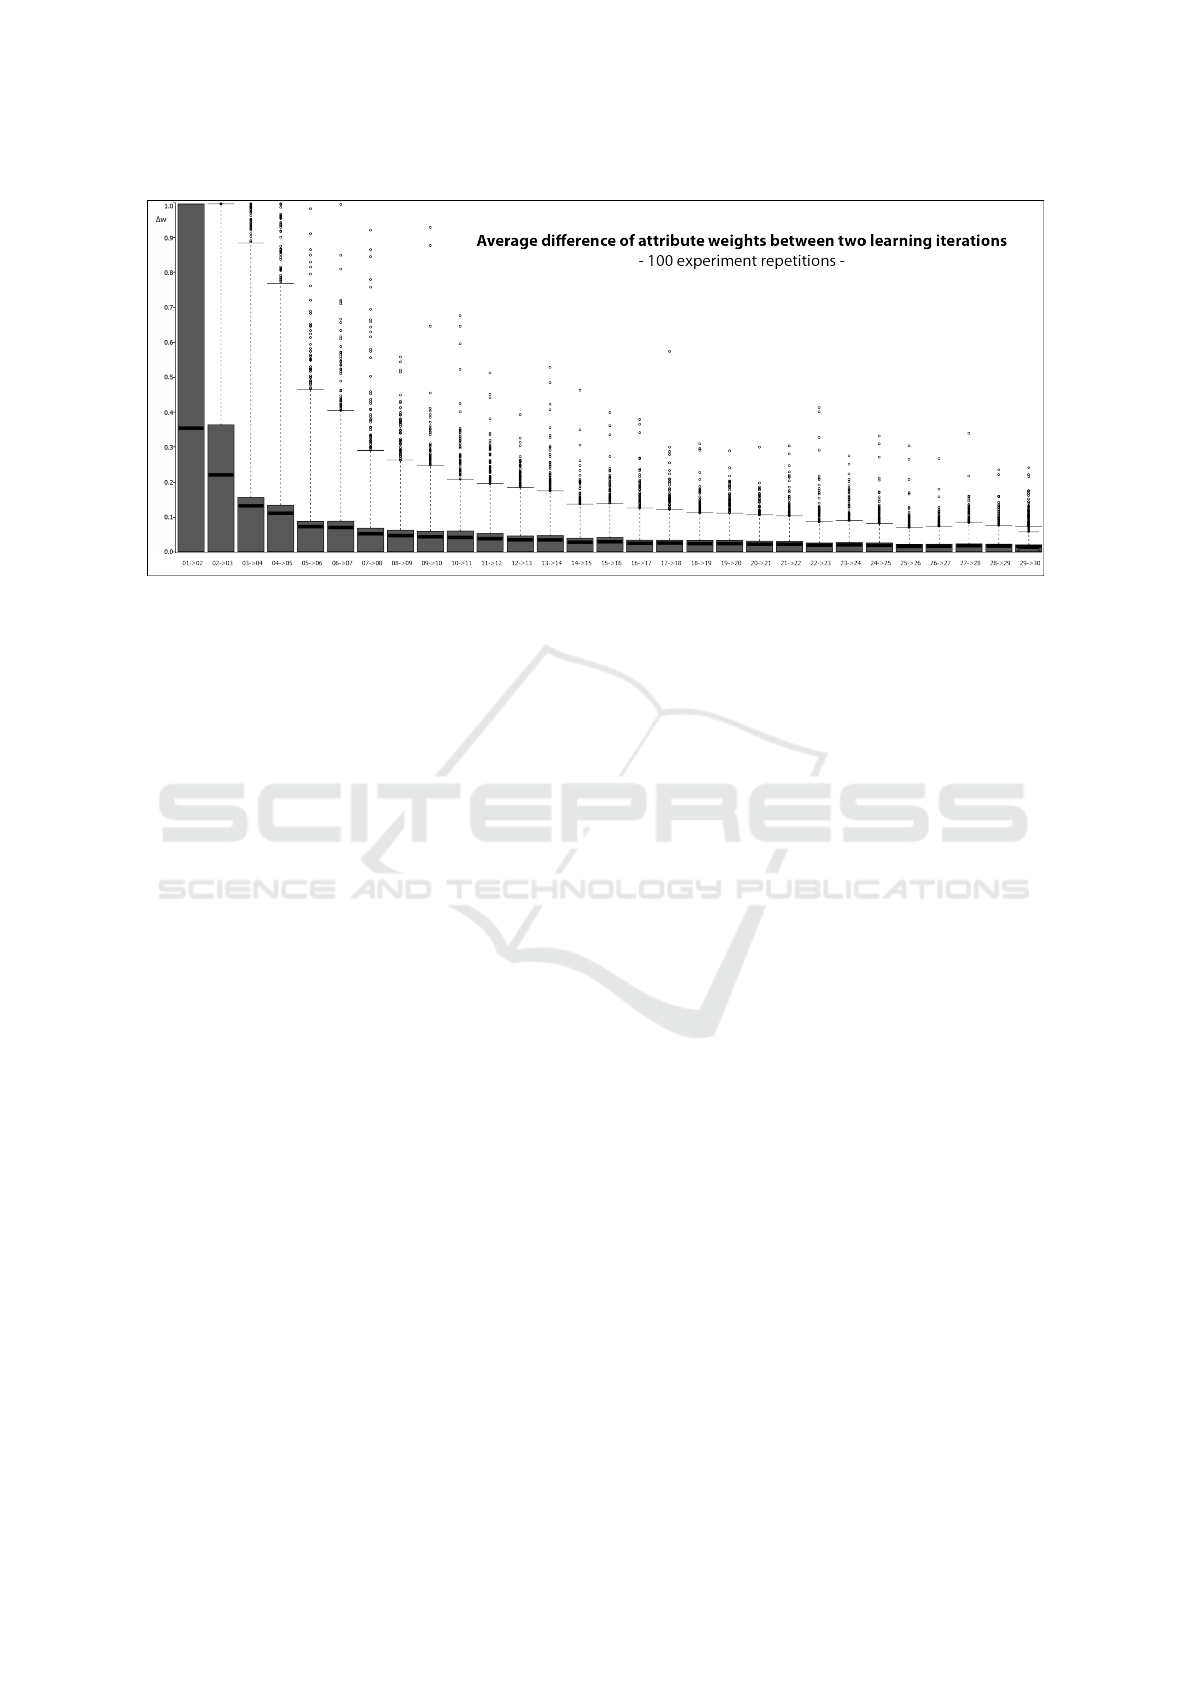
Figure 6: Quantification of efficiency. The experiment shows differences in the attribute weighting between consecutive
learning iterations. A saturation point can be identified, approximately after the 5th labeled pair of instances.
designs in a highly interactive manner. Still, the ques-
tion arises whether domain experts will appreciate the
tool and be able to work with it in an intuitve way.
6 CONCLUSION
We presented a tool for the visual-interactive similar-
ity search for complex data objects by example of soc-
cer players. The approach combines principles from
active learning, information visualization, visual ana-
lytics, and interactive information retrieval. An algo-
rithmic workflow accepts labels for instances and cre-
ates a model reflecting the similarity expressed by the
user. Complex objects including numerical, categori-
cal, and boolean attribute types can be included in the
algorithmic workflow. Visual-interactive interfaces
ease the labeling process for users, depict the model
state, and represent output of the similarity model.
The latter is implemented by means of an interactive
information retrieval technique. While the strategy to
combine active learning with visual-interactive inter-
faces enabling users to label instances of interest is
special, the application by example of soccer players
is, to the best of our knowledge, unique. Domain ex-
perts are enabled to express expert knowledge about
similar players, and utilize learned models to retrieve
similar soccer players. We demonstrated that only
very few labels are needed to train meaningful and
robust similarity models, even if the data set was un-
labeled at start.
Future work will include additional attributes
about soccer players, e.g., market values or variables
assessing the individual player performance. In ad-
dition, it would be interesting to widen the scope and
the strategy to other domains, e.g., in design study ap-
proaches. Finally, the performance of individual parts
of the algorithmic workflow may be tested against de-
sign alternatives in future experiments.
REFERENCES
Abbasnejad, M. E., Ramachandram, D., and Mandava, R.
(2012). A survey of the state of the art in learn-
ing the kernels. Knowledge and Information Systems,
31(2):193–221.
Behrisch, M., Korkmaz, F., Shao, L., and Schreck, T.
(2014). Feedback-driven interactive exploration of
large multidimensional data supported by visual clas-
sifier. In IEEE Visual Analytics Science and Technol-
ogy (VAST), pages 43–52.
Bell, S. and Bala, K. (2015). Learning visual similarity for
product design with convolutional neural networks.
ACM Transactions on Graphics (TOG), 34(4):98.
Bellet, A., Habrard, A., and Sebban, M. (2013). A survey
on metric learning for feature vectors and structured
data. arXiv preprint arXiv:1306.6709.
Bernard, J., Daberkow, D., Fellner, D. W., Fischer, K., Koe-
pler, O., Kohlhammer, J., Runnwerth, M., Ruppert, T.,
Schreck, T., and Sens, I. (2015a). Visinfo: A digital
library system for time series research data based on
exploratory search – a user-centered design approach.
Int. Journal on Digital Libraries, 16(1):37–59.
Bernard, J., Sessler, D., Bannach, A., May, T., and
Kohlhammer, J. (2015b). A visual active learning
system for the assessment of patient well-being in
prostate cancer research. In IEEE VIS WS on Visual
Analytics in Healthcare (VAHC), pages 1–8. ACM.
Bernard, J., Sessler, D., Ruppert, T., Davey, J., Kuijper,
A., and Kohlhammer, J. (2014). User-based visual-
IVAPP 2017 - International Conference on Information Visualization Theory and Applications
86

interactive similarity definition for mixed data objects-
concept and first implementation. In Proceedings of
WSCG, volume 22. Eurographics Association.
Bernard, J., Wilhelm, N., Kr
¨
uger, B., May, T., Schreck,
T., and Kohlhammer, J. (2013). Motionexplorer:
Exploratory search in human motion capture data
based on hierarchical aggregation. IEEE Transactions
on Visualization and Computer Graphics (TVCG),
19(12):2257–2266.
Boriah, S., Chandola, V., and Kumar, V. (2008). Simi-
larity measures for categorical data: A comparative
evaluation. International Conference on Data Mining
(SIAM), 30(2):3.
Cha, S.-H., Yoon, S., and Tappert, C. C. (2005). Enhancing
binary feature vector similarity measures.
Chopra, S., Hadsell, R., and LeCun, Y. (2005). Learning
a similarity metric discriminatively, with application
to face verification. In Computer Vision and Pattern
Recognition (CVPR), pages 539–546. IEEE.
Fogarty, J., Tan, D., Kapoor, A., and Winder, S. (2008).
Cueflik: Interactive concept learning in image search.
In SIGCHI Conference on Human Factors in Comput-
ing Systems (CHI), pages 29–38. ACM.
Frome, A., Singer, Y., Sha, F., and Malik, J. (2007). Learn-
ing globally-consistent local distance functions for
shape-based image retrieval and classification. In
Conference on Computer Vision, pages 1–8. IEEE.
G
¨
onen, M. and Alpaydın, E. (2011). Multiple kernel learn-
ing algorithms. Journal of Machine Learning Re-
search, 12(Jul):2211–2268.
Heimerl, F., Koch, S., Bosch, H., and Ertl, T. (2012). Visual
classifier training for text document retrieval. IEEE
Transactions on Visualization and Computer Graph-
ics (TVCG), 18(12):2839–2848.
H
¨
oferlin, B., Netzel, R., H
¨
oferlin, M., Weiskopf, D., and
Heidemann, G. (2012). Inter-active learning of ad-hoc
classifiers for video visual analytics. In IEEE Visual
Analytics Sc. and Technology (VAST), pages 23–32.
Janetzko, H., Sacha, D., Stein, M., Schreck, T., Keim, D. A.,
and Deussen, O. (2014). Feature-driven visual analyt-
ics of soccer data. In IEEE Visual Analytics Science
and Technology (VAST), pages 13–22.
Jeong, D. H., Ziemkiewicz, C., Fisher, B., Ribarsky, W.,
and Chang, R. (2009). iPCA: An Interactive System
for PCA-based Visual Analytics. In Computer Graph-
ics Forum (CGF), volume 28, pages 767–774. Euro-
graphics.
Kulis, B. (2012). Metric learning: A survey. Foundations
and Trends in Machine Learning, 5(4):287–364.
Malisiewicz, T., Gupta, A., and Efros, A. A. (2011). Ensem-
ble of exemplar-svms for object detection and beyond.
In Conf. on Computer Vision, pages 89–96. IEEE.
Noh, Y.-K., Zhang, B.-T., and Lee, D. D. (2010). Genera-
tive local metric learning for nearest neighbor classifi-
cation. In Advances in Neural Information Processing
Systems, pages 1822–1830.
Norouzi, M., Fleet, D. J., and Salakhutdinov, R. R. (2012).
Hamming distance metric learning. In Adv. in neural
information processing systems, pages 1061–1069.
Prud’hommeaux, E. and Seaborne, A. (2008). SPARQL
Query Language for RDF. W3C Recommendation.
Salakhutdinov, R. and Hinton, G. E. (2007). Learning a
nonlinear embedding by preserving class neighbour-
hood structure. In AISTATS, pages 412–419.
Salton, G. and Buckley, C. (1997). Improving retrieval per-
formance by relevance feedback. Readings in Infor-
mation Retrieval, 24:5.
Seebacher, D., Stein, M., Janetzko, H., and Keim, D. A.
(2016). Patent Retrieval: A Multi-Modal Visual Ana-
lytics Approach. In EuroVis Workshop on Visual Ana-
lytics (EuroVA), pages 013–017. Eurographics.
Seifert, C. and Granitzer, M. (2010). User-based active
learning. In IEEE International Conference on Data
Mining Workshops (ICDMW), pages 418–425.
Sessler, D., Bernard, J., Kuijper, A., and Kohlhammer, J.
(2014). Adopting mental similarity notions of categor-
ical data objects to algorithmic similarity functions.
Vision, Modelling and Visualization (VMV), Poster.
Settles, B. (2009). Active learning literature survey. Com-
puter Sciences Technical Report 1648, University of
Wisconsin–Madison.
Shao, L., Sacha, D., Neldner, B., Stein, M., and Schreck, T.
(2016). Visual-Interactive Search for Soccer Trajecto-
ries to Identify Interesting Game Situations. In IS&T
Electronic Imaging Conference on Visualization and
Data Analysis (VDA). SPIE.
Sneath, P. H., Sokal, R. R., et al. (1973). Numerical taxon-
omy. The principles and practice of numerical classi-
fication.
Torresani, L. and Lee, K.-c. (2006). Large margin com-
ponent analysis. In Advances in neural information
processing systems, pages 1385–1392.
Tversky, A. (1977). Features of similarity. Psychological
review, 84(4):327.
Ware, M., Frank, E., Holmes, G., Hall, M., and Witten, I. H.
(2001). Interactive machine learning: letting users
build classifiers. Human-Computer Studies, pages
281–292.
Weber, N., Waechter, M., Amend, S. C., Guthe, S., and
Goesele, M. (2016). Rapid, Detail-Preserving Image
Downscaling. In Proc. of ACM SIGGRAPH Asia.
Weinberger, K. Q. and Saul, L. K. (2009). Distance metric
learning for large margin nearest neighbor classifica-
tion. Machine Learning Research, 10:207–244.
Xing, E. P., Ng, A. Y., Jordan, M. I., and Russell, S. (2003).
Distance metric learning with application to clustering
with side-information. Advances in neural informa-
tion processing systems, 15:505–512.
Yang, L., Jin, R., and Sukthankar, R. (2007). Bayesian ac-
tive distance metric learning. In Conference on Un-
certainty in Artificial Intelligence (UAI).
Yu, J., Amores, J., Sebe, N., Radeva, P., and Tian, Q.
(2008). Distance learning for similarity estimation.
IEEE Transactions on Pattern Analysis and Machine
Intelligence (TPAMI), 30(3):451–462.
Zagoruyko, S. and Komodakis, N. (2015). Learning to com-
pare image patches via convolutional neural networks.
In Comp. Vis. and Pattern Recognition (CVPR). IEEE.
Visual-Interactive Similarity Search for Complex Objects by Example of Soccer Player Analysis
87
