
Detecting Nonlinear Acoustic Properties of Snoring Sounds
using Hilbert-Huang Transform
Tsuyoshi Mikami
1
, Satoshi Ueki
2
, Hirotaka Takahashi
2
and Kazuya Yonezawa
3
1
National Institute of Technology, Tomakomai College, Nishikioka 443, Tomakomai, Hokkaido 059-1275, Japan
2
Nagaoka University of Technology, Kamitomioka 1603-1, Nagaoka, Niigata 940-2188, Japan
3
National Hospital Organization Hakodate Hospital, Kawaharacho 18-16, Hakodate, Hokkaido 041-8512, Japan
Keywords:
Snoring Sounds, Hilbert-Huang Transform, Sleep Apnea Syndrome.
Abstract:
Since snoring is known to be related to sleep apnea syndrome, many medical/physiological researchers have
focused on the biomechanism of snoring and the acoustic properties. Snoring sounds are the mixture of the
nonlinear oscillation sounds of the oropharyngeal soft tissues and the airflow noises during inhalation. In
conventional studies, however, such properties have not been paid attention to, because there were no suitable
methods for the analysis of nonlinear and nonstationary time series data. In this paper, we adopt Hilbert-Huang
Transform (HHT) to clarify the nonlinear and nonstationary properties in a nasal snoring sound. As a result,
two types of frequency fluctuation are found in the Hilbert-Huang spectrum.
1 INTRODUCTION
Loud snoring is known to be an important sign of Ob-
structive Sleep Apnea (OSA), and thus many med-
ical/physiological researchers have focused on the
biomechanism of snoring and the acoustic properties
(surveyed in (Pevernagie D., 2010)). Snoring sounds
are the mixture of the nonlinear oscillation sounds of
the oropharyngeal soft tissues and the airflow noises
during inhalation. In addition, the dynamics is chang-
ing gradually or suddenly as time passes. This phe-
nomenon can easily be understood by seeing figure
1, where the waveform is suddenly changing and dis-
torted from a sinusoidal wave. It is natural to consider
that the snoring has strong nonlinear and nonstation-
ary properties in its sound structure.
In conventional studies, however, such properties
have not been paid attention to, because there were
no suitable methods for the analysis of nonlinear and
nonstationary data. In this paper, we adopt Hilbert-
Huang Transform (HHT) to clarify the nonlinear and
nonstationary properties in a nasal snoring sound.
2 BACKGROUND
Beck and colleagues(Beck R., 1995) identified two
dominant patterns of snoring sounds based on the
0.0 0.2 0.4 0.6 0.8
−20000 0 20000
t [s]
x(t)
Figure 1: The entire waveform of a snore episode.
(linear) acoustic properties: simple-waveform and
complex-waveform. Simple-waveform snore is a
quasi-sinusoidal waveform whose spectrum consists
of a single prominent peak at the fundamental fre-
quency and two or three harmonics, while complex-
waveform snore is characterized by multiple, equally-
spaced peaks of power (comb-like spectrum).
Quinn, et al, (Quinn S.J., 1996) found two dis-
tinct patterns of waveforms and spectra in palatal
and tongue base snoring sounds. The palatal snores
have a prominent peak corresponding to their flut-
tering mechanism, whereas the tongue base snores
are noise-like waveforms and have more higher-
frequency components. Fiz, et al, (Fiz J.A., 1996)
found that the presence of a fundamental frequency
and several harmonicsin snoring sounds of many sim-
ple snorers and a low frequency peak with the sec-
ond energy scattered on a narrower band and with-
out clearly identified harmonics in those of obstruc-
tive sleep apnea patients. Many other researchers
have also analyzed the acoustic properties of snor-
306
Mikami T., Ueki S., Takahashi H. and Yonezawa K..
Detecting Nonlinear Acoustic Properties of Snoring Sounds using Hilbert-Huang Transform.
DOI: 10.5220/0005279803060311
In Proceedings of the International Conference on Bio-inspired Systems and Signal Processing (BIOSIGNALS-2015), pages 306-311
ISBN: 978-989-758-069-7
Copyright
c
2015 SCITEPRESS (Science and Technology Publications, Lda.)

ing sounds. Especially, the formant-like spectral
peaks have been focused on for the purpose of clas-
sifying OSA patients and simple snorers (Emoto T.,
2010)(Ng A.K., 2008).
According to this, these conventional studies have
used some linear analysis methods such as FFT and
LPC, but it is quite natural to consider that snoring
is derived from a nonlinear dynamics. Beck, et al,
(Beck R., 1995) insisted that the complex-waveform
snores result from the oscillation of oropharyngeal
soft tissues with colliding of the airway wall. More-
over, it is also found that the waveforms are changing
gradually or suddenly as time passes. Such non-linear
and non-stationary dynamics are generally found in
every snoring sound, but these properties have not yet
been analyzed in more detail.
On the other hand, HHT has also been applied
to the airway pressure signals related to OSA (Salis-
bury J. I., 2007), (Caseiro P., 2010). In these studies,
the histogram of HHT spectra in a specific frequency
range is calculated for 300 seconds and used to dis-
criminate OSA from non-OSA persons. These meth-
ods are valuable, but in some points, different from
our point of view: 1. These studies did not focus on
the nonstationary properties because the time struc-
ture is ignored by calculating the histogram of HHT
spectra. One of our hypothesis is that some useful in-
formation about OSA would also be involved in the
time structure. This has not been verified in conven-
tional studies. 2. The data analyzed in these papers
are the airway pressure signals obtained from nasal
breath (Salisbury J. I., 2007) and oronasal breath (Ca-
seiro P., 2010). In contrast, we focused in this paper
on the nasal snoring sound.
3 METHOD
3.1 Subjects and Instrument
A portable linear PCM (Pulse Code Modulation)
sound recorder, Olympus LS-10, is used to record
snoring sounds. Sampling frequency and quantiza-
tion rate are set to 44.1 kHz and 16 bit respectively. A
snoring sound analyzed in this paper (shown in figure
1) is recorded from a male healthy man.
The subject is asked to simulate nasal snoring by
breathing deeply enough to oscillate the soft palate
in his throat. While producing snores, the subject’s
mouth is completely closed. Such snoring, called sim-
ulated snoring in common, is not always equivalent to
the one generated during sleep, but it has traditionally
been adopted in some medical studies.
3.2 Hilbert-Huang Transform (HHT)
The Hilbert-Huang transform (HHT), which consists
of an empirical mode decomposition (EMD) followed
by the Hilbert spectral analysis, was developed re-
cently by Huang, et al (Huang N.E., 1998). It presents
a fundamentally new approach to the analysis of time
series data. Its essential feature is the use of an adap-
tive time-frequency decomposition that does not im-
pose a fixed basis set on the data, and therefore, unlike
Fourier or Wavelet analysis, its application is not lim-
ited by the time-frequency uncertainty relation. This
leads to a highly efficient tool for the investigation of
transient and nonlinear features.
The Hilbert transform of a function h(t) is defined
by
v(t) =
1
π
P
Z
∞
−∞
h(τ)
t − τ
dτ = h(t) ∗
1
πt
, (1)
where P and ∗ denote the Cauchy principal value
of the singular integral and the convolution, respec-
tively. By the theory of the Poisson integral, F(t) =
h(t) + iv(t) is the boundary value of a holomorphic
function F(z) = F(t + iv) = a
HT
(t)e
iθ(t)
in the up-
per half-plane, if h(t) ∈ L
p
(the Lebesgue space for
1 < p < ∞). Then the instantaneous amplitude (IA)
a
HT
(t) and the instantaneous frequency (IF) f
HT
(t) is,
respectively, defined by
a
HT
(t) =
q
h(t)
2
+ v(t)
2
, (2)
and
f
HT
(t) =
1
2π
dθ(t)
dt
, where θ(t) = tan
−1
v(t)
h(t)
.
(3)
However, for h(t) /∈ L
p
, the IF obtained using the
above method is not necessarily physically meaning-
ful. For example, h(t) = cosωt + C, where C and ω
are constants, does not yield a constant frequency of
ω. To explore the applicability of the Hilbert trans-
form, Huang, et al, (Huang N.E., 1998) showed that
the necessary conditions to define a meaningful IF
are that the functions are symmetric with respect to
the local zero mean and have the same numbers of
zero crossings and extrema. Thus they applied the
empirical mode decomposition (EMD) to the original
data h(t) to decompose it into intrinsic mode func-
tions (IMFs) and the residual. Each IMF satisfies the
following conditions: (1) in the whole data set, the
number of extrema and the number of zero crossings
must either equal or differ at most by one; and (2) at
any point, the mean value of the envelope defined by
the local maxima and the envelope defined by the lo-
cal minima is zero. The EMD is a series of high-pass
DetectingNonlinearAcousticPropertiesofSnoringSoundsusingHilbert-HuangTransform
307

• h
1
(t) = h(t)
• for i = 1 to i
max
⊲ h
i,
1
(t) = h
i
(t)
⊲ for k = 1 to k
max
◦ Identify the local maxima and minima of h
i,k
(t)
◦ U
i,k
(t) = the upper envelope joining the local maxima using
a cubic spline
◦ L
i,k
(t) = the lower envelope joining the local minima using
a cubic spline
◦ m
i,k
(t) = (U
i,k
(t) + L
i,k
(t))/2
◦ h
i,k+1
(t) = h
i,k
(t) − m
i,k
(t)
Exit from the loop k if a certain stoppage criterion, which will be
described below.
⊲ IMF
i
(t) = c
i
(t) = h
i,k
(t)
⊲ h
i+1
(t) = h
i
(t) − c
i
(t)
• residual: r(t) = h
i
max
+1
(t)
Figure 2: Outline of EMD sifting algorithm.
filters in a sense. The algorithm is summarized in fig-
ure 2.
The approximate local envelope symmetry condi-
tion of EMD is called the stoppage criterion. Sev-
eral different types of stoppage criterion have been
adopted. In this paper, we use S type of stoppage cri-
terion proposed in (Huang N.E., 2003).
The parameter i
max
in figure 2 specifies the num-
ber of IMFs to be extracted from h(t), which is usu-
ally based on the characteristics of the signal. The pa-
rameter k
max
must be sufficiently large, several thou-
sand or more, since it determines when the mode de-
composition stops even if the stoppage criterion has
not been satisfied.
As the results of EMD, the original data are de-
composed into i
max
IMFs and a residue, r
i
max
(t), which
can be either the adaptive local median or trend:
h(t) =
i
max
∑
i=1
c
i
(t) + r
i
max
(t). (4)
EMD can be applied to observed data in order to
decompose it into signal and noise. In the original
form of EMD, however, mode mixing frequently ap-
pears. By definition, mode mixing occurs either when
a single IMF consists of signals of widely disparate
scale, or when signals of a similar scale reside in dif-
ferent IMF components. It is a consequence of signal
intermittency, which can not only cause serious alias-
ing in the time-frequency distribution, but can also
make the individual IMFs devoid of physical mean-
ing. To overcome this drawback, Wu and Huang (Wu
and Huang, 2005) proposed ensemble EMD (EEMD),
which defines the true IMF components as the mean
of an ensemble of trials, each consisting of the signal
plus a white (Gaussian) noise of finite standard devi-
ation (finite amplitude).
The EEMD algorithm contains the following
steps: (a) Add a white (Gaussian) noise with the stan-
dard deviation σ
e
to the targeted data; (b) Decompose
the data with added white noise into IMFs; (c) Repeat
steps (a) and (b) multiple times but with a different
white (Gaussian) noise series each time; (d) Obtain
the ensemble means of the corresponding IMFs of the
decompositions. The number of trials, N
e
, must be
large.
The HSA derives the instantaneous amplitude
(IA
i
(t)) and frequency (IF
i
(t)) from the each IMF
c
i
(t) obtained by EEMD.
3.3 Parameter Setting
There are some parameters to be fixed in the EEMD.
In this paper, we choose the parameters for the EEMD
as follows : the stoppage criterion S = 4, the standard
deviation of the Gaussian noise in EEMD σ
e
= 10
−5
and the size of ensemble N
e
= 200. As for N
e
, we
verified that the results hardly change even with N
e
>
100 but the value N
e
≈ 50 is too small.
Since c
1
(t) and c
2
(t) in EEMD contain only noise,
we specify i
max
= 10 in this paper.
4 RESULTS
Figure 1 shows a snoring sound analyzed in this paper.
It can be seen that the waveform is changing dynam-
ically as time passes. The periodic waveform occurs
suddenly at 0.5 seconds, and then it is gradually de-
formed to non-periodic, noise-like patterns.
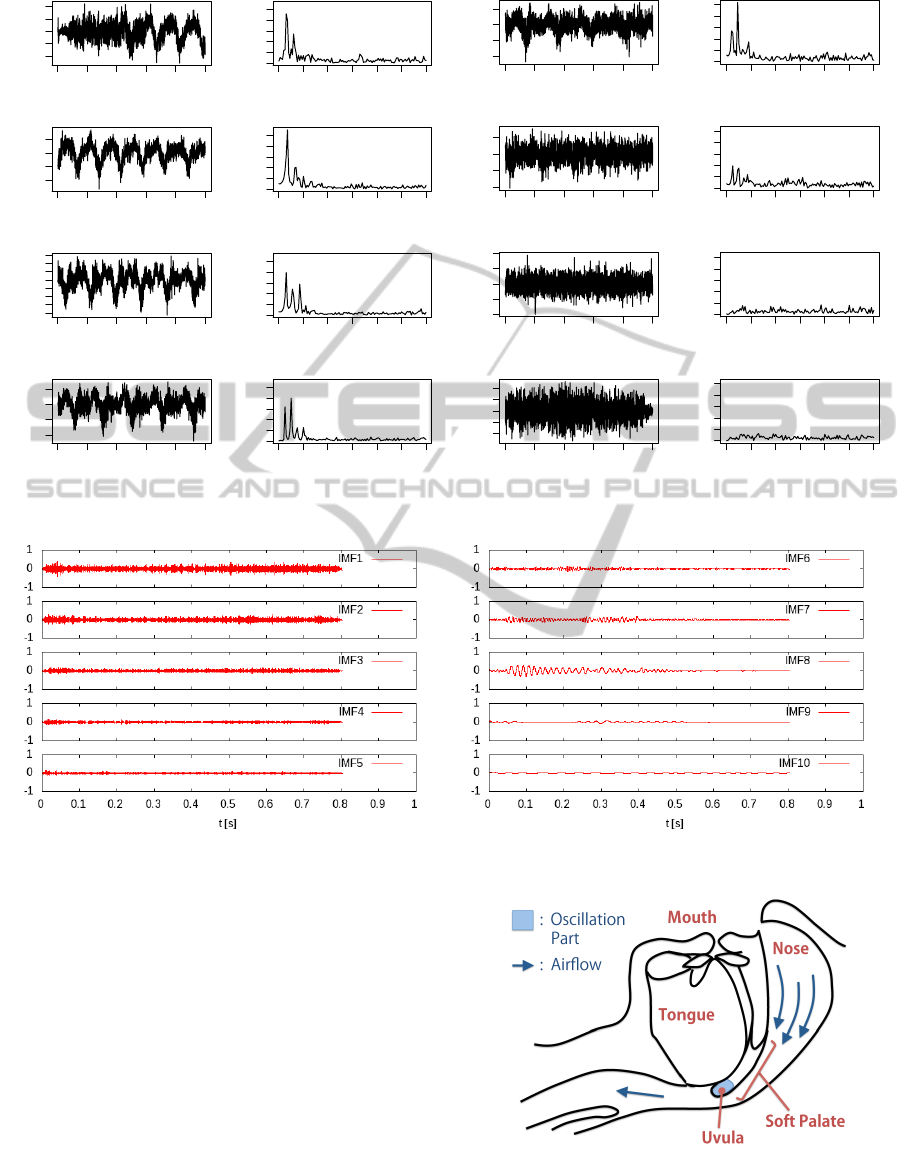
Firstly, the short time subsequences are extracted
from this data and their FFT amplitude spectra are
calculated (see figure 3). According to this figure, a
single prominent peak exists at the fundamental fre-
quency (around 30-50Hz) and a few harmonic peaks
are found during the first 0.2 seconds. But after then
the second and/or third peaks become competitive
with the first one and thus the waveform becomes
more complex. After 0.5 seconds, no such spectral
peaks are found and the spectral distribution becomes
flat. This is all we can know from the FFT spectra.
Figure 4 shows the 10 IMFs obtained from the
snoring sound shown in figure 1. The oscillation in
the IMF8 is emerged at 0.05 seconds and is gradu-
ally decreasing. On the other hand, the oscillation in
the IMF9 is emerged at about 0.2 seconds. Both are
nearly disappeared after 0.5 seconds. In general, nasal
snoring sounds are known to be the oscillation of only
the uvula(Liistro G., 1991) (see figure 5). According
to the IMF8 and 9, however, there is a high possibil-
ity that the IMF8 indicates the dominant oscillation
generated from the uvula and the other source of the
oscillation is also found in the IMF9 after 0.2 seconds.
Figure 6 shows the HHT spectra which shows the
instantaneous frequency (vertical axis) and amplitude
BIOSIGNALS2015-InternationalConferenceonBio-inspiredSystemsandSignalProcessing
308
0.00 0.02 0.04 0.06 0.08 0.10
−20000 20000
t [s]
x(t)
0 200 600 1000
0e+00 8e+06
f [Hz]
|X(f)|
0.10 0.12 0.14 0.16 0.18 0.20
−20000 10000
t [s]
x(t)
0 200 600 1000
0e+00 8e+06
f [Hz]
|X(f)|
0.20 0.22 0.24 0.26 0.28 0.30
−20000 0
t [s]
x(t)
0 200 600 1000
0e+00 8e+06
f [Hz]
|X(f)|
0.30 0.32 0.34 0.36 0.38 0.40
−20000 0
t [s]
x(t)
0 200 600 1000
0e+00 8e+06
f [Hz]
|X(f)|
0.40 0.42 0.44 0.46 0.48 0.50
−20000 0
t [s]
x(t)
0 200 600 1000
0e+00 4e+06
f [Hz]
|X(f)|
0.50 0.52 0.54 0.56 0.58 0.60
−20000 0
t [s]
x(t)
0 200 600 1000
0e+00 4e+06
f [Hz]
|X(f)|
0.60 0.62 0.64 0.66 0.68 0.70
−20000 0 20000
t [s]
x(t)
0 200 600 1000
0e+00 4e+06
f [Hz]
|X(f)|
0.70 0.72 0.74 0.76 0.78 0.80
−10000 10000
t [s]
x(t)
0 200 600 1000
0e+00 4e+06
f [Hz]
|X(f)|
Figure 3: The 0.2-second subsequences from the snore1 and the respective FFT amplitude spectra.
Figure 4: The 10 IMFs estimated from the snoring sound shown in figure 1.
(colored indication) of the IMF4-10 shown in figure 4.
From 0.1 to 0.25 seconds, it is easily recognized that
the instantaneous frequency of the IMF8 is fluctuated
sinusoidally in accordance with the fundamental fre-
quency. From 0.27 to 0.4 seconds, the snore dynamics
seems to be stationary because of their periodic wave-
forms in the time domain. But according to the panels
in figure 6 we can clearly recognize that the instanta-
neous frequency becomes high and the corresponding
amplitude becomes low at around 0.285, 0.335 and
0.38 seconds (dotted rectangle in the panels). Namely,
the periodic property is deteriorated during very short
time. Such phenomenon is emerged at the rate of one
out of two periods. The results described above can-
not be seen at all in the FFT spectra.
Figure 5: The oscillation parts of nasal snores.
DetectingNonlinearAcousticPropertiesofSnoringSoundsusingHilbert-HuangTransform
309
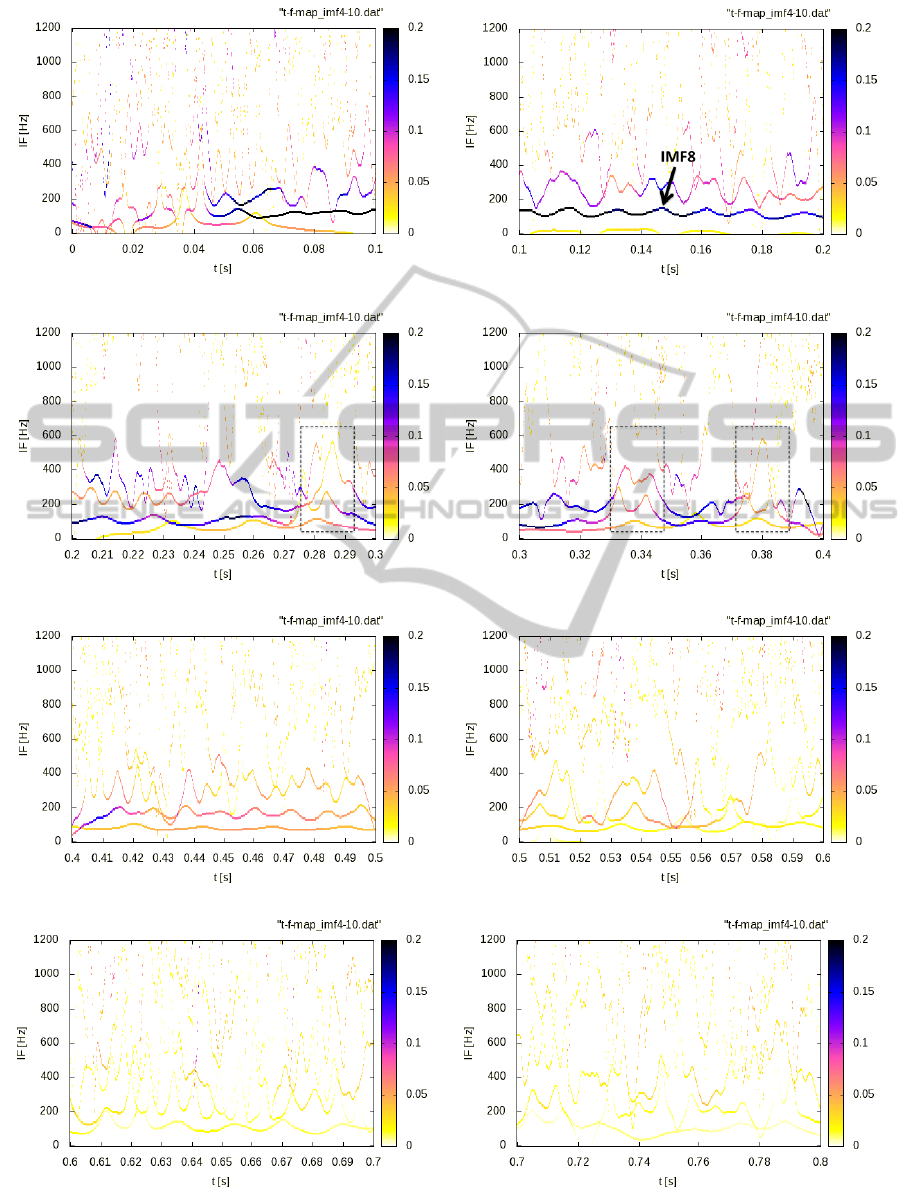
Figure 6: The instantaneous frequency and amplitude of IMF4-10 during 0.8 seconds.
BIOSIGNALS2015-InternationalConferenceonBio-inspiredSystemsandSignalProcessing
310

5 DISCUSSION
The harmonic components in the FFT amplitude spec-
trum are generally found in nonlinear oscillation dy-
namics. For example, the sound of rotary machines in
a normal condition consists of a single spectral peak
in the frequency domain, but in a deteriorated con-
dition it also contains some harmonic spectral peaks
under the influence of the collision between stationary
and rotary parts. From a biomechanical point of view,
Liistro and Prota (Liistro G., 1991) clarified that oral
snores (many of them tend to have some harmonic
peaks) are generated by the oscillation of the whole
soft palate. In addition, Beck and Odeh (Beck R.,
1995) reported that the harmonic spectral peaks are
caused by the collision of the airway walls. This is
similar to the mechanism of the deteriorated rotary
machines.
But, in the case of snores, not only the oscilla-
tion parts (soft palate and/or uvula) but also the sta-
tionary parts (airway walls) are covered by mucous
membrane and always wet with sticky saliva. Such
property affects the viscoelasticity of the oscillation
parts and thus the oscillation with nonlinear collision
mechanism seems to become more complex. More-
over, since the oscillation occurs only when the gas
pressure during inhalation reaches a critical value, the
inhalation strength (not always constant) may cause
the nonstationary oscillation. Our results in section 6
may be explained by such biomechanism, but the va-
lidity should be verified from various points of view.
In general, it is said that the patients with OSAS
tend to snore very loudly during sleep, because the
oscillation parts (the soft palate and/or the tongue)
are enlarged by obesity, which is a major risk fac-
tor of OSAS. The nonstationary oscillation of the
enlarged parts with complex collision mechanism
should, therefore, be focused on to clarify the OSAS-
related acoustic properties of snoring sounds. In the
future, it is necessary to develop a theoretical model
to explain the nonlinear and nonstationary spectra of
snoring sounds obtained by HHT and to clarify the re-
lation to a physiological mechanism of the snores in
OSAS patients.
6 CONCLUSION
In this paper, the nonlinear and nonstationary acoustic
properties found in a nasal snoring sound is clarified
using HHT. One is that the instantaneous frequency
of the dominant oscillation (IMF8) is fluctuated si-
nusoidally in accordance with the fundamental fre-
quency. And the other is that the periodic properties
are deteriorated during very short time at the rate of
one out of two periodic cycle of the waveform. These
properties cannot be seen in the FFT spectra.
In the future, it is necessary to develop a theoreti-
cal model to explain such phenomena from a physio-
logical point of view.
ACKNOWLEDGEMENT
This study is supported by Grant-in-Aid for Cooper-
ative Research Project between National Institute of
Technology and Nagaoka University of Technology.
REFERENCES
Beck R., et al. (1995). The acoustic properties of snores.
Eur Respir J, 8:pp.2120–2128.
Caseiro P., et al. (2010). Screening of obstructive sleep
apnea using hilbert-huang decomposition of oronasal
airway pressure recordings. Med Eng & Phys,
32:pp.561–568.
Emoto T., et al. (2010). Discriminating apneic snorers and
benign snorers based on snoring formant extracted via
a noise-robust linear prediction technique. Trans Jpn
Soc Med Bio Eng, 48(1):115–121.
Fiz J.A., et al. (1996). Acoustic analysis of snoring sound
in patients with simple snoring and obstructive sleep
apnoea. Eur Respir J, 9(11):2365–2370.
Huang N.E., et al. (1998). The empirical mode decompo-
sition and the hilbert spectrum for nonlinear and non-
stationary time series analysis. Proc. R. Soc. London,
Ser. A, 454:pp.903–993.
Huang N.E., et al. (2003). A confidence limit for the posi-
tion empirical mode decomposition and hilbert spec-
tral analysis. volume 459, pages pp.2317–2345.
Liistro G., et al. (1991). Pattern of simulated snoring is
different through mouth and nose. J Appl Physiol,
70(6):2736–2741.
Ng A.K., et al. (2008). Could formant frequencies of snore
signals be an alternative means for the diagnosis of
obstructive sleep apnea? Sleep Med, 9(8):894–898.
Pevernagie D., et al. (2010). The acoustics of snoring. Sleep
Med Rev, 14(2):pp.131–144.
Quinn S.J., et al. (1996). The differentiation of snoring
mechanisms using sound analysis. Clin Otolaryngol,
21:119–123.
Salisbury J. I., et al. (2007). Rapid screening test for sleep
apnea using a nonlinear and nonstationary signal pro-
cessing technique. Med Eng & Phys, 29:pp.336–343.
Wu, Z. and Huang, N. E. (2005). Ensemble empirical mode
decomposition: A noise assisted data analysis method.
DetectingNonlinearAcousticPropertiesofSnoringSoundsusingHilbert-HuangTransform
311
