
YEAST METABOLIC STATE IDENTIFICATION BY FIBER OPTICS
SPECTROSCOPY
C. C. Castro
1
, J. S. Silva
1
, V. V. Lopes
2
, R. C. Martins
3 ∗
1
IBB - Institute for Biotechnology and BioEngineering, Universidade do Minho
Campus de Gualtar, 4710-057 Braga, Portugal
2
INETI - Instituto Nacional de Engenharia Tecnologia e Inovac¸˜ao
Estrada do Pac¸o do Lumiar, 22, 1649-038 Lisboa
3
BioInformatics - Molecular and Environmental Biology Research Center, Universidade do Minho
Campus de Gualtar, 4710-057 Braga, Portugal
Keywords:
Saccharomyces cerevisiae, Morphology, LWUV-VIS-SWNIRreflectance spectroscopy, Singular value decom-
position, Classification.
Abstract:
In this manuscript we explore the feasibility of using LWUV-VIS-SWNIR (340 - 1100 nm) spectroscopy
to classify Saccharomyces cerevisiae colony structures in YP agar and YPD agar, under different growth
conditions, such as: i) no alcohol; ii) 1 % (v/v) Ethanol; iii) 1 % (v/v) 1-Propanol; iv) 1 % (v/v) 1- butanol;
v) 1 % (v/v) Isopropanol; vi) 1 % (v/v) (±)-1-Phenylethanol; vii) 1 % (v/v) Isoamyl alcohol; viii) 1 % (v/v)
tert-Amyl alcohol (2-Methyl-2-butanol); and ix) 1 % (v/v) Amyl alcohol. Results show that LWUV-VIS-
SWNIR spectroscopy has the potential for yeasts metabolic state identification once the spectral signatures
of colonies differs from each others, being possible to acheive 100% of classification in UV-VIS and VIS-
SWNIR. The UV-VIS region present high discriminant information (350-450 nm), and different responses to
UV excitation were obtained. Therefore, high precision is obtained because UV-VIS and VIS-NIR exhibit
different kinds of information. In the future, high precision analytical chemistry techniques such as mass
spectroscopy and molecular biology transcriptomic studies should be performed in order to understand the
detailed cell metabolism and genomic phenomena that characterize the yeast colony state.
1 INTRODUCTION
Recent studies show that S. cerevisiae can form com-
plex colony structures with an apparent cell special-
ization. Colonies of wild yeasts can contain all the
varieties of cells, from which the mostly known are
the diploid, haploid, hyphae form (diploid or haploid)
and ascus (spore); opposing to the most well known
yeast cell cycle - the budding yeast. Furthermore, it
is known that S. cerevisiae can undergo changes in
their replicative patterns and morphologies, accord-
ing to environmental conditions (i.e., deleterious), to
produce elongated cells joined-together in filaments
(Dickinson, 2008) and colonies can signal each other
(Palkova and Vachova, 2003).
The yeast-form and filamentous-form cell cycles
are similar but, according to (Kron and Gow, 1995), in
yeast-form growth, daughter cells are smaller than its
mother and must undergo a period of further growth
(in phase G1) before starting a new cell cycle (asym-
∗
Corresponding author: rui.martins@bio.uminho.pt
metric cell division). On the other hand, filament-
form cells have a symmetric cell division, once after
mitosis and cell division, both mother and daughter
cells are equal-sized and bud emerge starts in both
cells. Furthermore mitochondrial mass and chitin
deposition increases in filament form. The filament
form cellular walls have a greater strength and rigid-
ity than most of the other yeast forms, which has been
suggested as a mean of penetration on solid media
because of the yeast lack of natural mobility. The
transcription of all of genes also decreases in filament
forming yeast, and therefore has been proven difficult
to find a direct transcriptomic relationship (Dickin-
son, 2008). Filament formation can be induced by
nitrogen starvation or limitation (Rua et al., 2001),
growth on a poor nitrogen source (Dickinson, 1994)
or growth in the presence of low concentrations of
fusel alcohols (end-products of cells catabolism). In
the case of nitrogen starvation or limitation, filamen-
tation can be explained as a foraging response be-
cause yeast is non-motile and cannot move to search
169
C. Castro C., S. Silva J., V. Lopes V. and C. Martins R. (2009).
YEAST METABOLIC STATE IDENTIFICATION BY FIBER OPTICS SPECTROSCOPY.
In Proceedings of the International Conference on Bio-inspired Systems and Signal Processing, pages 169-178
DOI: 10.5220/0001551201690178
Copyright
c
SciTePress
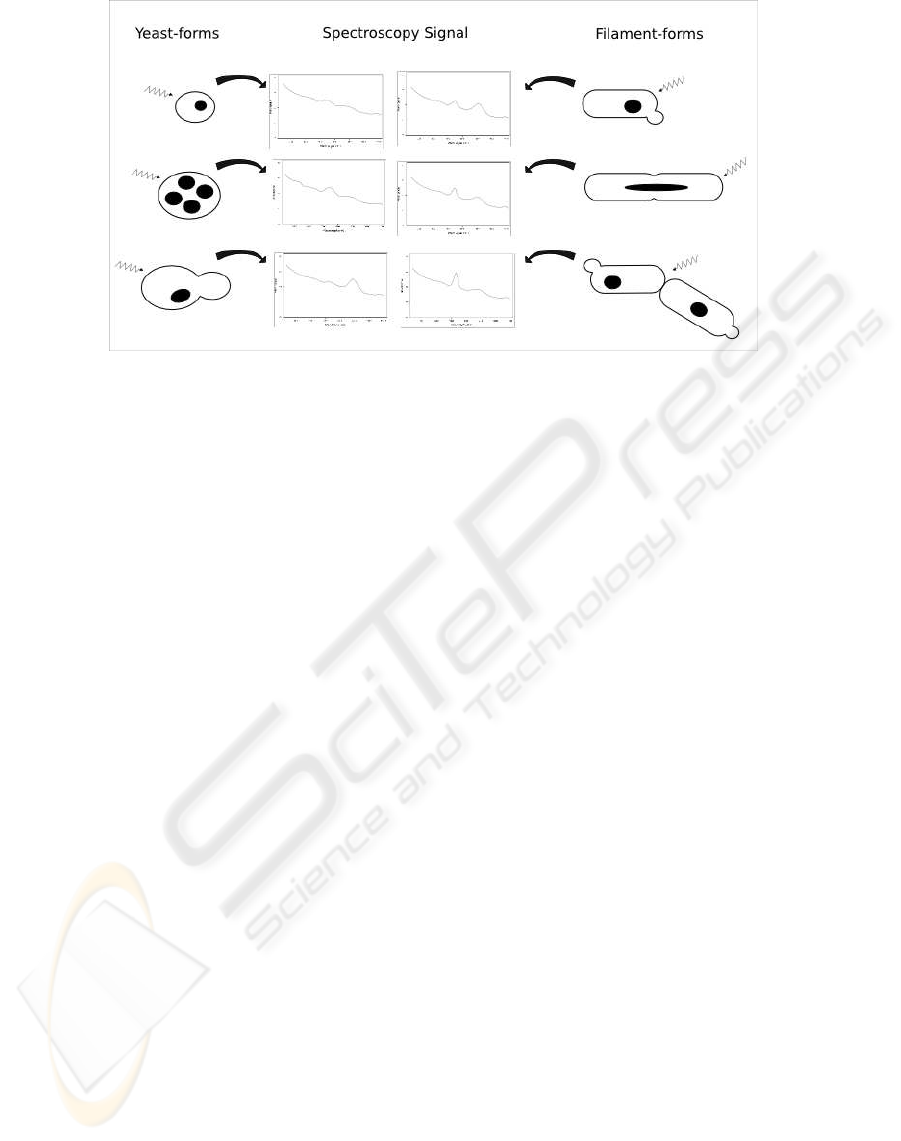
Figure 1: Spectroscopy signalling of different yeast structures.
for a richer supply of nutrients, it can only grow to
explore its surroundings (Gimeno et al., 1992). Fil-
amentation has also been induced by superior alco-
hols and AMPc, and has been argued that these may
act as communication molecules between different
yeast, allowing for the colony to synchronize its de-
velopment, a phenomena known as quorum-sensing.
Therefore, the yeast colony state and its dynamics is
not yet explained. In order to understand this phe-
nomena, an non-targeted, holistic and high-output ap-
proach is needed in order to gather the maximum in-
formation as possible to understand colony dynamics
and yeast communication. In this sense, the use of
spectroscopy, in conjunction with other techniques,
allows to implement real-time and non-destructive
methodologies that can explain the transcriptomics
and metabolomics processes happening in yeast cel-
lular communities.
Microorganismstraditional identification methods
are supported by morphological and growth capac-
ity in selective media (Gerard et al., 2006). The use
of high-output methodologies to increase analysis ca-
pacity, such as mass spectroscopy, PCR and spec-
troscopy are becoming popular, not only because of
the time needed for an effective identification, but
more importantly because these methods are multi-
variate, which allows to obtain vast amounts of infor-
mation in one measurement (Rosah et al., 2005).
Spectroscopy is a simple, precise, rapid, multi-
variate and non-destructive technique. Spectra is pro-
portional to the chemical composition of the analite,
acting as a non-destructive methodology capable of
both fingerprint and quantifications. In this case,
spectroscopy is may be able to classify the invari-
able structure of yeast, the metabolism and cell com-
munication. Cells morphology is a visible expres-
sion of microorganisms physiology and metabolism
(Treskatis et al., 1997). Different morphologies char-
acterize different proteomic composition and different
metabolism states that can be differentiated by UV-
VIS-SWNIR spectroscopy.
Many spectroscopy techniques have been used for
microorganisms identification, where NIR and Ra-
man spectroscopy are the most popular (Stuart, 2004;
Dziuba et al., 2007; Bhatta et al., 2005). Recently, a
previous study revealed that UV-VIS-SWNIR is also
a highly accurate spectroscopy method for microor-
ganisms identification (Silva et al., 2008). UV spec-
troscopy records electronic transitions between elec-
tron energy levels from molecular levels in the UV-
VIS region depend upon the energy involved. For
any molecular bound (sharing a pair of electrons),
orbitals are a mixture of two contributing orbitals σ
and π, with corresponding anti-bounding orbitals σ
∗
and π
∗
, respectively. Some chemical bounds present
characteristic orbital conditions, ordered by higher to
lower order energy transitions: i) alkanes (σ → σ
∗
;
150nm); ii) carbonyls (σ → π
∗
; 170nm); iii) unsat-
urated compounds (π → π
∗
; 180nm); iv) molecular
bounds to O, N, S and halogens (n → σ
∗
; 190nm);
and v) carbonyls (n → π
∗
; 300nm). As most UV-
VIS spectrometers yield a minimum wavelength of
200nm, this technique has been considered to pro-
vide lower information in terms of functional groups
when compared to IR, because spectral differences
mostly attributed to conjugated π → π
∗
and n → π
∗
transitions (Levine, 1975; Denney and Sinclair, 1987;
Perkauparus et al., 1994).
Many organic molecules present conjugated
unsaturated and carbonyls bounds, such as
aminoacids, phospholipids, free fatty acids, phe-
nols and flavonoids, peroxides, peptides and proteins,
BIOSIGNALS 2009 - International Conference on Bio-inspired Systems and Signal Processing
170
sugars and their polymers absorb in these bands. UV-
VIS not only records the effect of electron excitation,
but also the effect of return to lower orbitals, which
result in vibrational and rotational modes, increasing
the characteristic spectra of biological materials.
This effect enhances photochemical reactions and
fluorescence which are important features for micro-
biological identification (Levine, 1975; Coyle, 1989;
Klessinger and Michl, 1995) and help to identify
metabolic states of yeast. Many biological molecules
also present chromophore groups, which increase
the absorption in the UV-VIS region, such as: nitro,
nitroso, azo, azo-amino, azoxy, carbonyl and thio-
carbonyl (Coyle, 1989; Klessinger and Michl, 1995).
Moreover the sensitivity of today’s spectrometers
has highly increased, being possible to obtain low
noise to signal ratios which expands the detection
limits (Optics, 2006). LWUV-VIS-SWNIR has as
main advantages the minimization of liquid water
absorbance and effect of temperature. Furthemore,
as state of the art spectrometers also include high
frequency vibrational infrared (SWNIR), it is also
possible to obtain important information on water,
fats and proteins (Burns and Ciurczak, 2001; Devices,
2005).
The main objective of this exploratory work is to
determine if UV-VIS-SWNIR is a suitable methodol-
ogy that may be used to recognize the state of S. cere-
visiae colonies by spectral signal processing to obtain
discrimination among different induced metabolism,
cellular communication, morphology and growth me-
dia.
2 MATERIALS AND METHODS
2.1 Sample Preparation
Saccharomyces cerevisiae wild type was obtained
from the microbiological collection of the IBB - In-
stitute for Biotechnology and BioEngineering at the
University of Minho.
The incubation was performed in YPD broth
medium (Sigma Aldrich - ref. Y1375) during 12
hours at 25
o
C under constant agitation (250 rpm).
Wild type yeast (20 µl) was inoculated on the surface
of YP and YPD agar mediums using different growth
conditions, such as: without alcohol and with 1 %
(v/v) of an alcohol and was incubated at 25 C dur-
ing 144 h. Studied alcohols were: Ethanol (Riedel-
de Han - ref. 32221), 1-Propanol (Sigma Aldrich
- ref. 538000), 1- Butanol (Sigma Aldrich - ref.
BT105), Isopropanol (Sigma Aldrich - ref. 190764),
(±)-1-Phenylethanol (Fluka - ref 09449), Isoamyl al-
(a) (b)
(i) (j)
(c) (d)
(e) (f) (g) (h)
(m) (n)
(k) (l)
(o) (p)
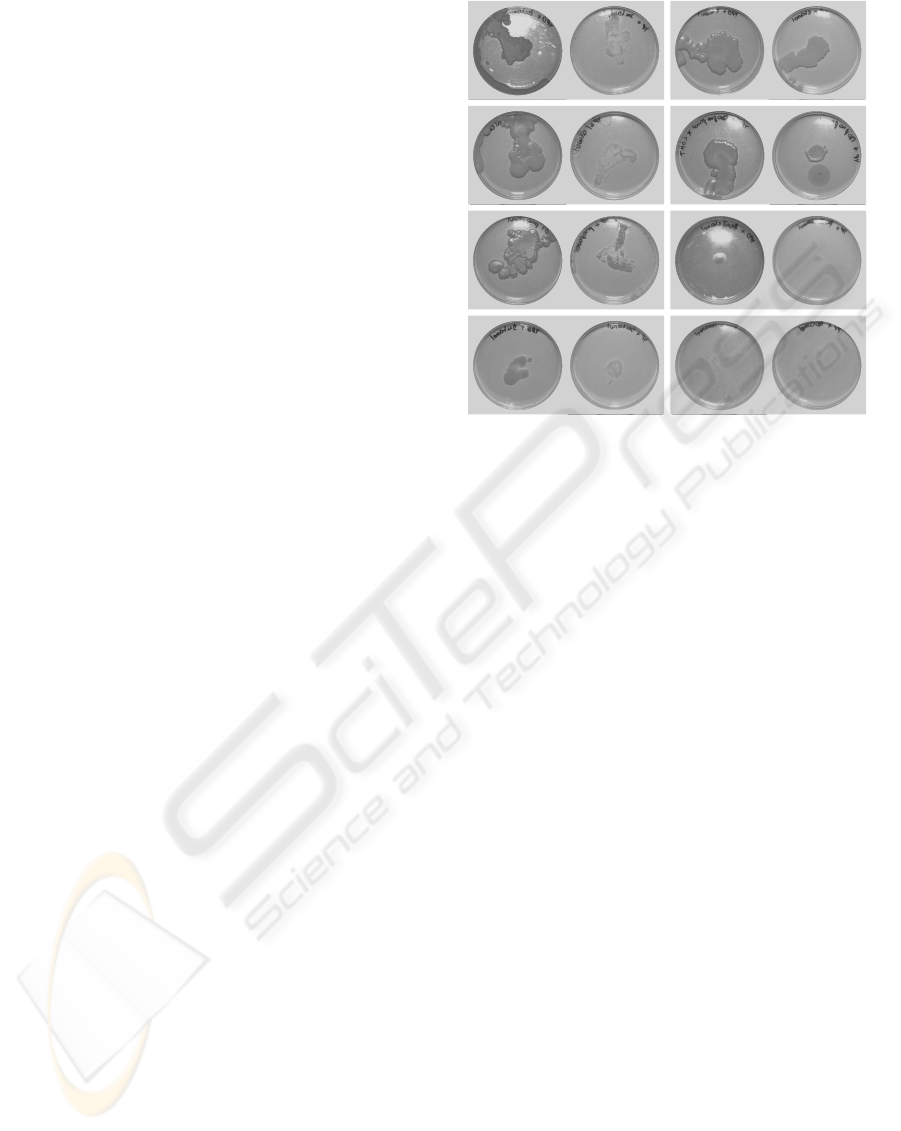
Figure 2: (a) YPD tert-amylOH; (b) YP tert-Amyl; (c) YPD
Ethanol; (d) YP Ethanol; (e) YPD without alcohol; (f) YP
without alcohol; (g) YPD Isopropanol; (h) YP Isopropanol;
(i) YPD Propanol; (j) YP Propanol; (k) YPD Phenylethanol;
(l) YP Phenylethanol; (m) YPD Butanol; (n) YP Butanol;
(o) YPD Isoamyl; (p) YP Isoamyl.
cohol (SAFC - ref. W205710), tert-Amyl alcohol
(2-Methyl-2-butanol) (Sigma Aldrich - ref. 152463)
and Amyl alcohol (SAFC - ref. 205605) (Sigma-
Aldrich Quimica, 2008).
Growth medium present the following consti-
tutions: YPD broth medium (Sigma-Aldrich ref.
Y1357): 10 g.l
−1
Yeast extract , 20 g.l
−1
Peptone and
20 g.l
−1
Glucose (Sigma-Aldrich Quimica, 2008);
YP agar: 10 g.l
−1
Yeast extract (Fluka - ref. 70161),
20 g.l
−1
Peptone (Bacto
TM
- ref. 211677) and 15
g.l
−1
Agar (Fluka ref. 05039) and YPD agar medium
(Sigma Aldrich - ref. Y1500): 10 g.l
−1
Yeast extract ,
20 g.l
−1
Peptone, 15 g.l
−1
Agar and 20 g.l
−1
Glucose
(Sigma-Aldrich Quimica, 2008).
Both agar medium were prepared according to the
indications of the manufacturer: i) suspension of the
dehydrated media in purified water (amounts defined
by the manufacturer); ii) heating of the media, with
frequent agitation, until complete dilution; iii) auto-
clave of the mixture at 121
o
C for 15 minutes; and iv)
shed in petri plate (Sigma-Aldrich Quimica, 2008).
2.2 Spectroscopy
Saccharomyces cerevisiae UV-VIS-SWNIR spec-
troscopy was performed with: i) Avantes multi-
channel fiber optic spectrometer AvaSpec-2048-4-
DT (200 to 1100 nm; 2048 pixel) (Avantes, 2007);
ii) reflection UV-VIS and VIS-SWNIR probes,
YEAST METABOLIC STATE IDENTIFICATION BY FIBER OPTICS SPECTROSCOPY
171
300 350 400 450 500 550
0 1 2 3 4
(a)
Wavelength (nm)
Absorbance
300 350 400 450 500 550
−0.04 −0.02 0.00 0.02 0.04 0.06
(b)
Wavelength (nm)
First Derivative
500 600 700 800 900 1000 1100
0 1 2 3 4
(c)
Wavelength (nm)
Absorbance
500 600 700 800 900 1000 1100
−0.010 −0.005 0.000 0.005 0.010
(d)
Wavelength (nm)
First Derivative
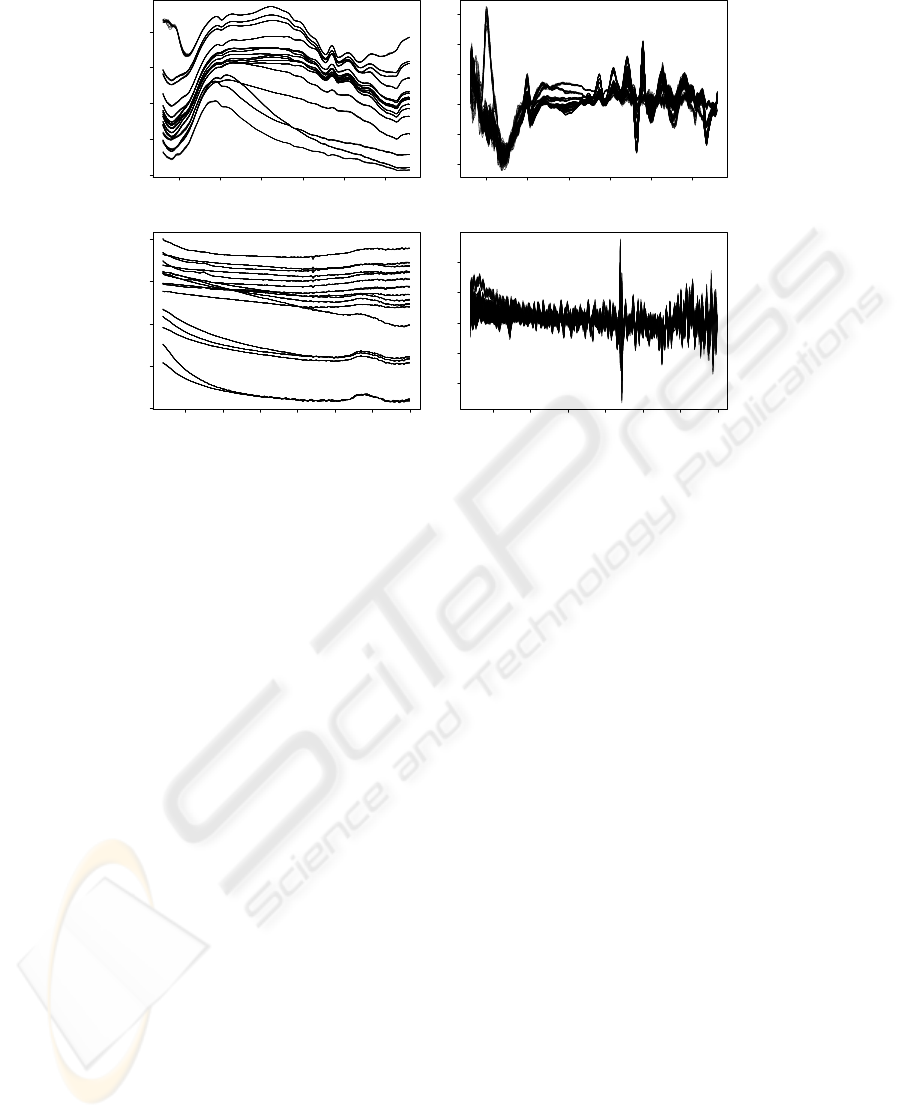
Figure 3: Microorganisms spectra: (a) Absorbance spectrum LWUV-VIS; (b) First derivative spectrum LWUV-VIS; (c)
Absorbance spectrum VIS-SWNIR; (d) First derivative spectrum VIS-SWNIR.
models FCR-7UV200-2ME and FCR-7IR200-2-ME
(Avantes, 2007); and iii) a balanced deuterium-
tungsten halogen light source, model DH-2000-BAL
(Micropack, 2008). AvaSoft 6.0 was used to con-
trol the spectrometer and data acquisition (Avantes,
2007).
Spectra were obtained at the room temperature of
18 ±2
o
C and the light source in (a) UV-VIS: the deu-
terium lamp was let to stabilize during 20 min; and
(b) VIS-NIR: the tungsten lamp lamp was let to sta-
bilize during 15 min. The dark spectra was recorded
and measurements were taken with linear and elec-
tric dark correction. Both light spectra were moni-
tored by statistically assessing the reproducibility of
the light source with measurements of light during
the several days of the experiment. Twenty spectra
replicates were recorded of UV-VIS and VIS-SWNIR
measurement of both plate count agar and microor-
ganisms colonies to study scattering effects. Further-
more, spectra were obtained inside a box designed to
isolate the environmental light and maintain the probe
horizontally.
2.3 Spectral Analysis
2.3.1 Robust Mean Scattering Correction
The collected spectrum were smoothed by using a
Savisky-Golay filter (length = 4, Order= 2) (Sav-
itzky and Golay, 1964) and afterwards, was pre-
processed using a modified robust multiplicative scat-
ter correction algorithm (RMSC) (Gallager et al.,
2005; Martens and Stark, 1991; Martens et al., 2003):
x
corr
= xb + a. The a and b are computed by mini-
mizing the following error: e
j
= bx
j
+a− x
ref
; where
the x
j
is the j sample spectrum and x
ref
is the growth
media spectrum.
The RMSC algorithm is based on the application
of the robust least squares method to determine the
a and b matrices, ensuring that spectral areas that do
not correspond to scattering artifacts are not taken into
consideration. The robust least squares algorithm is
implemented by the re-weighted least squares with
the weights computed using the Huber function. The
algorithm high breakdownpoint (50%) means that ex-
istent outliers will not distort the model fitting (eq. ??)
and thus, the a and b scatter correction parameters are
determined using only the consistent spectral areas.
The iterative algorithm can be described, briefly as
follow: 1) set the reference spectrum (x
ref
) equal to
the sample spectrum closest to the median spectrum;
2) correct the remaining sample spectrum by applying
the above described robust least squares procedure;
and 3) recompute the median spectrum and iterate un-
til convergence.
2.3.2 Singular Value Decomposition
Singular value decomposition (SVD) is a blind signal
decomposition technique widely used in spectroscopy
data, where the corrected spectrum (x
corr
) is decom-
BIOSIGNALS 2009 - International Conference on Bio-inspired Systems and Signal Processing
172
−0.2 −0.1 0.0 0.1 0.2 0.3 0.4
−0.06 −0.04 −0.02 0.00 0.02 0.04
−0.15
−0.10
−0.05
0.00
0.05
0.10
PC1 (53.7 %)
(a)
PC2 (32.6 %)
PC3 (3.8 %)
$
$
$
$
$
$
$
$
$
$
$
$
$
$
$
$
$
$
$
$
(1)
(1)−
(2)
(2)−
YP Butanol
YP Control
YPD Butanol
YPD Control
YPD Ethanol
YPD Phenylethanol
YPD Isopropanol
YPD Propanol
YPD /Alcohol
YPD tert−Amyl
YP Ethanol
YP Phenylethanol
YP Isoamyl
YP Isopropanol
YP Propanol
YP /Alcohol
YP tert−Amyl
−0.02 0.00 0.02 0.04 0.06
−0.020−0.015−0.010−0.005 0.000 0.005 0.010
−0.020
−0.015
−0.010
−0.005
0.000
0.005
0.010
0.015
(b)
PC1 (63.8 %)
PC2 (14.0 %)
PC3 (2.5 %)
$
$
$
$
$
$
$
$
$
$
$
$
$
$
$
$
$
$
$
$
(1)
(1)−
(2)
(2)− YP Butanol
YP Control
YPD Butanol
YPD Control
YPD Ethanol
YPD Phenylethanol
YPD Isopropanol
YPD Propanol
YPD /Alcohol
YPD tert−Amyl
YP Ethanol
YP Phenylethanol
YP Isoamyl
YP Isopropanol
YP Propanol
YP /Alcohol
YP tert−Amyl
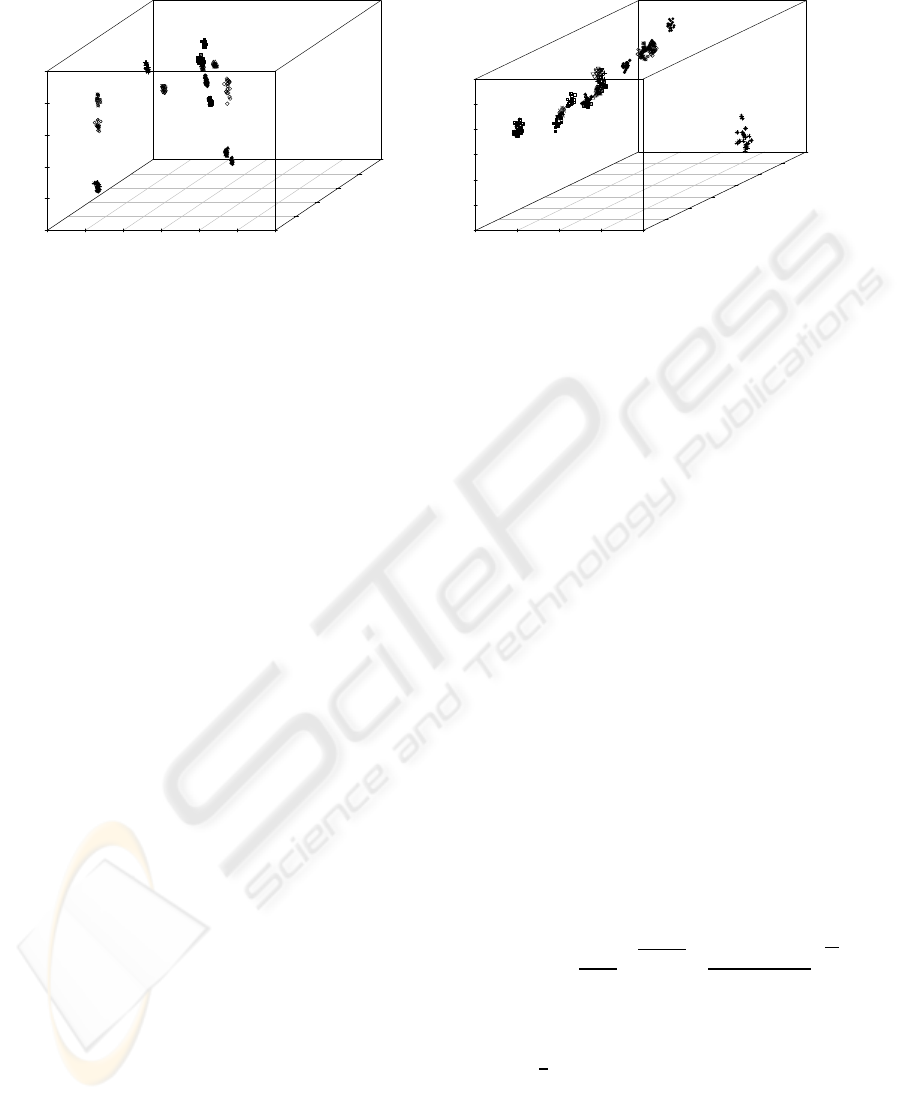
Figure 4: First derivative spectra PCA analysis: (a) LWUV-VIS Gabriel Plot (PC1 (78,40%), PC2 (8,03%); Symbols: i)
YPD terta-Amyl (⊕); ii) YP terta-Amyl ($); iii) YPD Ethanol (); iv) YP Ethanol (♦); v) YPD without alcohol (•); vi) YP
without alcohol (◦); vii) YPD Isopropanol (×); viii) YP Isopropanol (⊠); ix) YPD Propanol (N); x) YP Propanol (△); xi)
YPD Phenylethanol (⊞); xii) Phenylethanol (+); xiii) YPD Butanol (); xiv) YP Butanol (); xv) YP Isoamyl (▽); xvi) YPD
control (∗); xvii) YP control (⊗).
posed in order of magnitude of variation directions
in the variable space (wavelengths). Generally, most
variability is captured in the first principal compo-
nents (PC), where as, in good signal to noise spec-
tral data, noise is captured in the last decomposi-
tions. Therefore a spectrum can be decomposed as:
x
corr
=
b
x+ ε(x); where
b
x is the signal and ε(x) is the
estimated noise of x. This decomposition is possi-
ble to be performed by singular value decomposition
(SVD):
X = USV
T
(1)
where X is a matrix that contains all the corrected
spectra, US are the scores, V
T
the loadings and the
S singular values (Jolliffe, 1986; Krzanowski, 1998;
Baig and Rehman, 2006).
To distinguish between the number of relevant de-
compositions, a randomization test is performed to
the original matrix (x) to determine the number of
relevant singular values (Manly, 1998). In this re-
search, 500 randomizations were performed by per-
mutation the spectral scope value for the same wave-
lengths among the different samples, to do not vio-
late the spectral continuity. By comparing the singu-
lar values of randomized spectrum with the original
spectrum, the number of independent singular values
and decompositionsthat discriminate the differentmi-
croorganisms spectrum are obtained, so that:
b
X = US
relv
V
T
relv
(2)
where US
relv
and V
T
relv
are the statistically rele-
vant scores and loading of X. To further discriminate
between the microorganisms spectrum, the relevant
PC’s scores(US
relv
) were subjected to hierarchical
clustering analysis using the eucledian distance. Fur-
ther class identification was performed using soft in-
dependent class analogy (SIMCA) (Doytchinova and
Flower, 2006).
Not all features in the spectrum fingerprint pre-
serve the same quality after signal decomposition into
relevant principal components. In these cases, their
reconstruction is statistically impossible. In practical
terms, features that are not compressed, cannot be an-
alyzed in the score plot. Feature extraction quality can
be assessed by the Q-statistic (square prediction error)
of the relevant decomposition developed by (Jackson
and Mudholkar, 1979):
Q
i
= e
i
e
T
i
(3)
where e
i
= x
i
−
b
x
i
is the reconstruction error for
the i
th
spectrum present in the data matrix (the i
th
row
of X). An accepted way of computing the Q statistical
confidence interval (Q
α
) is defined as:
Q
α
= θ
1
·
1+
Z
α/2
θ
1
q
2θ
2
h
2
0
+
θ
2
h
0
(h
0
− 1)
θ
2
1
1
h
0
(4)
where Z
α
is the inverse normal distribution value
for the significance level (α/2), θ
j
=
∑
(S
i
)
j
and
h
0
= 1 −
2
3
θ
1
θ
3
/θ
2
2
(Choi et al., 2005). The sam-
ples with a Q-statistic above Q
α
are outside the PCA
model reconstruction and contain non-common fea-
tures(Conlin et al., 2000).
In these cases, the contribution plot is estimated
to determine which variables are affecting the Q-
statistics (Miller et al., 2003; Dunia et al., 1996), and
YEAST METABOLIC STATE IDENTIFICATION BY FIBER OPTICS SPECTROSCOPY
173

diagnostic why features are not captured. The recon-
structed sample
b
x
i
, the variable contribution for the
reconstruction error is estimated by the square error
of each variable E
2
ij
(Miller et al., 2003; Dunia et al.,
1996).
Another well known statistic is the Hotelling T
2
.
In SVD, this is used as a measure of the distance to
the center of data, being computed by:
T
2
i
= x
T
i
VA
−1
V
T
i
x (5)
and A =
1
n−1
TT
T
, where T = (US)
rel
and n is the
number of wavelength in the spectra (X columns).
The upper confidence interval for the Hoteling T
2
is
estimated by: T
2
α
=
l(n−1)
n−1
F
l,n−1;α
; where l is the num-
ber of relevant singular values and F
l,n−1;α
the F dis-
tribution value with l and n− 1 degrees of freedom at
α = 0.05 level of significance. Samples with a T
2
-
statistic above T
2
α
are considered to have significantly
different features (Qin, 2003).
3 RESULTS AND DISCUSSION
3.1 Spectral Absorbance
Figure 3 presents LWUV-VIS and VIS-SWNIR yeast
spectrum for different growth medium conditions. It
is possible to assess in the absorbance spectrum (Fig-
ure 3 (a) and (c)) that colonies are directly distin-
guishable by the intensity and spectral shape. The
first derivate spectrum (Figure 3 (b) and (d)) was cal-
culated to eliminate background and baseline effects.
In this signal colonies can be distinguishable in the
wavelength interval of 350-500 nm and 600-900 nm
in the LWUV-VIS and VIS-SWNIR, respectively.
Spectrum may contain information of the growth
media. This was minimized by maximizing the con-
trast between the growth media and colonies. It is
possible to observe that spectrum signatures for each
growth medium conditions are different and well dis-
tinguished, and therefore it is reasonable to assume
that most of the information obtained in the spectra is
coherent with the colony metabolomic state.
3.2 Singular Value Decomposition
Analysis
Figure 4 (a) present relevant scores plot in the 3 PC’s
for LWUV-VIS first derivative of absorbance, total-
izing 90.1 % of spectral variance with discriminant
power (PC1 (53.7 %), PC2 (32.6 %), PC3 (3.8 %)).
PC1 (53.7 %) separates the samples by spectral
intensity into four groups: i) growth media control
(YPD and YP) and colony growth in YP without alco-
hol; ii) colonies growth in: YP Phenylethanol and YP
Isomyl; iii) colonies growth in: YPD tert-Amyl, YPD
Butanol, YP Isopropanol, YP Ethanol, YP Butanol,
YPD Isopropanol, YP Propanol, YPD Ethanol, YPD
w/o alcohol and YPD Phenylethanol; and iv) colonies
growth in YPD Propanol and YPD tert-Amyl.
PC2 (32.6 %) distinguishes the growth medium
control (without colonies) from the other samples,
with the exception of the colony growth in YP me-
dia without alcohol. This similarity may be due to the
small sized colony, which causes the passage of light
through the media.
PC3 (3.8 %) captures a small variance in the spec-
trum. Neverthenless, it is also significant for discrimi-
nation of the colonies of YPD Propanol and YPD tert-
Amyl.
Figure 4 (b) shows the first derivative spectra PCA
analysis for the VIS-SWNIR light. It is also de-
composed into 3 PC’S, (80.3 % of total variance) in
the VIS-SWNIR region. PC1 (63.8.0%) also segre-
gates colonies by spectral intensity, and YPD con-
trol is completely distinguished from other samples
. PC2 (14.0 %) segregates colonies into different
groups, where YPD Phenylethanol, YPD w/o alcohol
and YPD Ethanol, are completely distinguish. PC3
(2.5%) segregates differences between colonies in the
same groups.
Figure 5 (a) and (b) presents the diagnostic plot
(Q-T
2
h
plot) for the two light sources. In these two fig-
ures, YPD control and YP control samples are above
the Q or T
2
h
limits, which means that the growth me-
dias are dissociated from the rest of the samples, be-
ing possible to affirm that their spectral features are
significantly different from the colonies, and statisti-
cally guaranteeing that the information contained in
the collected spectra is mostly independent of the
growth media, measuring the metabolomic state of
each colony.
The analysis of the diagnostic plots also allows to
conclude that colonies in: YP w/o alcohol (Figure 5
(a)) and YPD phenylethanol (Figure 5 (b)) are above
the Q limit, which means that the features captured in
the 3 first components for these medias, are not suf-
ficient to reconstruct the original spectral data, due to
large reconstruction errors (Qin, 2003). This allows
us to conclude that these colonies are in completely
different metabolic state than the rest of the studied
growth conditions.
In Figure 5 (b), some spectra replicates of colonies
in YPD Phenylethanol media are above the T
2
h
limit,
which means that these spectra colony is statisti-
BIOSIGNALS 2009 - International Conference on Bio-inspired Systems and Signal Processing
174
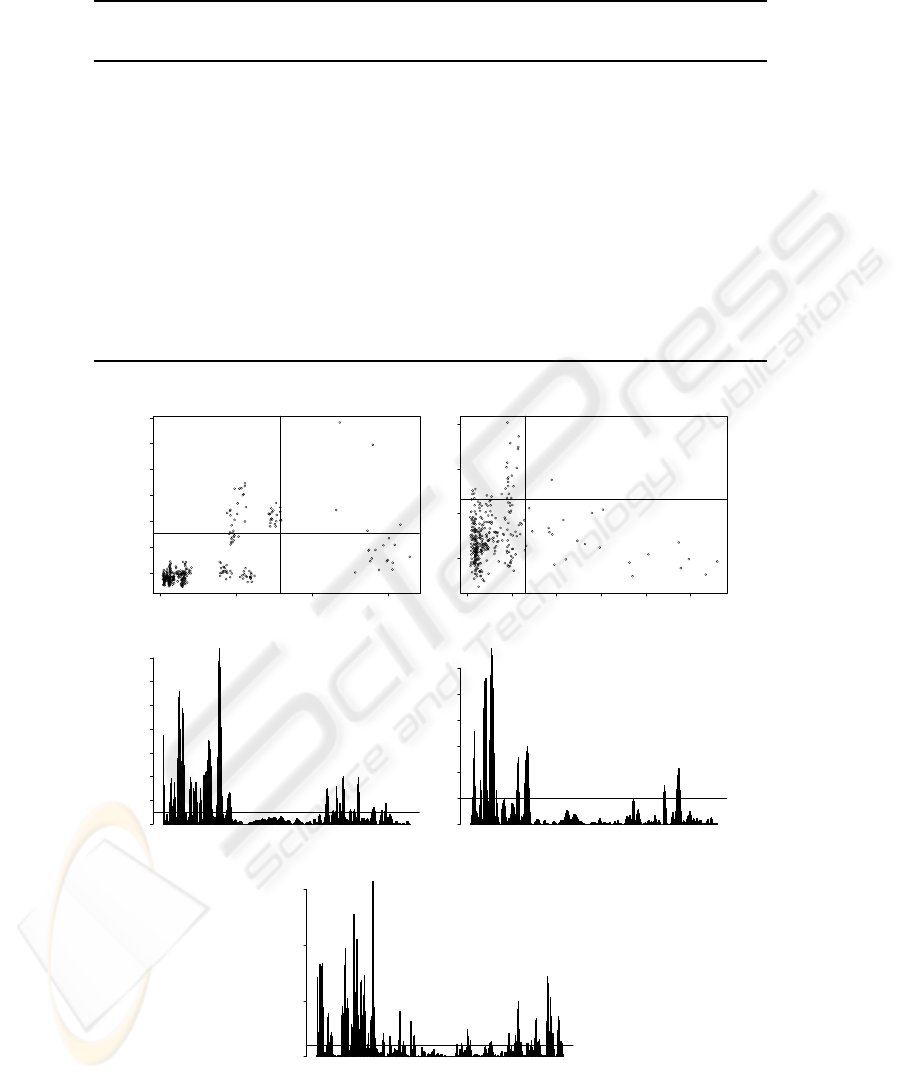
Table 1: Integration time, morphology and classification probabilities results.
Classification probabilities
Integration Time (ms) ABS + HCA (%) Derv + HCA (%)
Growth Media UV-VIS VIS-NIR Morphology UV-VIS VIS-NIR UV-VIS VIS-NIR
YPD without alcohol 524 439 w/o hyphae 100 100 100 100
YP without alcohol 80 94 w/o hyphae 100 100 100 100
YPD ethanol 639 497 w/o hyphae 100 100 100 100
YP ethanol 1906 850 w/o hyphae 100 100 100 100
YPD butanol 455 373 w/o hyphae 100 100 100 100
YP butanol 529 351 hyphae 100 100 100 100
YPD propanol 1546 625 w/o hyphae 100 100 100 100
YP propanol 856 740 w/o hyphae 100 100 100 100
YPD isopropanol 490 378 hyphae 100 100 100 100
YP isopropanol 632 288 w/o hyphae 100 100 100 100
YP isoamyl 328 92 hyphae 100 100 100 100
YPD phenylethanol 620 240 w/o hyphae 100 100 100 100
YP phenylethanol 177 81 w/o hyphae 100 100 100 100
YPD terta-Amyl 1365 571 hyphae 100 100 100 100
YP terta-Amyl 400 379 hyphae 100 100 100 100
0 5 10 15
0.001 0.002 0.003 0.004 0.005 0.006 0.007
(a)
T2−statistic
Q−statistic
YP Butanol
YP Butanol
YP Butanol
YP Butanol
YP Butanol
YP Butanol
YP Butanol
YP Butanol
YP Butanol
YP Butanol
YP Butanol
YP Butanol
YP Butanol
YP Butanol
YP Butanol
YP Butanol
YP Butanol
YP Butanol
YP Butanol
YP Butanol
YP Control
YP Control
YP Control
YP Control
YP Control
YP Control
YP Control
YP Control
YP Control
YP Control
YPD Butanol
YPD Butanol
YPD Butanol
YPD Butanol
YPD Butanol
YPD Butanol
YPD Butanol
YPD Butanol
YPD Butanol
YPD Butanol
YPD Butanol
YPD Butanol
YPD Butanol
YPD Butanol
YPD Butanol
YPD Butanol
YPD Butanol
YPD Butanol
YPD Butanol
YPD Butanol
YPD Control
YPD Control
YPD Control
YPD Control
YPD Control
YPD Control
YPD Control
YPD Control
YPD Control
YPD Control
YPD Control
YPD Control
YPD Control
YPD Control
YPD Control
YPD Control
YPD Control
YPD Control
YPD Control
YPD Control
YPD Etanol
YPD Etanol
YPD Etanol
YPD Etanol
YPD Etanol
YPD Etanol
YPD Etanol
YPD Etanol
YPD Etanol
YPD Etanol
YPD Etanol
YPD Etanol
YPD Etanol
YPD Etanol
YPD Etanol
YPD Etanol
YPD Etanol
YPD Etanol
YPD Etanol
YPD Etanol
YPD Phenylethanol
YPD Phenylethanol
YPD Phenylethanol
YPD Phenylethanol
YPD Phenylethanol
YPD Phenylethanol
YPD Phenylethanol
YPD Phenylethanol
YPD Phenylethanol
YPD Phenylethanol
YPD Phenylethanol
YPD Phenylethanol
YPD Phenylethanol
YPD Phenylethanol
YPD Phenylethanol
YPD Phenylethanol
YPD Phenylethanol
YPD Phenylethanol
YPD Phenylethanol
YPD Phenylethanol
YPD Isopropanol
YPD Isopropanol
YPD Isopropanol
YPD Isopropanol
YPD Isopropanol
YPD Isopropanol
YPD Isopropanol
YPD Isopropanol
YPD Isopropanol
YPD Isopropanol
YPD Isopropanol
YPD Isopropanol
YPD Isopropanol
YPD Isopropanol
YPD Isopropanol
YPD Isopropanol
YPD Isopropanol
YPD Isopropanol
YPD Isopropanol
YPD Isopropanol
YPD Propanol
YPD Propanol
YPD Propanol
YPD Propanol
YPD Propanol
YPD Propanol
YPD Propanol
YPD Propanol
YPD Propanol
YPD Propanol
YPD Propanol
YPD Propanol
YPD Propanol
YPD Propanol
YPD Propanol
YPD Propanol
YPD Propanol
YPD Propanol
YPD Propanol
YPD Propanol
YPD /alcohol
YPD /alcohol
YPD /alcohol
YPD /alcohol
YPD /alcohol
YPD /alcohol
YPD /alcohol
YPD /alcohol
YPD /alcohol
YPD /alcohol
YPD /alcohol
YPD /alcohol
YPD /alcohol
YPD /alcohol
YPD /alcohol
YPD /alcohol
YPD /alcohol
YPD /alcohol
YPD /alcohol
YPD /alcohol
YPD tert−Amyl
YPD tert−Amyl
YPD tert−Amyl
YPD tert−Amyl
YPD tert−Amyl
YPD tert−Amyl
YPD tert−Amyl
YPD tert−Amyl
YPD tert−Amyl
YPD tert−Amyl
YPD tert−Amyl
YPD tert−Amyl
YPD tert−Amyl
YPD tert−Amyl
YPD tert−Amyl
YPD tert−Amyl
YPD tert−Amyl
YPD tert−Amyl
YPD tert−Amyl
YPD tert−Amyl
YP Etanol
YP Etanol
YP Etanol
YP Etanol
YP Etanol
YP Etanol
YP Etanol
YP Etanol
YP Etanol
YP Etanol
YP Etanol
YP Etanol
YP Etanol
YP Etanol
YP Etanol
YP Etanol
YP Etanol
YP Etanol
YP Etanol
YP Etanol
YP Phenylethanol
YP Phenylethanol
YP Phenylethanol
YP Phenylethanol
YP Phenylethanol
YP Phenylethanol
YP Phenylethanol
YP Phenylethanol
YP Phenylethanol
YP Phenylethanol
YP Phenylethanol
YP Phenylethanol
YP Phenylethanol
YP Phenylethanol
YP Phenylethanol
YP Phenylethanol
YP Phenylethanol
YP Phenylethanol
YP Phenylethanol
YP Phenylethanol
YP Isoamyl
YP Isoamyl
YP Isoamyl
YP Isoamyl
YP Isoamyl
YP Isoamyl
YP Isoamyl
YP Isoamyl
YP Isoamyl
YP Isoamyl
YP Isoamyl
YP Isoamyl
YP Isoamyl
YP Isoamyl
YP Isoamyl
YP Isoamyl
YP Isoamyl
YP Isoamyl
YP Isoamyl
YP Isoamyl
YP Isopropanol
YP Isopropanol
YP Isopropanol
YP Isopropanol
YP Isopropanol
YP Isopropanol
YP Isopropanol
YP Isopropanol
YP Isopropanol
YP Isopropanol
YP Isopropanol
YP Isopropanol
YP Isopropanol
YP Isopropanol
YP Isopropanol
YP Isopropanol
YP Isopropanol
YP Isopropanol
YP Isopropanol
YP Isopropanol
YP Propanol
YP Propanol
YP Propanol
YP Propanol
YP Propanol
YP Propanol
YP Propanol
YP Propanol
YP Propanol
YP Propanol
YP Propanol
YP Propanol
YP Propanol
YP Propanol
YP Propanol
YP Propanol
YP Propanol
YP Propanol
YP Propanol
YP Propanol
YP /alcohol
YP /alcohol
YP /alcohol
YP /alcohol
YP /alcohol
YP /alcohol
YP /alcohol
YP /alcohol
YP /alcohol
YP /alcohol
YP /alcohol
YP /alcohol
YP /alcohol
YP /alcohol
YP /alcohol
YP /alcohol
YP /alcohol
YP /alcohol
YP /alcohol
YP /alcohol
YP tert−Amyl
YP tert−Amyl
YP tert−Amyl
YP tert−Amyl
YP tert−Amyl
YP tert−Amyl
YP tert−Amyl
YP tert−Amyl
YP tert−Amyl
YP tert−Amyl
YP tert−Amyl
YP tert−Amyl
YP tert−Amyl
YP tert−Amyl
YP tert−Amyl
YP tert−Amyl
YP tert−Amyl
YP tert−Amyl
YP tert−Amyl
YP tert−Amyl
0 10 20 30 40 50
4e−05 6e−05 8e−05 1e−04
(b)
T2−statistic
Q−statistic
YP Butanol
YP Butanol
YP Butanol
YP Butanol
YP Butanol
YP Butanol
YP Butanol
YP Butanol
YP Butanol
YP Butanol
YP Butanol
YP Butanol
YP Butanol
YP Butanol
YP Butanol
YP Butanol
YP Butanol
YP Butanol
YP Butanol
YP Butanol
YP Control
YP Control
YP Control
YP Control
YP Control
YP Control
YP Control
YP Control
YP Control
YP Control
YP Control
YP Control
YP Control
YP Control
YP Control
YP Control
YP Control
YP Control
YP Control
YP Control
YPD Butanol
YPD Butanol
YPD Butanol
YPD Butanol
YPD Butanol
YPD Butanol
YPD Butanol
YPD Butanol
YPD Butanol
YPD Butanol
YPD Butanol
YPD Butanol
YPD Butanol
YPD Butanol
YPD Butanol
YPD Butanol
YPD Butanol
YPD Butanol
YPD Butanol
YPD Butanol
YPD Control
YPD Control
YPD Control
YPD Control
YPD Control
YPD Control
YPD Control
YPD Control
YPD Control
YPD Control
YPD Control
YPD Control
YPD Control
YPD Control
YPD Control
YPD Control
YPD Control
YPD Control
YPD Control
YPD Control
YPD Ethanol
YPD Ethanol
YPD Ethanol
YPD Ethanol
YPD Ethanol
YPD Ethanol
YPD Ethanol
YPD Ethanol
YPD Ethanol
YPD Ethanol
YPD Ethanol
YPD Ethanol
YPD Ethanol
YPD Ethanol
YPD Ethanol
YPD Ethanol
YPD Ethanol
YPD Ethanol
YPD Ethanol
YPD Ethanol
YPD Phenylethanol
YPD Phenylethanol
YPD Phenylethanol
YPD Phenylethanol
YPD Phenylethanol
YPD Phenylethanol
YPD Phenylethanol
YPD Phenylethanol
YPD Phenylethanol
YPD Phenylethanol
YPD Phenylethanol
YPD Phenylethanol
YPD Phenylethanol
YPD Phenylethanol
YPD Phenylethanol
YPD Phenylethanol
YPD Phenylethanol
YPD Phenylethanol
YPD Phenylethanol
YPD Phenylethanol
YPD IsopropanolL
YPD IsopropanolL
YPD IsopropanolL
YPD IsopropanolL
YPD IsopropanolL
YPD IsopropanolL
YPD IsopropanolL
YPD IsopropanolL
YPD IsopropanolL
YPD IsopropanolL
YPD IsopropanolL
YPD IsopropanolL
YPD IsopropanolL
YPD IsopropanolL
YPD IsopropanolL
YPD IsopropanolL
YPD IsopropanolL
YPD IsopropanolL
YPD IsopropanolL
YPD IsopropanolL
YPD PropanolL
YPD PropanolL
YPD PropanolL
YPD PropanolL
YPD PropanolL
YPD PropanolL
YPD PropanolL
YPD PropanolL
YPD PropanolL
YPD PropanolL
YPD PropanolL
YPD PropanolL
YPD PropanolL
YPD PropanolL
YPD PropanolL
YPD PropanolL
YPD PropanolL
YPD PropanolL
YPD PropanolL
YPD PropanolL
YPD /alcohol
YPD /alcohol
YPD /alcohol
YPD /alcohol
YPD /alcohol
YPD /alcohol
YPD /alcohol
YPD /alcohol
YPD /alcohol
YPD /alcohol
YPD /alcohol
YPD /alcohol
YPD /alcohol
YPD /alcohol
YPD /alcohol
YPD /alcohol
YPD /alcohol
YPD /alcohol
YPD /alcohol
YPD /alcohol
YPD tert−Amyl
YPD tert−Amyl
YPD tert−Amyl
YPD tert−Amyl
YPD tert−Amyl
YPD tert−Amyl
YPD tert−Amyl
YPD tert−Amyl
YPD tert−Amyl
YPD tert−Amyl
YPD tert−Amyl
YPD tert−Amyl
YPD tert−Amyl
YPD tert−Amyl
YPD tert−Amyl
YPD tert−Amyl
YPD tert−Amyl
YPD tert−Amyl
YPD tert−Amyl
YPD tert−Amyl
YP Ethanol
YP Ethanol
YP Ethanol
YP Ethanol
YP Ethanol
YP Ethanol
YP Ethanol
YP Ethanol
YP Ethanol
YP Ethanol
YP Ethanol
YP Ethanol
YP Ethanol
YP Ethanol
YP Ethanol
YP Ethanol
YP Ethanol
YP Ethanol
YP Ethanol
YP Ethanol
YP Phenylethanol
YP Phenylethanol
YP Phenylethanol
YP Phenylethanol
YP Phenylethanol
YP Phenylethanol
YP Phenylethanol
YP Phenylethanol
YP Phenylethanol
YP Phenylethanol
YP Phenylethanol
YP Phenylethanol
YP Phenylethanol
YP Phenylethanol
YP Phenylethanol
YP Phenylethanol
YP Phenylethanol
YP Phenylethanol
YP Phenylethanol
YP Phenylethanol
YP Isoamyl
YP Isoamyl
YP Isoamyl
YP Isoamyl
YP Isoamyl
YP Isoamyl
YP Isoamyl
YP Isoamyl
YP Isoamyl
YP Isoamyl
YP Isoamyl
YP Isoamyl
YP Isoamyl
YP Isoamyl
YP Isoamyl
YP Isoamyl
YP Isoamyl
YP Isoamyl
YP Isoamyl
YP Isoamyl
YP IsopropanolL
YP IsopropanolL
YP IsopropanolL
YP IsopropanolL
YP IsopropanolL
YP IsopropanolL
YP IsopropanolL
YP IsopropanolL
YP IsopropanolL
YP IsopropanolL
YP IsopropanolL
YP IsopropanolL
YP IsopropanolL
YP IsopropanolL
YP IsopropanolL
YP IsopropanolL
YP IsopropanolL
YP IsopropanolL
YP IsopropanolL
YP IsopropanolL
YP PropanolL
YP PropanolL
YP PropanolL
YP PropanolL
YP PropanolL
YP PropanolL
YP PropanolL
YP PropanolL
YP PropanolL
YP PropanolL
YP PropanolL
YP PropanolL
YP PropanolL
YP PropanolL
YP PropanolL
YP PropanolL
YP PropanolL
YP PropanolL
YP PropanolL
YP PropanolL
YP /alcohol
YP /alcohol
YP /alcohol
YP /alcohol
YP /alcohol
YP /alcohol
YP /alcohol
YP /alcohol
YP /alcohol
YP /alcohol
YP /alcohol
YP /alcohol
YP /alcohol
YP /alcohol
YP /alcohol
YP /alcohol
YP /alcohol
YP /alcohol
YP /alcohol
YP /alcohol
YP tert−Amyl
YP tert−Amyl
YP tert−Amyl
YP tert−Amyl
YP tert−Amyl
YP tert−Amyl
YP tert−Amyl
YP tert−Amyl
YP tert−Amyl
YP tert−Amyl
YP tert−Amyl
YP tert−Amyl
YP tert−Amyl
YP tert−Amyl
YP tert−Amyl
YP tert−Amyl
YP tert−Amyl
YP tert−Amyl
YP tert−Amyl
YP tert−Amyl
282 305 328 351 374 396 417 438 461 484 505 527 550 573
(c)
Wavelength(nm)
SPE Contribution
0e+00 1e−05 2e−05 3e−05 4e−05 5e−05 6e−05 7e−05
282 305 328 351 374 396 417 438 461 484 505 527 550 573
(d)
Wavelength(nm)
SPE Contribution
0.0e+00 5.0e−06 1.0e−05 1.5e−05 2.0e−05 2.5e−05 3.0e−05
440 469 497 527 556 584 608 637 666 695 722 751 779 807
(e)
Wavelength(nm)
SPE Contribution
0.0e+00 5.0e−07 1.0e−06 1.5e−06
Figure 5: Diagnostic and Contribution plots: (a) LWUV-VIS Diagnostic plot; (b) VIS-SWNIR Diagnostic plot; (c) YP without
alcohol LWUV-VIS (d) YP ethanol LWUV-VIS and (e) YPD phenylethanol VIS-SWNIR.
YEAST METABOLIC STATE IDENTIFICATION BY FIBER OPTICS SPECTROSCOPY
175
cally different from the average spectral features com-
pressed by the 3 PC’s. Therefore, this colony can be
directly classified from the global SVD model (see
Figure 4 (b)).
The diagnostic plots allowed to understand that
the 3 PC’s model is capable of discriminating the ma-
jor spectral differences between colonies, but it can-
not compress all the spectral features in the relevant
PC’S. Such may leads to errors in distinction and
spectral features interpretation.
Contribution plots allow to interpret why colonies
of YPD w/o alcohol, YP Ethanol and YPD
Phenylethanol (Figure 5 (c), (d) and (e), respectively),
are distinguishable from the rest of the samples.
YPD w/o has higher reconstruction errors in the
region of 300-350 nm, which are linked to chro-
mophoric groups of C=C and -N=N-, respectively.
YP ethanol colonies has high contribution in the in-
tervals of 280-300 nm, which is dominated by C=C
chromophoric group. The colonies which grown in
the YPD phenylethanolhas high contribution errors in
the intervals of 440-520 nm and 750-800 nm, which
are linked to C=S chromophoric group and OH over-
tones, respectively.
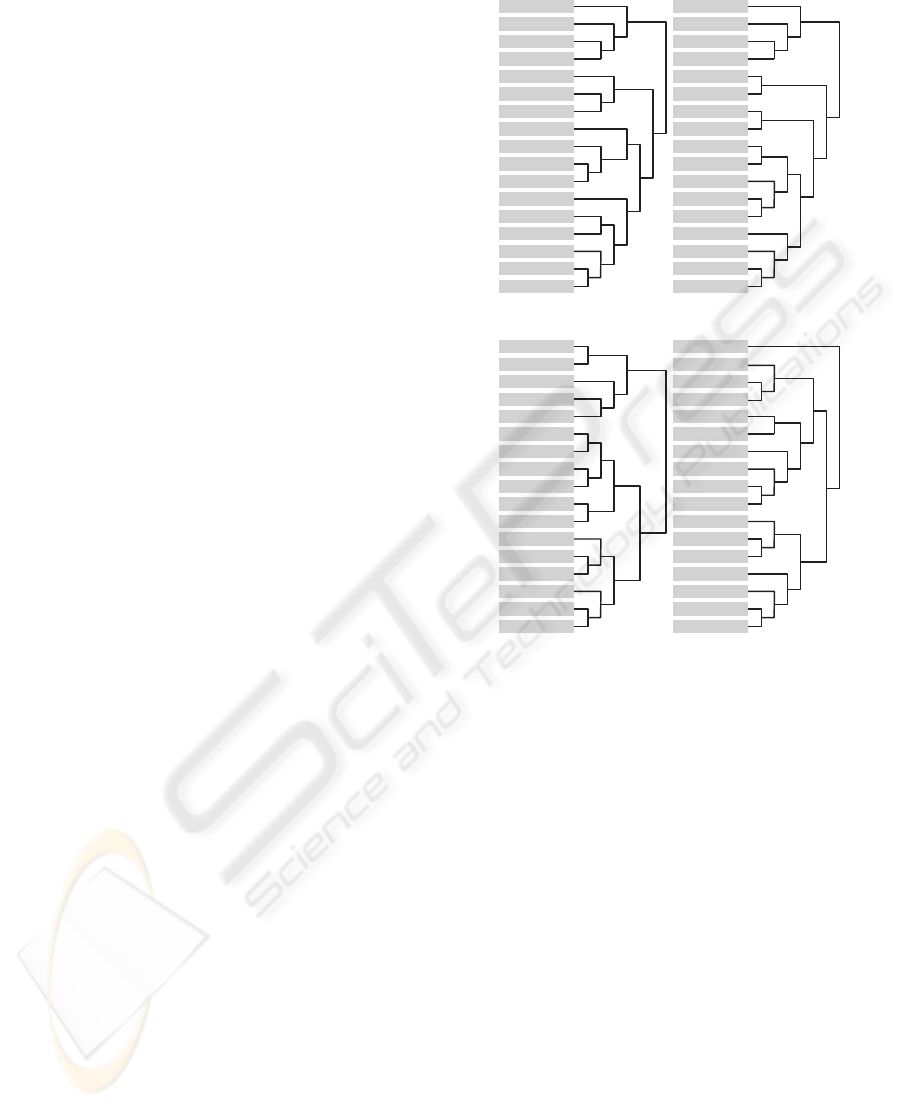
After SIMCA analysis, HCA was performed tak-
ing into consideration the euclidean distance between
the center of the scores of each yeast spectra. HCA is
presented in Figure 6 (a), (b) for LWUV-VIS and (c),
(d) for VIS-SWNIR wavelengths, respectively.
Hierarchical clustering analysis differs in both
light sources, and then the relative positions of
colonies are different. In both hierarchical trees,
yeasts structures that were grown under different con-
ditions are well discriminated from each one. It is
possible to observe a good discrimination between
control mediums YP and YPD in LWUV-VIS and
VIS-SWNIR trees, but YP ethanol, YP without alco-
hol and YP isoamyl are more similar to the control
mediums. This phenomena can be explained because
of the low density of cells and the translucency of the
colony that allows light to cross the colony and then
incorporate significant amount of growth media spec-
tral information, leading to lower contrast between
growth media and microorganisms in this cases. Such
is especially problematic, if the colony is small sized
or when the probe is not properly placed.
Comparing LWUV-VIS and VIS-SWNIR trees
with Table 1, we can relate colonies aggroupment
with its morphologies. In LWUV-VIS tree it is pos-
sible to distinguish some colonies with the same
morphology, such as YPD phenyl-ethanol, YP 1-
propanol, YP ethanol and YPD without alcohol
(which do not form filament forms) from the other
groups. S. cerevisiae that has grown in YP tert-Amyl
YP Phenylethanol
YP Control
YPD Control
YP /Alcohol
YP Etanol
YPD Propanol
YPD tert-Amyl
YP Propanol
YP Isopropanol
YPD Phenylethanol
YPD Etanol
YP Isoamyl
YPD Butanol
YP tert-Amyl
YP Butanol
YPD /Alcohol
YPD Isopropanol
(a)
YP Phenylethanol
YP Control
YPD Control
YP /Alcohol
YP Etanol
YPD Propanol
YPD tert-Amyl
YP Propanol
YP Isopropanol
YPD Phenylethanol
YPD Etanol
YP Isoamyl
YPD Butanol
YP tert-Amyl
YP Butanol
YPD /Alcohol
YPD Isopropanol
(b)
YP Phenylethanol
YP Control
YPD Control
YP /Alcohol
YP Etanol
YPD Propanol
YPD tert-Amyl
YP Propanol
YP Isopropanol
YPD Phenylethanol
YPD Etanol
YP Isoamyl
YPD Butanol
YP tert-Amyl
YP Butanol
YPD /Alcohol
YPD Isopropanol
(c)
YP Phenylethanol
YP Control
YPD Control
YP /Alcohol
YP Etanol
YPD Propanol
YPD tert-Amyl
YP Propanol
YP Isopropanol
YPD Phenylethanol
YPD Etanol
YP Isoamyl
YPD Butanol
YP tert-Amyl
YP Butanol
YPD /Alcohol
YPD Isopropanol
(d)
Figure 6: Hierarchical cluster Analysis: (a) Absorbance
- LWUV-VIS; (b) First derivative - LWUV-VIS; (c) Ab-
sorbance - VIS-SWNIR and (d) First derivative VIS-
SWNIR.
medium is well separated from the other. groups
in the LWUV-VIS, but is integrated in YP-butanol
group in the VIS-SWNIR wavelengths. Some groups
with yeast-form can be distinguish in VIS-SWNIR
wavelengths such as YPD ethanol, YPD 1-propanol
and YP ethanol and YP isopropanol and YPD bu-
tanol. Furthermore, YPD without alcohol and YPD
isopropanol are completely separated from all groups.
Table 1 presents a 100 % classification probabil-
ities for all colonies. Such means that all colonies
are completely differentiated from from each others.
However, this classification does not depends only
colony morphology, but it mostly depends on the
chemical composition and metabolism of colonies.
Comparing LWUV-VIS and VIS-SWNIR informa-
tion (Figure Spectra), it is possible to conclude that
there are considerable differences that indiciate the
presence of different chemical compounds that re-
spond differently to the UV excitation. It would be
expectable that absorvance would show the same pat-
tern in both light sources, but results show that the
BIOSIGNALS 2009 - International Conference on Bio-inspired Systems and Signal Processing
176

yeast spectra has completely different features when
responding to UV excitation, especially in the region
of 350-450 nm. Such high resolution and the dif-
ferences between the two light sources spectra, al-
lows us to conclude that UV-VIS-SWNIR is capa-
ble of high performance discrimination of the yeast
metabolic states.
However, as spectroscopy is a non-target ap-
proach, it is not possible identify directly the chem-
ical compounds and the transcripted genes that dif-
ferentiate the colonies. In order to understand deeper
the potential of UV-VIS-SWINR spectroscopy, it is
necessary to correlate spectroscopy data against high-
precision analytical techniques, such as mass spec-
troscopy (e.g. LC-MS/MS, GC-MS or Maldi-TOF),
NMR and transcriptomics (e.g. DNA/RNA Microar-
rays).
4 CONCLUSIONS
This work has shown that after appropriate prepro-
cessing and signal classification, UV-VIS-SWNIR
spectroscopy is a high resolution technique capable
of attaining interesting possibilities in non-destructive
metabolomics in the near future. Further insights will
be gained when spectral information is deeper under-
stood, not only by correlating with other high resolu-
tion analytical chemistry and molecular biology tech-
niques, but also in understanding of the spectra shape
of the differents microorganisms.
ACKNOWLEDGEMENTS
Part of this work was supported by the project Open-
MicroBio (PTDC/BIO/69310/2006) - ’A Framework
for Computational Simulation of Cellular Commu-
nities during BioProcess Engineering’; and partially
supported by CBMA, IBB/CEB and ISR/IST pluri-
anual funds through the POS-Conhecimento Program
that includes FEDER funds.
REFERENCES
Avantes, I. (2007). Users manual.
Baig, S. and Rehman, F. (2006). Signal modeling using sin-
gular value decomposition. In Advances in Computer,
Information, and Systems Sciences, and Engineering.
Springer Netherlands.
Bhatta, H., Goldys, E., and Learmonth, R. (2005). Rapid
identification of microorganisms by intrinsicfluores-
cence. In Imaging, Manipulation, and Analysis of
Biomolecules and Cells: Fundamentals and Applica-
tions III,. SPIE.
Burns, D. and Ciurczak, E. (2001). Handbook of near in-
frared analysisI. Marcel Dekker, Inc, New York, 2nd
edition edition.
Choi, S., Lee, C., Lee, J., Park, J., and Lee, I. (2005).
Fault detection and identification of non-linear pro-
cesses based on kernel pca. Chemometrics and intel-
ligent laboratory systems, 75:55–67.
Conlin, A., Martin, E., and Morris, A. (2000). Confidence
limits for contribution plots. Journal of Chemomet-
rics, 14:725–736.
Coyle, J. (1989). Introduction to Organic PhotoChemistry.
John Wiley & Sons, London.
Denney, R. and Sinclair, R. (1987). Visible and ultraviolet
spectroscopy. John Wiley & Sons, London.
Devices, A. S. (2005). Near-ir absorption bands.
Dickinson, J. (1994). Irreversible formation of pseudohy-
phae by haploid Saccharomyces cerevisiae. FEMS Mi-
crobiol. Lett., 119:99–104.
Dickinson, J. (2008). Filament formation in Saccharomyces
cerevisiae - a review. Folia Microbiol., 53(1):3–14.
Doytchinova, F. and Flower, D. (2006). Modeling the
peptide t-cell receptor interaction by the compara-
tive molecular similarity indices analysis-soft inde-
pendent modeling of class analogy technique. Journal
of Medicinal Chemistry, 49(7):2193–2199.
Dunia, R., Qin, S., Edgar, T., and T.J., M. (1996). denti-
fication of faulty sensors using principal component
analysis. American Institute of Chemical Engineers,
42:2797–2812.
Dziuba, B., Babuchowski, A., Naleczb, D., and Niklewicz,
M. (2007). Identification of lactic acid bacteria using
ftir spectroscopy and cluster analysis. In International
Dairy Journal 17: 183189. Elsevier.
Gallager, N. B., Blake, T., and Gassman, P. (2005). Ap-
plication of extended inverse scattering correction to
mid-infrared reflectance of soil. Journal of Chemo-
metrics, 19:271–281.
Gerard, J., Berdell, R., and Christine, L. (2006). Microbi-
ology: An Introduction. Benjamin Cummingsc, New
York, 2th edition edition.
Gimeno, C. J., Ljungdahl, P., Styles, C., and Fink, G.
(1992). Unipolar cell divisions in yeast Saccha-
romyces cerevisiae lead to filamentous growth: reg-
ulation by starvation and ras. Cell, 68:1077–1090.
Jackson, J. and Mudholkar, G. (1979). Control proce-
dures for residuals associated with principal compo-
nent analysis. Technometrics, 21:341–349.
Jolliffe, I. (1986). Principal Component Analysis. Springer,
New York, USA.
Klessinger, M. and Michl, J. (1995). Exited states and pho-
tochemistry of organic molecules. VCH Publishers,
New York.
Kron, S. and Gow, N. (1995). Budding yeast mor-
phogenesis: gignaling, cytoskeleton and cell cycle.
Curr.Opin.Cell Biol., 7:845–855.
YEAST METABOLIC STATE IDENTIFICATION BY FIBER OPTICS SPECTROSCOPY
177

Krzanowski, W. J. (1998). Principles of Multivariate Data
Analysis. Oxford University Press, Oxford, UK.
Levine, I. (1975). Molecular Spectroscopy. John Wiley &
Sons, New York.
Manly, B. F. (1998). Randomization, Bootstrap and Monte
Carlo Methods in Biology. Chapman and Hall, Lon-
don, UK, 2nd edition.
Martens, H., Nielsen, J. P., and Engelsen, S. B. (2003).
Light scattering and light absorbance separated by ex-
tended multiplicative signal correction. application to
near-infrared transmission analysis of powder mix-
tures. In Analytical Chemistry 75(9): 394-404. Amer-
ican Chemical Society.
Martens, H. and Stark, E. (1991). Extended multiplicative
signal correction and spectral interference subtraction:
new preprocessing methods for near infrared spec-
troscopy. In Journal of Pharmaceutical and Biomedi-
cal Analysis 9: 625-635. American Chemical Society.
Micropack (2008). DH2000 BAL: Installation and operat-
ing manual. Ocean Optics, Ostfilden, Germany.
Miller, P., Swanson, R., and Heckler, C. (2003). Contribu-
tion plots: the missing link in multivariate quality con-
trol. International Journal of Production Economics,
9:775–792.
Optics, O. (2006). HR4000 - High resolution fiber op-
tic spectrometers: instalation and operation manual.
Ocean Optics, Dundelin, FL USA.
Palkova, Z. and Vachova, L. Ammonia signaling in yeast
colony formation.
Perkauparus, H., Grinter, H., and Therfall, T. (1994). Uv-Vis
spectroscopy and its applications. Springer-Verlag,
New York.
Qin, S. (2003). Statistical process monitoring: basics and
beyond. Journal of Chemometrics, 17:480–502.
Rosah, P., Hard, M., Schmitt, M., Peschke, K. D.,
Ronneberger, O., Burkhart, H., Mutzkus, H. W.,
Laukers, M., Hofer, S., Thiele, H., and Popp, J.
(2005). Chemotaxonomic identification of sim-
ple bacteria by micro-raman spectroscopy: applica-
tion to clean-room-relevant biological contamination.
A&EnvMicro, 71(3):1626–1637.
Rua, D., Tobe, B., and Kron, S. (2001). Cell cycle control
of yeast filamentous growth. Curr.Opin.Microbiol.,
4:720–727.
Savitzky, A. and Golay, M. (1964). Smoothing and differen-
tiation of data by simplified least squares procedures.
Analytical Chemistry, 36:1627–1639.
Sigma-Aldrich Quimica, S. (2008). Sigma, Life Science:
Produtos para Investigao em Ciłncias da Vida, 2008-
2009. Sigma-Aldrich, Portugal, 1nd edition.
Silva, J., Martins, R. C., Vicente, A., and Teixeira, J.
(2008). Feasibility of yeast and bacteria identifica-
tion using lwuv-vis-swnir diffusive reflectance spec-
troscopy. volume 1.
Stuart, B. (2004). Infrared Spectroscopy: Fundamentals
and Applications. John Wiley & Sons, Ltd, London,
1nd edition.
Treskatis, S., Orgeldinger, V., Wolf, H., and Gilles, E. D.
(1997). Morphological characterization of filamen-
tous microorganisms in submerged cultures by on-line
digital image analysis and pattern recognition. volume
53(2), pages 191–201.
BIOSIGNALS 2009 - International Conference on Bio-inspired Systems and Signal Processing
178
