
Temporal and Spatial Distribution Characteristics of Nitrogen and
Phosphorus in Baisha River
Hebing Hu
*
, Bingxue Zhao and Mengmeng Yang
Department of Geography and Planning, Chizhou University, Chizhou, China
Keywords: Nitrogen, Phosphorus, Temporal and Spatial Variation, Baisha River.
Abstract:
The eutrophication of water bodies has always been the key to the governance of rivers and lakes. The nutrient
characteristics of different water bodies are often closely related to factors such as geospatial characteristics
and hydrological characteristics, and they change with seasons. This paper takes the Baisha River as the
research object and arranges 6 sampling points in corresponding locations according to the geographical
characteristics of the Baisha River to study the temporal and spatial distribution characteristics of nitrogen
and phosphorus nutrients in the river. The results show that the concentration of TP, NH
4
+
-N meet the national
surface water level III standard, but the total nitrogen exceeds the level III water standard. The concentration
range of TP in Baisha River is 0.013-0.150mg/L; the range of ammonia nitrogen concentration is 0.006-
0.416mg/L; the range of total nitrogen concentration is 0.458-3.260mg/L. By analyzing the eutrophication of
Baisha River's water quality through the N/P ratio, it is found that there are 8 months N/P between 8 and 30
throughout the year, which is suitable for algae growth, and Baisha River has the conditions for eutrophication.
1 INTRODUCTION
Nitrogen and phosphorus are key nutrients and
limiting elements that affect the eutrophication of
water bodies. In most biogeochemical cycles, rivers
are the vital link between the continent and the ocean.
Most of the nutrients produced by human activities
are transported to the ocean via rivers. Therefore, the
transportation of river nutrients has become a
biogeochemical cycle. Sensitivity indicator. At
present, Chinese scholars are conducting a large
number of studies on the temporal and spatial
characteristics of river nitrogen and phosphorus
pollution and the sources of pollution, with fruitful
results. Research on the water quality of Beiluo River
by Yu Songyan et al. showed that the structural
factors of TN spatial heterogeneity distribution are
agricultural land and forest land, and agricultural land
is the structural factor controlling the spatial
distribution of NO
3
-
-N. Existing studies have shown
that non-point sources have a greater impact on total
phosphorus pollution, but the changes in the
concentration of total nitrogen and phosphorus are
similar. The concentration of total nitrogen and
phosphorus around the city is generally higher in
winter and spring than in summer and autumn, and
the concentration of total nitrogen in areas dominated
by agriculture is higher in summer and autumn than
in winter and spring. The main reason is that the water
supply source of rivers around the city is mainly
domestic sewage and industrial wastewater tail water
during the dry season. The input of nitrogen and
phosphorus is the same but the dilution effect of
rainwater is weak, and the pollutant concentration is
higher than that during the wet season. However, the
agricultural area has more rain in summer. The large
amount of nitrogen and phosphorus in the farmland
has been eroded and lost, causing the total nitrogen in
the river to be higher than that in the dry season; the
water quality in the upper and lower reaches of the
space is better, and the concentration of pollutants in
the middle and lower reaches is gradually increasing.
In summary, although domestic and foreign
experts and scholars have carried out more studies on
the temporal and spatial characteristics of nitrogen
and phosphorus nutrients in rivers for different
temporal and spatial scales and different objects, due
to regional differences in physical geography,
environmental conditions, aquatic ecology, and
pollution sources, etc. There are still some differences
in the research conclusions. Therefore, for specific
rivers, exploring the temporal and spatial
characteristics of nitrogen and phosphorus nutrients
1308
Hu, H., Zhao, B. and Yang, M.
Temporal and Spatial Distribution Characteristics of Nitrogen and Phosphorus in Baisha River.
DOI: 10.5220/0011509000003443
In Proceedings of the 4th International Conference on Biomedical Engineering and Bioinformatics (ICBEB 2022), pages 1308-1313
ISBN: 978-989-758-595-1
Copyright
c
2022 by SCITEPRESS – Science and Technology Publications, Lda. All rights reserved
is of great significance to the protection of river water
quality. Therefore, this study took the Baisha River
as the research object, selected TP, TN, NH
4
+
-N
water quality indicators, and arranged 6 monitoring
points on the main stream and main tributaries of the
river. From February 2017 to January 2018 the water
quality of the Baisha River is continuously monitored
at the end of each month. On this basis, the temporal
and spatial distribution characteristics of nitrogen and
phosphorus in the Baisha River are analyzed, which
can provide a reference for the prevention and control
of nitrogen and phosphorus pollution in the Baisha
River.
2 DATA SOURCES AND
RESEARCH METHODS
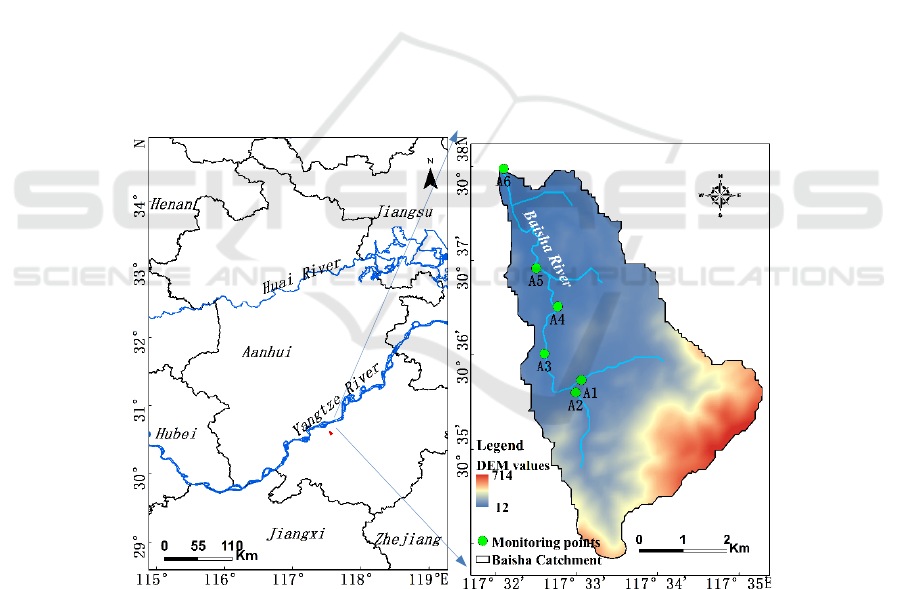
2.1 Overview of the Study Area
Baisha River is located in Guichi District, Chizhou
City, Anhui Province (Fig.1). It is one of the three
rivers flowing into Pingtian Lake. The upstream
originated near Longtouzhang Village, Guichi
District, Chizhou City. The Baisha River is about 9.3
kilometers long and flows through about 13 villages.
The Baisha River Basin has a subtropical monsoon
climate. The average temperature is around 4℃
during the coldest period and around 28℃ during the
hottest period. The land use in the Baisha River Basin
is dominated by forest land, accounting for 46.12%,
followed by cultivated land, accounting for 21.42%,
and construction land accounting for 16.29%.
2.2 Sampling Point Setting
According to the topography and landform
characteristics of the Baisha River, the monitoring
points are arranged on the basis of consideration of
the distance between the monitoring points and the
convenience of sampling (Fig.1). A total of 6 points
are arranged along the main stream of the Baisha
River, named A1 to A6 from upstream to
downstream. The sampling time is from February
2017 to January 2018, with sampling at the end of
each month.
Figure 1: Location of Baisha River Basin.
2.3 Sample Collection and Analysis
The polyethylene plastic bottles washed with clean
water are collected 1 to 2 meters from the shore,
depending on the depth of the river, water samples are
collected 10 to 40 cm below the surface of the water,
and the entire sampling time lasts for one day each
time. The collected water samples are placed in a
refrigerator and the measurement is completed within
24 hours. Total nitrogen was determined by
ammonium moly bdate spectrophotometry, total
phosphorus was determined by alkaline potassium
per sulfate digestion ultraviolet spectrophotometry,
and ammonia nitrogen was determined by rapid
digestion spectrophotometry.
Temporal and Spatial Distribution Characteristics of Nitrogen and Phosphorus in Baisha River
1309
3 RESULTS AND DISCUSSIONS
3.1 Characteristics of Nitrogen and
Phosphorus Nutrients
TN is the main pollutant of rivers (Table 1). The
concentration of TN is 0.458-5.320mg/L, with an
average value of 1.400mg/L, which exceeds the Class
III standard for surface water. The average value of
TP and NH
4
+
-N is lower than the surface water class
III standard, where the concentration of NH
4
+
-N is
0.010-0.416mg/L, the average value is 0.142mg/L;
the concentration of TP is 0.013-0.093mg/L, the
average value I is 0.035mg/L.
Table 1: Overall characteristics of Baisha River water quality (mg/L).
Water quality index
Reach Minimum Maximum Mean SD Ⅲ
TN
Upstream 0.572 3.203 3.616 1.277
1 Midstream 0.485 3.260 3.100 1.396
Downstream 0.543 5.320 3.252 1.520
NH
+
4
-N
Upstream 0.006 0.353 0.107 0.139
0.2 Midstream 0.010 0.259 0.104 0.111
Downstream 0.031 0.416 0.162 0.177
TP
Upstream 0.034 0.150 0.076 0.044
1 Midstream 0.013 0.091 0.052 0.031
Downstream 0.025 0.093 0.057 0.030
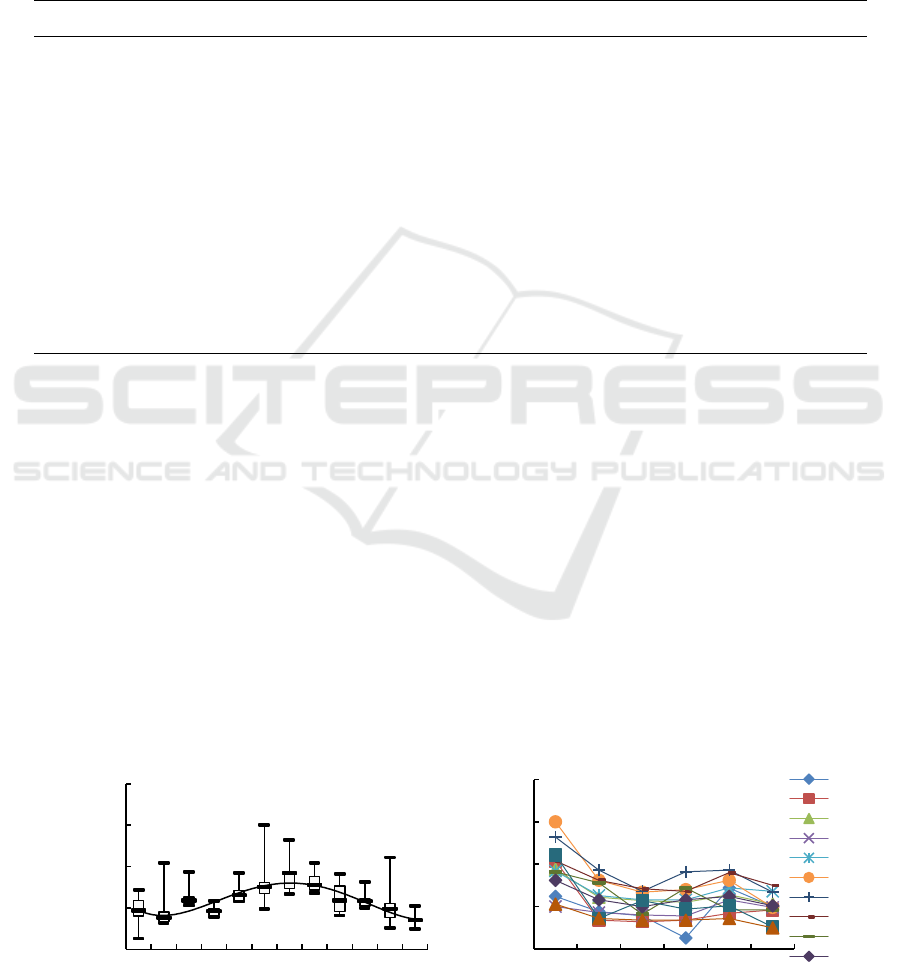
3.2 Temporal and Spatial Distribution
Characteristics of Total
Phosphorus
In terms of space, the monthly concentration of total
phosphorus at the monitoring points is less than
0.2mg/L (Fig.2), which meets the requirements of
surface water class III. Among them, the water
quality at the monitoring point A1 is the worst, and
the water quality at the monitoring points A3 and A4
is the best. Through the analysis of the surrounding
environment of each monitoring point, we found that
the monitoring point A1 is located at the intersection
of the two main tributaries, and the population located
on both sides of the east and upstream tributaries
along the riverbank is the most densely distributed.
The discharge of domestic sewage from residents
may be related to the total phosphorus content of
point R1. Higher related.
In terms of time, from February 2017 to January
2018, the total phosphorus concentration of Baisha
River showed a trend of first rising and then falling.
The total phosphorus concentration is the highest in
summer, followed by spring and autumn, and the
lowest in winter. This is because the area where the
original Baisha River flows is mainly agricultural
farming areas. Summer is a period when agricultural
fertilization is concentrated, and there is more rain.
Under the effects of rainwater leaching and soil
erosion, the phosphate fertilizer in the farmland
enters In the river, the total phosphorus content is
therefore high.
0,00
0,05
0,10
0,15
0,20
234567891011121
TP/mg
·
L
-1
0,00
0,05
0,10
0,15
0,20
A1 A2 A3 A4 A5 A6
TP/mg
.
L
-1
2
3
4
5
6
7
8
9
10
11
ICBEB 2022 - The International Conference on Biomedical Engineering and Bioinformatics
1310
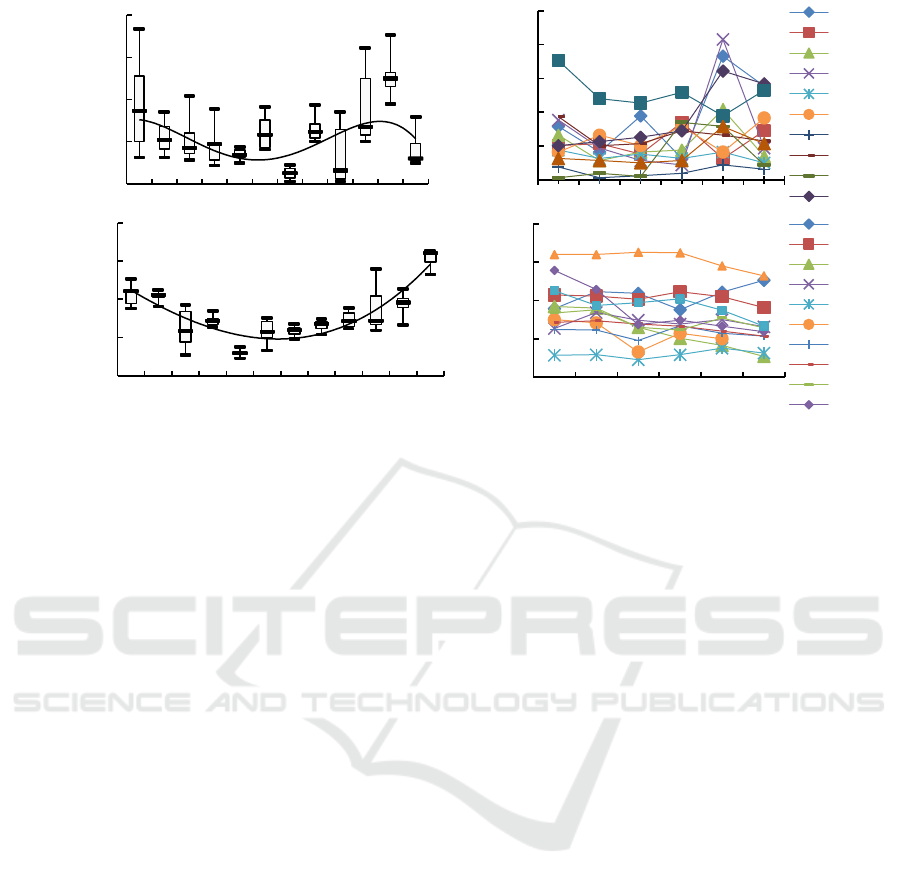
Figure 2: Temporal and spatial distribution of nitrogen and phosphorus.
3.3 Temporal and Spatial Distribution
Characteristics of Ammonia
Nitrogen
From a spatial point of view, the average monthly
ammonia nitrogen concentration at each monitoring
point during the monitoring period was better than the
Class III water quality standard. Among them,
monitoring point A2 has the smallest concentration
value of 0.089mg/L, and the highest concentration is
monitoring point A5, which is 0.164mg/L, and
fluctuates greatly with seasonal changes. The water
quality at other points has little difference. Ammonia
nitrogen is the reduced state of nitrogen, and an
increase in ammonia nitrogen indicates that the water
body has recently been polluted. Through the analysis
of the surrounding environment at more A5 points, it
can be found that the largest source of ammonia
nitrogen is agricultural non-point source pollution.
From the time point of view, the ammonia
nitrogen content of Baisha River is the lowest in
summer. This may be because there are more algae
growth in summer, resulting in insufficient dissolved
oxygen in the lake. NH
4
+
-N can be converted into
NO
3
-
-N under the action of anaerobic
microorganisms; on the other hand, summer rainfall
is abundant, A large amount of precipitation made the
ammonia nitrogen in the water body of Baisha River
be greatly diluted. In February and December, the
ammonia nitrogen content increased significantly.
There are no large-scale enterprises near the Baisha
River, so it is unlikely that the external input of
industrial wastewater will cause an increase in the
concentration of ammonia nitrogen. Therefore, the
reason for the significant increase in the
concentration of ammonia nitrogen may be due to the
significant decrease in precipitation in the month and
the large amount of river water evaporation during
the dry season, thus causing the concentration of
ammonia nitrogen in Baisha River increased
significantly.
3.4 Temporal and Spatial Distribution
Characteristics of Total Nitrogen
The concentration of total nitrogen in Baisha River
belongs to Class IV water standard. The variation
range of total nitrogen concentration is 0.458-
3.26mg/L. Among them, the monitoring points A5
and A6 have the lowest concentration, and the other
points have little change. This may be because points
A5 and A6 do not belong to agricultural farming
areas, and agricultural non-point sources have little
impact on them.
From the time point of view, the total nitrogen
concentration is highest in winter and lowest in
summer. Among them, the total nitrogen
concentration was the lowest in June. The increase in
precipitation in June and the increase in water
temperature are conducive to the activity of
microorganisms in the water body. The intensity of
denitrification increases and consumes the inorganic
nitrogen that migrates to the water body, so that a
large amount of inorganic nitrogen is converted into
nitrogen and discharged into the water body. The total
nitrogen concentration is highest in January and
0,00
0,10
0,20
0,30
0,40
234567891011121
NH
4
+
-N/mg·L
-1
-
0,10
0,20
0,30
0,40
0,50
A1 A2 A3 A4 A5 A6
NH
4
+
-N/mg
.
L
-1
2
3
4
5
6
7
8
9
10
11
0,0
1,0
2,0
3,0
4,0
234567891011121
TN/mg·L
-1
Month
0,00
1,00
2,00
3,00
4,00
A1 A2 A3 A4 A5 A6
TN/mg
.
L
-1
Monitoring points
2
3
4
5
6
7
8
9
10
11
Temporal and Spatial Distribution Characteristics of Nitrogen and Phosphorus in Baisha River
1311
December. This is due to the decrease in winter
precipitation and the release of nitrogen from soil and
vegetation in the submerged water-level fluctuating
zone into the water body, followed by the release of
nitrogen in the sediment into the water body through
hydrodynamic changes.
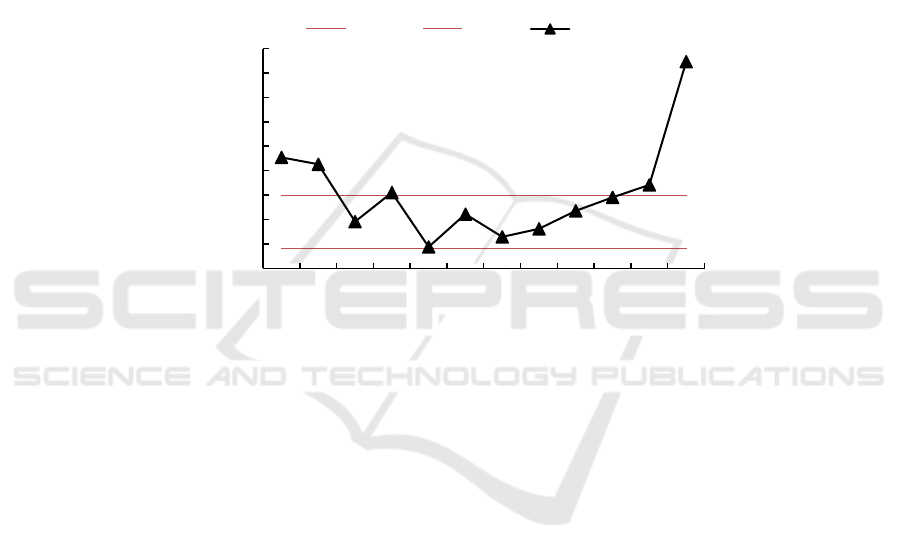
3.5 Water Body Eutrophication
Evaluation
N/P is the main indicator for investigating the
structure of nutrients. The growth of plants in water
is controlled by elements such as nitrogen,
phosphorus, and potassium. At the same time, the
ratio of various nutrients in the water body is also
important to the composition of aquatic communities.
The N/P value of ocean water is generally close to
16/1, which is the Redfield ratio, and the absorption
of nutrients by phytoplankton is basically close to this
ratio. Redfield ratio is a value used to evaluate the
occurrence of red tides in the ocean. In recent years,
many studies at home and abroad have also applied it
to freshwater bodies such as lakes and rivers. When
Redfield is used in freshwater water bodies, nitrogen
will usually limit the growth of algae when N/P<7,
and when N/P is 8-30, it is suitable for algae growth.
N/P>30, P will become the limiting factor for algae
growth.
Figure 3: N/P Seasonal changes of Baisha River.
It can be seen from Fig.3 that the Redfield ratio of N/P
in the Baisha River water body is between 8 and 30 for 8
months throughout the year, which is suitable for algae
growth. Therefore, it can indicate that the Baisha River
water body has the conditions for water bloom.
4 CONCLUSION
Based on the results and discussions presented above,
the conclusions are obtained as below:
(1) The indexes of total phosphorus, ammonia
nitrogen in the Baisha River water body are all lower
than the Class III water standard, and the total
nitrogen index exceeds the Class III water standard.
Seasonal water volume changes have an important
impact on changes in its concentration. The content
of total nitrogen and ammonia nitrogen in summer is
lower than that in winter and autumn, while total
phosphorus presents the opposite characteristics of
the other three standards, and autumn is significantly
higher than the other three seasons.
(2) From a spatial perspective, the concentrations
of total nitrogen show a decreasing trend from
upstream to downstream. The concentration of total
phosphorus is the lowest in the midstream, followed
by the upstream and the highest downstream.
(3) Although the monitoring indicators of total
phosphoru and ammonia nitrogen in the water body
are lower than the standard value, the evaluation of
the eutrophication of the water quality of the Baisha
River found that the conditions for blooming in the
water body of the Baisha River are sufficient.
Therefore, the water quality of the Baisha River
should be controlled to prevent the occurrence of
eutrophication of the water body.
ACKNOWLEDGMENTS
This work was financially supported by the Natural
Science Research Project of Colleges and
Universities of Anhui Province (KJ2018A0580).
0
10
20
30
40
50
60
70
80
90
123456789101112
N/P
Month
N/P=30 N/P=8 N/P
ICBEB 2022 - The International Conference on Biomedical Engineering and Bioinformatics
1312

REFERENCES
Chen C L, Gao M, Xie D T, et al. (2016) Spatial and
temporal variations in non-point source losses of
nitrogen and phosphorus in a small agricultural
catchment in the three Gorges region. Environmental
Monitoring and Assessment, 188 (4): 246-257.
Feng Y S, Lin T, Yang Q Y. (2014) Temporal and spatial
characteristic of nitrogen and phosphorus output in the
suburb watershed around the Baihua Lake.
Environmental Science,35 (12):4537-4543.
Fu B, Liu H B, Lu Y, et al. (2015) Study on characteristics
of nitrogen and phosphorus emission in typical small
watershed of plateau lakes: a case study of the Fengyu
river Watershed. Acta Scientiae Circumstantiae, 35(9):
2892-2899.
Hua L L, Li W C, Zhai L M, et al.(2017) Characteristics of
nitrogen and phosphorus emissions in the Gufu river
small watershed of the Three Georges reservoir area.
Environmental Science,38(1):139-146..
Liang F F, Jiang X J, Yuan J J, et al. (2012) Main features
of the loss of nitrogen and phosphorus and rainfall
intensity influence in the slope farmland of the Three
Gorges reservoir Area. Journal of Soil and Water
Conservation, 26(4): 81-85.
Ma X, Li Y, Zhang M, et al. (2011) Assessment and
analysis of nonpoint source nitrogen and phosphorus
loads in the Three Gorges reservoir Area of Hubei
Province, China. Science of the Total Environment,
412-413: 154-161.
Song L X, Liu D F, Cui Y J. (2016) Study on the
distribution of nonpointnitrogen and phosphorus load
from Xiangxi river in the Three Gorges reservoir. Acta
Scientiae Circumstantiae, 36(2): 428-434.
Thieu V, Billen G, Garnier J. (2009) Nutrient transfer in
three contrasting NW European watersheds: the Seine,
Somme, and Scheldt Rivers. A comparative application
of the Seneque /Riverstrahler modle. Water Research,
43(6):1740-1754.
Wu L, Long T Y, Liu X, et al. (2013) Modeling impacts of
sediment delivery ratio and land management on
adsorbed non-point source nitrogen and phosphorus
load in a mountainous basin of the Three Gorges
reservoir area, China. Environmental Earth Sciences,
70(3):1405-1422. .
Xi S S, Zhou C C, Liu G J, et al. (2016) Spatial and
Temporal Distributions of Nitrogen and Phosphate in
the Chaohu Lake. Environmental Science,37 (2): 542-
547.
Yu S Y, Xu Z X, Wu W, et al. (2014) Spatial variation of
water quality and its response to land use in the Beiluo
river Basin. Acta Scientiae Circumstantiae, 34(5):
1309-1315.
Zhang S, Zheng J, Liu T T, et al. (2009) Seasonal variation
and output of nutrient in tributaries of three Gorges
reservoir. Environmental Science, 30(1): 58-63.
Zhang L, Huang Z L, Xiao W F, et al. (2018)
Characteristics of nitrogen and phosphorus output in
runoff and rainfall runoff in Lanlingxi Watershed,
Three Gorges reservoir Area. Environmental Science,
39(2): 792-799.
Temporal and Spatial Distribution Characteristics of Nitrogen and Phosphorus in Baisha River
1313
