Study on Air Pollution Status of “2+26” Cities in
Beijing-Tianjin-Hebei and Its Surrounding Areas from 2016 to 2020
Jiaxin Lin
Huazhong University of Science and Technology, Wuhan, Hubei, 430000, China
Keywords:
Air Quality in 338 Cities, Beijing-Tianjin-Hebei Urban Air Pollution, Consultation Management.
Abstract:
This paper compares the air pollution control status of 338 prefecture-level and above cities in China with.
“2+26” cities in Beijing-Tianjin-Hebei and surrounding areas during 2016-2020, and finds that the air
pollution control level of “2+26” cities in Beijing-Tianjin-Hebei and surrounding areas is significantly lower
than the national average level. On the one hand, cities with good air quality accounted for 81.9% of the 338
cities, rising from 78.6% in 2016 to 84.7% in 2020, while cities in the Beijing-Tianjin-Hebei region and the
surrounding “2+26” cities with good air quality on average accounted for 33.5% of the cities with less than
50% of the days, from 34.4% in 2016 to 22% in 2020;On the other hand, the average concentration values of
major pollutants in 338 cities were lower than those in the Beijing-Tianjin-Hebei region, and 0
3
concentration
values showed an increasing trend during the treatment period. Thus, we should adhere to the policy
orientation in the future, continue to promote air pollution control for major pollutants, especially for 0
3
scientific and effective consultation treatment.
1 INTRODUCTION
The report to the 19th National Congress of the
Communist Party of China (CPC) in October 2017
clearly identified pollution prevention and control as
one of the three critical battles, stressing the need to
solve prominent environmental problems (Xi, 2017).
In June 2018 issued by the central committee of the
communist party of China, the State Council
"Strengthening ecological environment protection
are firmly lay the pollution prevention and control of
battle opinions, put forward the implementation of
winning blue sky battle battle plan, three years is
given priority to with Beijing-Tianjin-Hebei key area
and around the battlefield, adjusting and optimizing
industrial structure, energy structure, the structure of
the transportation and land use structure. Win at the
same time, the blue sky battle action plan for three
years after 3 years hard work, greatly reduce the
major air pollutants emissions, synergy to reduce
greenhouse gas emissions, to further reduce the
concentration of fine particles (PM
2.5
) obviously,
significantly reduce the heavy pollution days,
significantly improve the air environmental quality,
significantly improve the people's happiness in the
blue sky.
In August 2018, the state and local governments
jointly issued the 2018-2019 Autumn and Winter
Action Plan for Comprehensive Air Pollution Control
in the Beijing-Tianjin-Hebei Region and its
Neighboring Areas (hereinafter referred to as the
Beijing-Tianjin-Hebei Action Plan). The Action Plan
defines the specific scope of implementation and
proposes to adhere to the problem-oriented approach.
Based on the industrial structure, energy structure,
transport structure and land structure adjustment and
optimization (MEE,2018). However, due to the
significant increase in the emission of air pollutants
due to the demand for heating and relatively
unfavorable meteorological conditions, heavy
pollution weather in autumn and winter occurs
frequently in cities (Li, 2021). Under the premise of
a series of national policies and actions, this paper
aims to compare the changes of air quality between
338 cities in China and the Beijing-Tianjin-Hebei
region.
2 MATERIALS AND METHODS
In this paper, based on statistical methods, ecological
environmental protection for China urban air quality
in 2016-2020 published monthly data analysis (MEE,
1230
Lin, J.
Study on Air Pollution Status of “2+26” Cities in Beijing-Tianjin-Hebei and Its Surrounding Areas from 2016 to 2020.
DOI: 10.5220/0011390500003443
In Proceedings of the 4th International Conference on Biomedical Engineering and Bioinformatics (ICBEB 2022), pages 1230-1234
ISBN: 978-989-758-595-1
Copyright
c
2022 by SCITEPRESS – Science and Technology Publications, Lda. All rights reserved
2020), The average value is obtained to compare the
air quality with the main pollutants in the city.
3 RESULTS AND DISCUSSION
3.1 Air Quality Has Been Continuously
Improved in 338 Cities Across the
Country
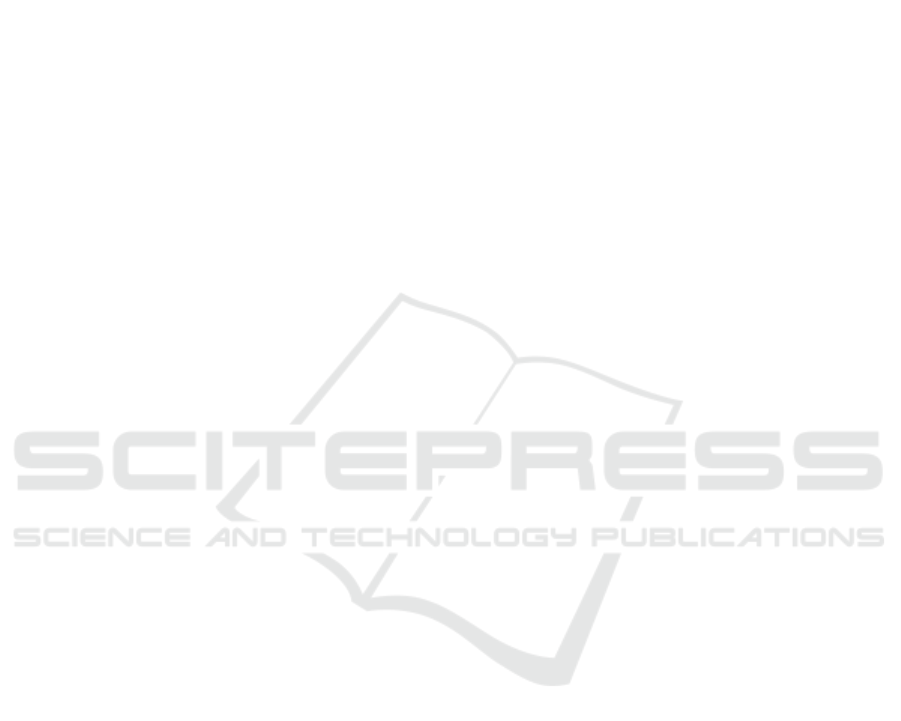
Figure 1. shows that ,according to the assessment of
the Environmental Air Quality Standard (GB3095-
2012)in 2020, the average number of days with good
air quality in 338 cities at or above the prefecture
level is 87.1%, the number of days with mild
pollution is 9.8%, the number of days with moderate
pollution is 1.9%, and the number of days with severe
or above pollution is 1.2%.Compared with last year,
the proportion of days with good quality increased by
5 percentage points, and the proportion of days with
heavy pollution or above decreased by 0.5 percentage
points. Compared with 2016, the proportion of days
with good quality increased by 8.5 percentage points,
and the proportion of days with heavy pollution or
above decreased by 1.5 percentage points. The
proportion of good days is increasing while that of
polluted days is decreasing.
Figure 1: Percentage of average air quality days in 338 cities from 2016 to 2020 (%)..
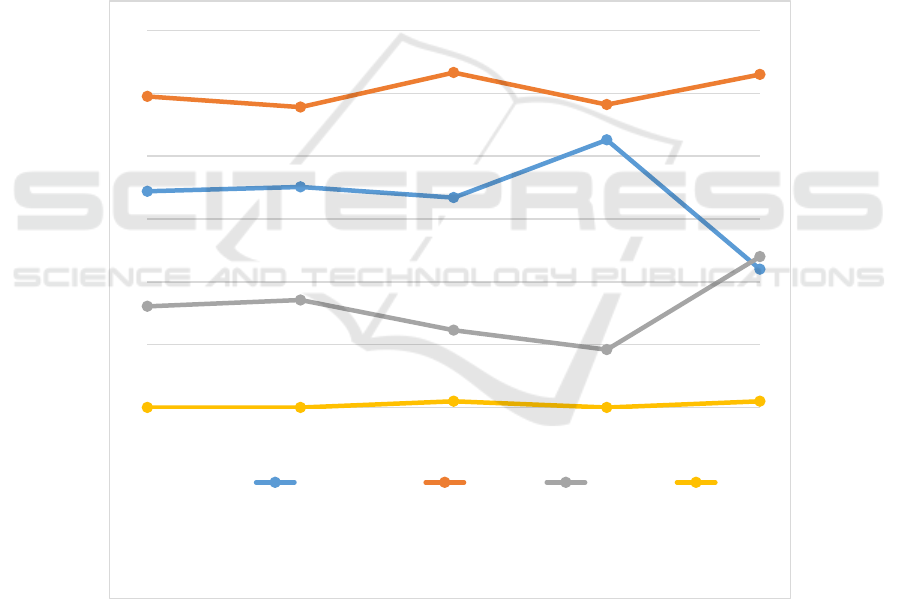
Table 1. shows that in 2020, the average
concentration of PM
2.5
, PM
10
, SO
2
and NO
2
is
32.6μg/m
3
, 55.9μg/m
3
, 10.1μg/m
3
and 24.3μg/m
3
,
respectively, in 338 cities at or above the prefecture
level. Compared with 2016, there are different
degrees of decline. However, O
3
daily maximum 8-
hour average 90th percentile concentration averaged
120.1μg/m
3
, an increase of 3.1% compared to
2016.Therefore, there are prominent problems in O
3
treatment.
Table 1: Average concentration of major pollutants in338 cities from 2016 to 2020.
Year PM
2.5
(μg/m
3
) PM
10
(μg/m
3
) SO
2
(μg/m
3
)
NO
2
(μg/m
3
)
O
3
(μg/m
3
)
2016 46.8 82.4 22.3 30.2 116.9
2017 44.1 78.9 18.4 30.9 126.9
2018 39.5 71.8 14.4 29.2 130.1
2019 36.3 63.8 11.3 27.1 123.9
2020 32.6 55.9 10.1 24.3 120.1
78,6
78,2
80,9
82,1
87,1
14,9
15,5
14,5
13,3
9,8
3,8 3,8
3,1
2,9
1,9
2,7
2,5
1,5
1,7
1,2
0
10
20
30
40
50
60
70
80
90
100
2016 2017 2018 2019 2020
Good Light pollution
Moderate pollution Severe and above pollution
Study on Air Pollution Status of “2+26” Cities in Beijing-Tianjin-Hebei and Its Surrounding Areas from 2016 to 2020
1231
3.2 The Air Pollution Control Situation
in Beijing-Tianjin-Hebei and Its
Surrounding "2+26" Cities Is Not
Optimistic
3.2.1 The Average Number of Days with
Good Air Quality in "2+26" Cities in
Beijing-Tianjin-Hebei and
Surrounding Areas Was Fewer from
2016 to 2020
Statistics show that, the average number of days with
good air quality in "2+26" cities in the Beijing-
Tianjin-Hebei region and surrounding areas was
63.5%in 2020, an increase of 10.4% year on year and
That was an increase of 6.3% compared with 2016,
and air quality continued to improve.
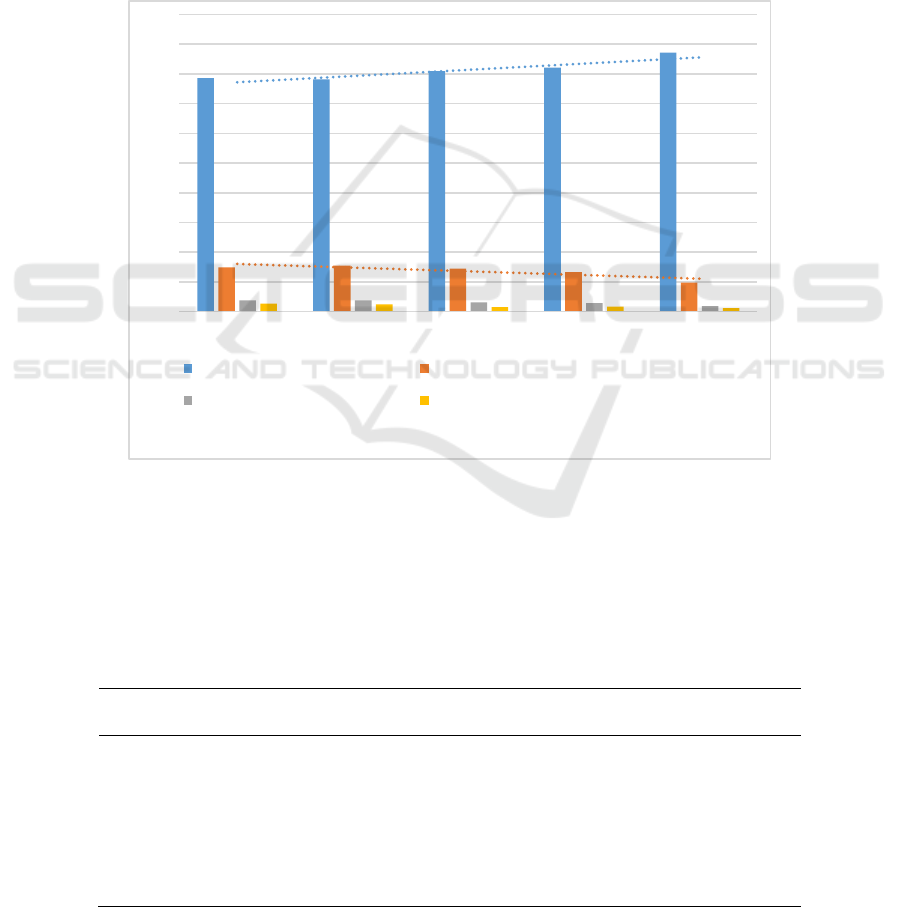
Figure 1. shows that the "less than 50%"
proportion of "2+26" cities in Beijing-Tianjin-Hebei
and its surrounding areas has the highest value of
42.6% in 2019, and the "80%~100%" proportion of
cities has the highest value of 9.2%. In 2020, the
proportion of "22%" and "24%" respectively. In
2020, the average air quality in the "2+26" cities in
the Beijing-Tianjin-Hebei region and its surrounding
areas will reach a record high. It can be seen from
Figure 2 that the change of average air quality in
"2+26" cities in Beijing-Tianjin-Hebei and
surrounding areas mainly depends on the fluctuating
changes of "less than 50%" and "between 80% and
100%". Only 25 percent of the cities had good days
on more than 80 percent of the days, while only 25
percent had good weather, reflecting the severe air
pollution in the "2+26" cities in the Beijing-Tianjin-
Hebei region and surrounding areas.
Figure 2: Percentage of average days of “2+26”urban air quality in Beijing-Tianjin-Hebei region from 2016 to 2020
3.2.2 Emission Status of Major Air
Pollutantsin "2+26" Cities in Beijing-
Tianjin-Hebei and Surrounding Areas
By comparing Fig. 3 with Fig. 4, it can be found that,
firstly, the average concentration of major air
pollutants in 338 cities decreased by 144%, SO
2
, and
O
3
increased by 2.6%. Second, the largest decrease in
the average concentration of major air pollutants in
Beijing-Tianjin-Hebei and surrounding "2+26" cities
was SO
2
, which decreased by 121%, while O
3
increased by 2.7 percent. Finally, on the whole, the
average concentration of major air pollutants in
Beijing-Tianjin-Hebei and surrounding "2+26" cities
34,4
35,1
33,4
42,6
22
49,5
47,8
53,3
48,2
53
16,1
17,1
12,3
9,2
24
00
1
0
1
0
10
20
30
40
50
60
2016 2017 2018 2019 2020
Less than 50% 50-80% 80-100% 100%
ICBEB 2022 - The International Conference on Biomedical Engineering and Bioinformatics
1232
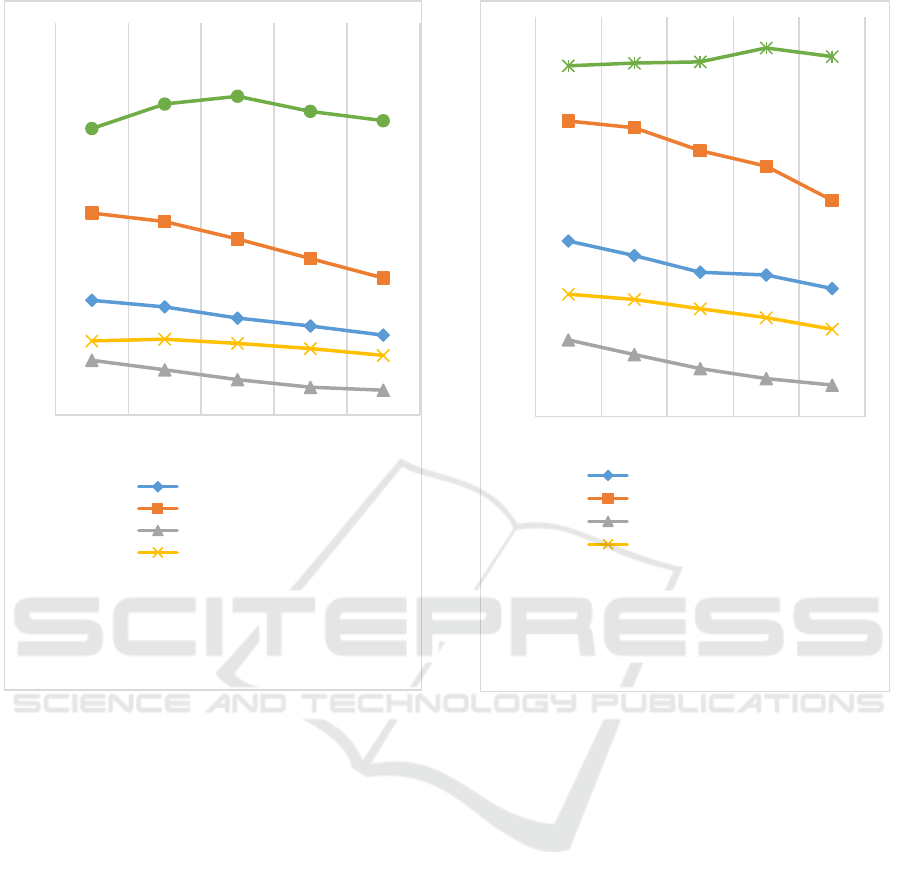
Figure 3: Average concentration of major pollutants in 338
cities from 2016 to 2020
was higher than the average level of 338 cities, and
the average decrease rate of major air pollutants was
lower than that of 338 cities.
It is worth noting that the average concentration
of O
3
, a major air pollutant, dropped in 338 cities after
reaching a high value in 2018, while the cities in the
Beijing-Tianjin-Hebei region and surrounding areas
peaked in 2019 in the"2+26"region. This change
should be closely related to the implementation of
“the Beijing-Tianjin-Hebei Action Plan”.
3.3 Factors of O
3
Pollution Control in
"2+26" Cities in Beijing-Tianjin-
Hebei and Surrounding Areas
The generation of ozone is mainly affected by the
synergistic effects of its precursors VOCs and NOx
emissions. However, different regions in China are
sensitive to different levels of ozone precursors, so it
is necessary to carry out regional prevention and
control
of ozone pollution areas (Zhang, 2021). The
Figure 4: Average concentration of major pollutants in
“2+26”cities of Beijing-Tianjin-Hebei region from 2016 to
2020.
concentration of "2+26" O
3
in Beijing-Tianjin-Hebei
and its surrounding areas showed a trend of high in
the south and low in the north. The geographical
location difference and its distance had a great
influence on the uniformity distribution of ozone
concentration in different cities (Yao, 2020). The
"2+26" cities in the Beijing-Tianjin-Hebei region and
its surrounding areas are the transport channels for air
pollution in the region, with the most severe air
pollution. Geographic location, meteorological
conditions, industrial structure, energy consumption
and emission reduction policies are the most
important factors affecting the air quality change of
"2+26" cities in Beijing-Tianjin-Hebei region and its
surrounding areas from 2016 to 2020.
46,8
44,1
39,5
36,3
32,6
82,4
78,9
71,8
63,8
55,9
22,3
18,4
14,4
11,3
10,1
30,2
30,9
29,2
27,1
24,3
116,9
126,9
130,1
123,9
120,1
0
20
40
60
80
100
120
140
160
2016 2017 2018 2019 2020
PM2.5 (μg/m3)
PM10(μg/m3)
SO2 (μg/m3)
NO2 (μg/m3)
70,3
64,5
57,8
56,7
51,3
118,4
115,7
106,5
100,3
86,6
30,7
24,8
19,2
15,2
12,6
49
46,9
43,2
39,6
35
140,5
141,6
142,1
147,7
144,2
0
20
40
60
80
100
120
140
160
2016 2017 2018 2019 2020
PM2.5 (μg/m3)
PM10(μg/m3)
SO2 (μg/m3)
NO2 (μg/m3)
Study on Air Pollution Status of “2+26” Cities in Beijing-Tianjin-Hebei and Its Surrounding Areas from 2016 to 2020
1233
4 CONCLUSION
The study shows that O
3
is the most prominent and
typical pollutant in "2+26" urban air in Beijing-
Tianjin-Hebei and its surrounding areas. O
3
emission
control will become the core task of pollution control
in the future. On the one hand, ozone generation
mechanism, distribution characteristics and influence
factors should be analyzed and identified from their
own laws, identification and understanding of O
3
risk
areas, influence factors, influence characteristics and
control effects, to further alleviate urban air pollution
is of vital importance (Zhao, 2021).The
spatiotemporal distribution characteristics and
influencing factors of urban air pollution are mainly
studied from a single pollutant or a single
perspective, while the overall understanding of urban
air pollution is a complex and dynamic ecosystem
combining human and nature. On the other hand, we
will continue to promote air pollution prevention and
reduction measures and efforts, and give full play to
the most important role of good policies in ensuring
the continuous improvement of air quality in "2+26"
cities in Beijing-Tianjin-Hebei and its surrounding
areas (Li, 2021). We will uphold the belief that man
and nature are a community of life, and improve a
multi-faceted air pollution control system with the
government playing the leading role, the market
playing the main role and the public participating.
ACKNOWLEDGEMENTS
This paper is one of the periodic achievements of
"Research on Xi Jinping's Ecological Civilization
Thought" (Project No.2019JD710044), a special task
project of Humanities and Social Science Research of
the Ministry of Education in 2019; One of the
periodic achievements of "Research on the
Construction of Eco-environmental Community and
Its Legal Protection" (Project No.
2021WKYXZD001), a key liberal arts project of the
basic business funds of the central universities in
2021.
REFERENCES
Li H., Wang S.L., Zhang W.J., Wang H., Wang H., Wang
S.B., Li H.S. (2021) Characteristics and influencing
factors of "2+26" urban air quality in Beijing-Tianjin-
Hebei and surrounding areas [J]. Research of
Environmental Sciences,34(01):172-184.
Li. Y., Tang W., Du J.H, Zhang Z.Z., Du X.H., Xue Z.G.,
Meng F., Chai F.H., (2021) Effect evaluation of air
pollution control measures in autumn and winter in
Beijing-Tianjin-Hebei and its surrounding "2+26"
cities, https://doi.org/10.19674/j.cnki.issn1000-
6923.20210608.009.
The State Council of China, (2018) Guidelines on
Comprehensively Strengthening Ecological and
Environmental Protection and Firstly Fighting the
Battle of Pollution Prevention and Control,
http://www.xinhuanet.com/politics/2018-
06/24/c_1123028598.htm.
The State Council of China, (2018) A three-year action plan
to win the battle to protect our blue skies,
http://www.gov.cn/zhengce/content/2018-
07/03/content_5303158.htm.
The Ministry of Ecology and Environmental Protection,
(2018) 2018-2019 Autumn and Winter Comprehensive
Air Pollution Control Action Plan for Beijing, Tianjin,
Hebei and its Neighboring Areas, which clarified the
specific implementation scope.Beijing-tianjin-hebei
and around 2 + 26 cities, including Beijing, tianjin,
shijiazhuang, hebei province, tangshan, langfang,
baoding, cangzhou, hengshui, xingtai, handan city,
Shanxi Province, taiyuan, yangquan, changzhi,
jincheng, jinan, zibo, jining, Texas, liaocheng in
shandong province, binzhou, heze city, henan province
zhengzhou, kaifeng, anyang, hebi, xinxiang, jiaozuo,
puyang city.
The Ministry of Ecology and Environmental Protection,
(2020) National Urban Air Quality Report,
http://www.mee.gov.cn/hjzl/dqhj/cskqzlzkyb/.
Xi J.P, (2017) Decisive Victory in Building a Moderately
Prosperous Society in All Respects and Achieving the
Great Victory of Socialism with Chinese
Characteristics for a New Era: Report to the 19th
National Congress of the Communist Party of China.
Yao Q., Ma Z.Q., Hao T.Y., Fan W.Y, Yang X., Tang Y.X,
Cai Z.Y, Han S.Q., (2021) Spatiotemporal distribution
of ozone and estimation of background concentration
in Beijing-Tianjin-Hebei region.
https://doi.org/10.19674/j.cnki.issn1000-
6923.20210706.007.
Zhang H.Y., Wang Y., Lu Y.L., Wang Y.W., Yu C., Wang.
J.X, Cao D., Jiang H.Q., (2021), Identification of ozone
pollution control zones and control types in China.
https://doi.org/10.19674/j.cnki.issn1000-
6923.20210630.001.
Zhao X.L. (2021) Spatial and temporal distribution.
characteristics and influencing factors of typical air
pollutants in Chinese cities [D]. University of Science
and Technology of China, p. 1.
ICBEB 2022 - The International Conference on Biomedical Engineering and Bioinformatics
1234
