
Determination of Half-Life in Mutation Process of Polymerase Basic
Protein 1 Family from Influenza a Virus
Shaomin Yan
a
and Guang Wu
b
National Engineering Research Center for Non-Food Biorefinery, State Key Laboratory of Non-Food Biomass and Enzyme
Technology, Guangxi Academy of Sciences, 98 Daling Road, Nanning, 530007, Guangxi, China
Keywords: Bioinformatics, Amino-Acid Pair Predictability, Differential Equation, Evolution, Influenza A Virus,
Polymerase Basic Protein 1.
Abstract: The evolutionary process of a protein family is usually an up and down fluctuating curve when it presents in
the x, y coordinates, where the x-axis is time and y-axis is an evolutionary feature of proteins. This irregular
curve characterizes its patterns with various periodicities and unexplainable time frames. In the past, we
used the fast Fourier transform (FFT) to find these periodicities in hemagglutinin, a surface protein from
influenza A virus. However, FFT cannot distinguish the up and down fluctuations without periodicity. In
this study, we employ the analytical solution of a system of differential equations from our previous studies
to determine the half-life of evolution of the polymerase basic protein 1 (PB1) from influenza A virus from
1918 to 2009. We (i) converted 2352 PB1 into the predictable portion, (ii) presented these predictable
portions according to their sampling times with respect to subtypes, (iii) employed the analytical solution to
fit the predictable portions versus time profile, (iv) used several statistical measures to determine the
goodness-of-fit, and (v) obtained the half-life of evolutions with respect to subtypes. Although our study
sheds some insight onto the PB1evolution, much work is needed to better understand the virus evolution.
1 INTRODUCTION
1
It is widely acceptable and well known that
mutations in protein push the protein evolution
forward (Levine, 2020, Lyons, Lauring, 2018,
Bloom, Arnold. 2009). In the x, y coordinates, the x-
axis and y-axis are time and a protein feature, which
represents its evolution. Based upon this evolution-
time profile, one can easily perceive some particular
aspects of a protein evolution. In this x, y
coordinates, the y-axis is can be any protein feature
subject to mutations. In other words, a mutation
changes a given protein feature, which leads to a
different value in the y-axis.
In such x, y coordinates, the evolutionary process
can be a line up and down irregularly, no matter
whether it presents in alphabets, which are form of
protein, or in numeric values, which are converted
using any of 540-plus conversion methods
(Kawashima et al., 2008, Wu, Yan, 2008).
a
https://orcid.org/0000-0001-7642-3972
b
https://orcid.org/0000-0003-0775-5759
It is useful and meaningful to find the patterns in
such irregular up and down evolution-time profile.
In the past, our research group used the fast Fourier
transform to find the periodicity in the evolution of
hemagglutinins from influenza A virus (Wu, Yan,
2005, 2006). However, the evolution of
hemagglutinins does not have a unique periodicity,
but many periodicities, because the fast Fourier
transform can decompose a combined periodicity
into many components. Therefore, it would be more
useful and meaningful to pursue another aspect of
evolution, the half-life of irregular up and down
evolutionary line in the x, y coordinates.
In the past, our research group developed a
system of differential equations to describe the
evolution of influenza A virus hemagglutinins (Wu,
Yan, 2009), matrix protein 2 (Yan et al., 2009),
matrix protein 1 (Yan et al., 2010), polymerase
acidic protein (Yan, Wu, 2010), nucleoprotein (Yan,
Wu, 2011), and neuraminidase (Yan, Wu, 2021). We
prefer three terms of the analytical solution as y(t) =
A
1
e
-k1t
cos(
α
1
t+
φ
1) + A
2
e
-k2t
cos(
α
2
t+
φ
2
) + A
3
e
-
k3t
cos(
α
3
t+
φ
3
) + C, where y is the protein feature of
Yan, S. and Wu, G.
Determination of Half-Life in Mutation Process of Polymerase Basic Protein 1 Family from Influenza A Virus.
DOI: 10.5220/0011377200003443
In Proceedings of the 4th International Conference on Biomedical Engineering and Bioinformatics (ICBEB 2022), pages 1051-1056
ISBN: 978-989-758-595-1
Copyright
c
2022 by SCITEPRESS – Science and Technology Publications, Lda. All rights reserved
1051

evolution, A,
α
and k are parameters, t is the time,
ϕ
is a phase difference, and C is a constant.
In this study, we are interested in the polymerase
basic protein 1 (PB1) from influenza A virus. PB1 is
a subunit of RNA-dependent RNA polymerase
complex, which is associated with the transcription
and replication of the influenza A viral genome
(Engelhardt, Fodor, 2006, Nayak et al., 2004). PB1
is important for the efficient propagation of the virus
in the host and for its adaptation to new hosts
(Brower-Sinning et al., 2009) and considered as a
determinant of the pathogenicity of the 1918
pandemic virus (Watanabe et al., 2009). Besides,
PB1 is the major target for both CD4(+) and CD8(+)
T-cell responses (Assarsson et al., 2008). Because of
this importance, we wish to find some patterns in
PB1 evolution.
2 MATERIALS AND METHODS
2.1 Data
5125 full-length PB1s of influenza A virus sampled
from 1918 to 2009 were obtained from the influenza
virus resources (Influenza virus resources, 2021).
After excluded identical sequences (Furuse et al.,
2009), 2352 PB1s were used in this study.
2.2 PB1 Evolution
In x, y coordinates, we use the time in the x-axis and
the amino-acid pair predictability (AAPP) of each
PB1 as protein evolution feature in the y-axis, and
AAPP was computed with the following example.
ABL31752 PB1 from human H5N1 influenza virus,
strain A/Indonesia/CDC836/2006(H5N1), comtains
757 amino acids. The first and second amino acids
can be counted as an adjacent amino-acid pair, the
second and third as another pair, the third and fourth,
until the 756th and 757th, thus there are totally 756
adjacent amino-acid pairs.
This PB1 has 51 serines (S) and 59 threonines
(T), if the permutation can predict the appearance of
amino-acid pair ST: it must appear 4 times
(51/757×59/756×756=3.97). Actually it does appear
four times, so the pair ST is predictable. In contrast,
this PB1 has 33 phenylalanines (F) and 50 glutamic
acids (E), if the permutation can predict the
appearance of amino-acid pair FE: it must appear
twice (33/757×50/756×756=2.18). But, it appears
six times in realty, so the pair FE is unpredictable. In
this way, all amino-acid pairs in ABL31752 PB1 can
be classified as predictable and unpredictable, which
are 26.98% and 73.02%.
In the second example, ABL31774 PB1 from
human influenza virus isolated in 2006 has only one
amino acid different from ABL31752 PB1 at
position 598. However, its predictable and
unpredictable portions are 25.40% and 74.60%.
Thus, AAPP distinguishes one PB1 from another in
terms of numbers rather than alphabets that represent
amino acids.
In this manner, we can use 26.98% to represent
ABL31752 PB1 and 25.40% to represent ABL31774
PB1 in the y-axis of x, y coordinates. This method is
applied to all 2352 PB1 in this study.
2.3 Half-Life of Evolution and
Statistics
We use the analytical solution shown in Introduction
to fit the AAPP-time profile to get the half-life. The
t-test was employed to compare the difference
between uphill and downhill half-life, and P < 0.05
is considered significant. The fitting was conducted
using SigmaPlot (SPSS Inc., 2002).
3 RESULTS AND DISCUSSION
Figure 1 shows the evolution of 2352 PB1s over 90
year for the NA subtypes. Graphically, Figure 1 has
the following meanings: the solid curve in the top
panel presents the evolution of 2352 PB1s from
1918 to 2009, and each point is the mean value of
predictable portions of all PB1s in a given year with
its standard deviation (vertically grey line). The
dotted line is the fitting by three-term of analytical
solution. Similarly, the same meanings can be
applied to other panels. In top panel, the time starts
from 1918, when the Spanish pandemic occurred,
for N1 subtype. However, this is not the case for the
rest NA subtypes. Therefore, the imbalanced data
may compromise us to use the analytical solution to
fit these AAPP-tine profiles to find out the half-life
of evolution. Thus, we conducted three statistical
tests to determine the goodness-of-fit when we use a
three-term analytical solution to treat these
evolutionary curses.
ICBEB 2022 - The International Conference on Biomedical Engineering and Bioinformatics
1052
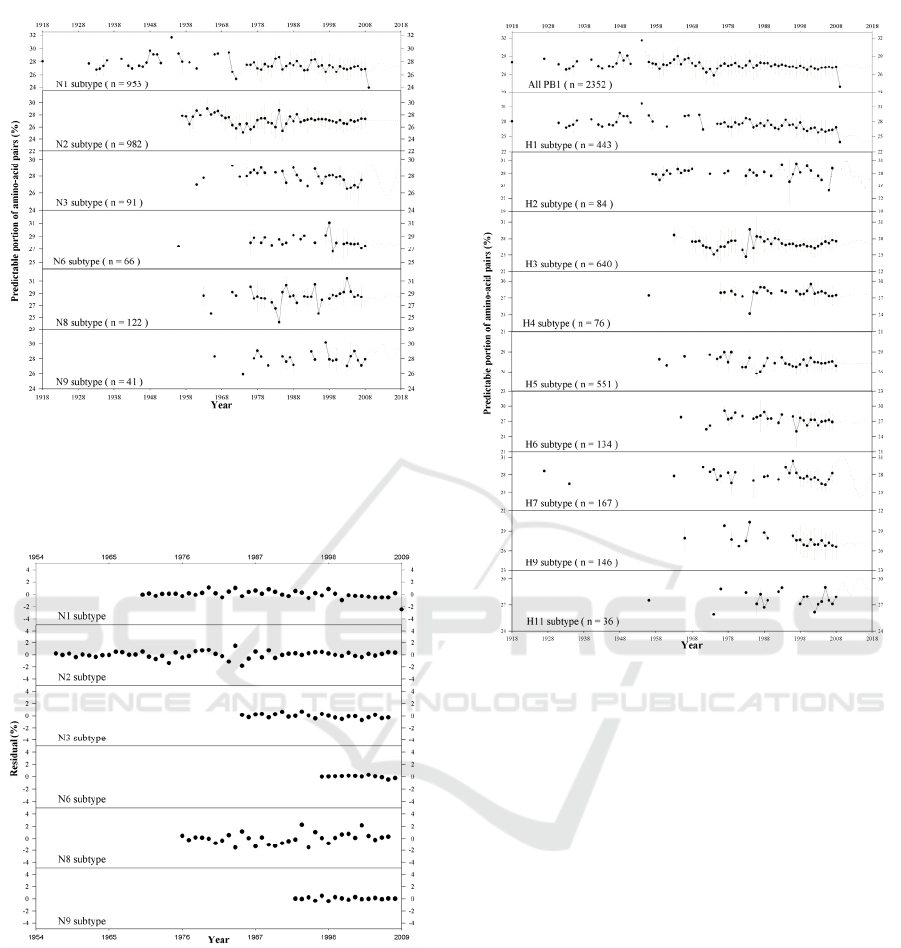
Figure 1: Evolution of influenza A virus PB1 family from
1918 to 2009 in terms of predictable portion of AAPP in
different NA subtypes. The data present as mean±SD. The
dotted lines are fitted curves using analytical solution.
Figure 2: Residual over time for different NA subtypes.
Figure 2 demonstrates the goodness-of-fit for
fitting of data in Figure 1 by observing whether there
is a trend in plotting residual over time. Actually, we
cannot see any monotonic trend in any panel in
Figure 2 although there is a tendency that the longer
the time involved, the more the fluctuations.
Nevertheless, we observed the relatively large
fluctuations around 1980s.
Figure 3: Evolution of influenza A virus PB1s from 1918
to 2009 in terms of predictable portion of AAPP in all
PB1s and different HA subtypes. The data present as
mean±SD. The dotted lines are fitted curves using
analytical solution.
Figure 3 illustrates the evolution of 2352 PB1s
over 90 year for the HA subtypes. Graphically,
Figure 3 is completely similar to Figure 1, therefore,
all the implications in Figure 1 are applicable to
Figure 3. In Figure 3, we can see several
dramatically sharp decreases in AAPP while there is
only one such fall in Figure 1, suggesting the
difference between HA and NA subtypes.
Figure 4 exactly is the same as Figure 2, i.e. to
observe any trend of residuals over time for the
goodness-of-fit. Similarly, we cannot notice any
monotonic trend in all the panels in Figure 4,
suggesting a goodness-of-fit. Again, we can see
some fluctuations around 1980s. Both Figures 3 and
4 ran our first statistical test.
Determination of Half-Life in Mutation Process of Polymerase Basic Protein 1 Family from Influenza A Virus
1053
Figure 4: Residual over time in all and different HA
subtypes.
Figure 5 pictures the second statistical test, that
is, residuals versus fitted values. Here, we are still
looking for whether there is any trend between two
variables. Indeed, there is no any visible trend
although sometimes clusters formed.
Figure 6 manifests the third statistical test, say,
residuals versus actual values. Similarly, we wish to
find whether there is any trend in these panels. In
good agreement with the above two statistical tests,
we cannot find out any monotonic trend although the
residual increases as actual value increases in some
cases, which are generally attributed to the
unbalanced data because of difficulty in collecting
samples of influenza A virus. Collectively, these
three statistical tests confirmed goodness-of-fit when
using three exponential terms of analytical solution.
Figure 5: Residual versus fitted value of predictable
portion for all and different subtypes of PB1.
The solid curves in Figures 1 and 2 present the
change in predictable portions of the PB1s over
time. Their fluctuation renders us to find the
downhill and uphill half-life, which then serves as
initial values for fitting. With decaying exponential,
the half-life is t
½
=ln(2)/k=0.696/k, where k=(ln
ypeak
-
ln
ytrough
)/t
interval
, which is the downhill half-life.
Hereafter, we can compute the uphill half-life in the
similar way. Consequently, we can find the
parameters in the three terms of analytical solution
in Table 1.
Figure 6: Residual versus actual value of predictable
portion for all and different subtypes of PB1.
ICBEB 2022 - The International Conference on Biomedical Engineering and Bioinformatics
1054

In Table 1, the third term in the analytical
solution cannot be found by fitting for H4, H6, H9
and H11. This phenomenon may not be surprising
because the samples of those subtypes are quite
imbalanced. On the other hand, this also indicates
the limitation in fitting although the goodness-of-fit
looks good. In reality, these parameters lack physical
meanings in biological sense. This is the drawback
of application of mathematical methods in biological
and medical fields because it is always very hard to
relate a model parameter to a biological and medical
meaningful indicator.
Table 1: Parameters for analytical solution.
Subtype A
1
k
1
α
1
ϕ
1
A
2
k
2
α
2
ϕ
2
A
3
k
3
α
3
ϕ
3
C R
2
All -15.28 0.97 0.55 1.80 -0.28 0.00 2.01 -5.96 -0.23 0.00 0.89 6.75 27.41 0.53
H1 5.67 0.00 -0.04 0.52 -8.17 0.87 1.36 -3.56 0.40 0.00 1.04 -1.53 21.95 0.69
H2 13.48 0.35 0.45 3.94 2.22 0.00 0.58 6.48 -1.19 0.00 1.78 1.93 27.78 0.85
H3 -0.67 0.02 0.68 4.76 -1.52 0.04 -0.25 3.35 0.57 0.02 0.90 4.13 27.14 0.60
H4 1.13 0.13 1.71 -1.84 1.95 0.15 0.39 4.10 27.63 0.84
H5 3.75 0.17 1.52 -0.82 -2.37 0.11 0.42 0.85 3.34 0.12 1.32 -3.08 27.32 0.71
H6 4.10 0.33 2.02 -0.70 0.27 0.00 1.31 -1.57 26.91 0.98
H7 -14.93 0.86 2.02 -3.36 -2.18 0.00 0.49 1.78 -1.58 0.00 0.72 3.09 28.02 0.98
H9
-0.60 0.03 2.35
14.1
3
-5.35 0.81 1.26 0.61 27.10 0.92
H11 -3.80 0.12 0.19 4.94 -0.92 0.00 1.27 -0.38 29.07 0.84
N1
-0.46 0.00 1.08 1.07 -0.39 0.00 0.63 0.16
11.2
6
0.53 5.59 -0.54 27.25 0.54
N2 2.38 0.22 1.95 -2.76 2.82 0.07 -0.26 -4.15 0.31 0.03 1.21 -8.55 26.97 0.60
N3 -2.74 0.00 0.64 7.03 2.55 0.00 0.68 6.51 2.04 0.15 -1.21 -6.86 27.71 0.76
N6 -29.25 0.99 1.99 -0.31 -0.26 0.00 2.08 1.69 27.80 0.98
N8 2.17 0.06 1.08 0.30 1.01 0.04 1.55 8.05 1.88 0.05 0.46 -0.22 28.40 0.52
N9 0.73 0.00 1.50 -0.40 -0.81 0.00 -0.31 3.37 0.66 0.02 0.87 1.82 28.40 0.94
Table 2. Half-life between uphill and downhill in influenza A virus PB1.
Subtype U
p
hill half-life (
y
ears) Downhill half-life (
y
ears) t test
P value
Number Mean SD Number Mean SD
All PB1 11 50.34 15.94 12 38.34 16.25 0.09
H1 11 46.64 19.90 13 41.82 19.28 0.55
H2 10 36.73 15.45 8 36.73 15.45 0.64
H3 6 44.83 31.65 6 39.30 19.13 0.72
H4 3 30.42 18.69 5 49.72 22.93 0.27
H5 7 42.67 16.68 10 54.99 22.18 0.23
H6 7 36.76 15.51 7 41.66 25.39 0.67
H7 5 32.68 18.57 6 44.19 18.30 0.33
H9 4 52.40 26.01 6 56.27 19.33 0.79
H11 6 38.21 13.15 4 36.63 14.85 0.86
N1 10 50.74 19.01 11 40.19 15.97 0.18
N2 8 34.09 15.07 10 38.09 12.77 0.55
N3 6 64.18 29.62 6 42.95 13.58 0.14
N6 8 56.55 20.38 7 58.74 28.13 0.87
N8 5 23.63 16.89 7 26.79 19.00 0.77
N9 6 48.69 21.35 7 45.96 24.09 0.83
Table 2 lists the half-life with statistical
comparison, As no statistical difference was found
between uphill and downhill half-lives, we can see
that the half-life is ranged smaller in HA subtype
than that in NA subtype, especially for the uphill
half-life. Yet, the standard deviations (SD) are
actually quite large, suggesting the sampling number
is not large. This demonstrates another difficulty in
modeling, that is, the experimental data always do
not meet the demand from modelers. Therefore, do
we need to design an experiment according to
experimenters or modelers?
The pandemic/epidemic mechanism is extremely
complicated, and the current Covid-19 is the best
proof that we know too little to implement any
efficient and effective measures to stop the spread of
coronavirus. Because of rich data in influenza virus,
the detailed and comprehensive studies on influenza
virus nevertheless can enrich our knowledge on
Determination of Half-Life in Mutation Process of Polymerase Basic Protein 1 Family from Influenza A Virus
1055

influenza virus, which can extrapolate to
coronavirus.
4 CONCLUSIONS
In this study, we attempted to determine the half-life
of PB1 from influenza A virus in terms of its
evolutionary process. This is accomplished by using
a three-term analytical solution of a system of
differential equations obtained in our previous
studies. In this way, we hope to reveal another
aspect of virus evolution, however how to interpret
the meaning of model parameters still requires more
studies in the future.
ACKNOWLEDGEMENTS
Scientific Development Fund of Guangxi Academy
of Sciences (2021YFJ1203) was kindly
acknowledged.
REFERENCES
Assarsson, E. Bui, H. H., Sidney, J., Zhang, Q. J. Glenn,
Q., Oseroff, C., Mbawuike, I. N., Alexander, J.,
Newman, M. J., Grey, H, & A. Sette, (2008).
Immunomic analysis of the repertoire of T-cell
specificities for influenza A virus in humans. J. Virol.
82, 12241–12251.
Bloom, J. D. & F. H. Arnold, (2009). In the light of
directed evolution: pathways of adaptive protein
evolution. Proc Natl Acad Sci. 106 Suppl 1, 9995–
10000.
Brower-Sinning, R., Carter, D. M., Crevar, C. J., Ghedin,
E., Ross, T. M. & P. V. Benos, (2009). The role of
RNA folding free energy in the evolution of the
polymerase genes of the influenza A virus. Genome
Biol. 10, R18.
Engelhardt, O. G. & E. Fodor, (2006). Functional
association between viral and cellular transcription
during influenza virus infection. Rev. Med. Virol. 16,
329–345.
Furuse, Y., Suzuki, A., Kamigaki, T. & H. Oshitani,
(2009). Evolution of the M gene of the influenza A
virus in different host species: large-scale sequence
analysis. Virol. J. 6, 67–79.
Influenza virus resources. (2021).
https://www.ncbi.nlm.nih.gov/genome/viruses/
Kawashima, S., Pokarowski, P., Pokarowska, M.,
Kolinski, A., Katayama, T. & M. Kanehisa, (2008).
AAindex: amino acid index database, progress report
2008. Nucleic Acids Res. 36, D202–D205.
Levine, A. J., (2020). p53: 800 million years of evolution
and 40 years of discovery. Nature Rev. Cancer. 20,
471-480.
Lyons, D. M. & A. S. Lauring (2018). Mutation and
epistasis in influenza virus evolution. Viruses. 10, 407.
Nayak, D. P., Hui, E. K. & S. Barman (2004) Assembly
and budding of influenza virus. Virus Res. 106, 147–
165.
SPSS Inc., (2002). SigmaPlot for Windows Version 8.02.
Watanabe, T., Watanabe, S., Shinya, K., Kim, J. H., Hatta,
M. & Y. Kawaoka (2009) Viral RNA polymerase
complex promotes optimal growth of 1918 virus in the
lower respiratory tract of ferrets. Proc. Natl. Acad. Sci.
106, 588–592.
Wu, G & S. Yan, (2005). Timing of mutation in
hemagglutinins from influenza A virus by means of
unpredictable portion of amino-acid pair and fast
Fourier transform. Biochem. Biophys. Res. Commun.
333, 70–78.
Wu, G & S. Yan, (2006). Timing of mutation in influenza
a virus hemagglutinins by means of amino-acid
distribution rank and fast Fourier transform. Protein
Pept. Lett. 13, 143–148
Wu, G & S. Yan, (2009). Describing evolution of
hemagglutinins from influenza A viruses using a
differential equation. Protein Pept. Lett. 16, 794–804.
Wu, G & S. Yan. 2008. Lecture notes on computational
mutation, Nova Science Publishers. New York.
Yan, S. & G. Wu, (2010). Fitting evolutionary process of
polymerase acidic protein family from influenza A
virus with analytical solution of system of differential
equations. Guangxi Sci. 17, 247–254.
Yan, S. & G. Wu, (2011). Fitting evolutionary process of
influenza A virus nucleoproteins using analytical
solution of differential equation. Interdis. Sci. Comput.
Life Sci. 3, 128–137.
Yan, S. & G. Wu, (2021). Description of evolution of
neuraminidase from influenza A virus. Proceedings of
2nd International Conference on Computer Vision,
Image, and Deep Learning, SPIE 11911.
Yan, S. Li, Z., & G. Wu, (2010). Fitting evolution of
matrix protein 1 from influenza A virus using
analytical solution of differential equation. Protein
Pept. Lett. 17, 530–541.
Yan, S., Li, Z. C. & G. Wu, (2009). Fitting evolutionary
process of matrix protein 2 family from influenza A
virus using analytical solution of differential equation.
J. Biomed. Sci. Engineer. 2, 587–593.
ICBEB 2022 - The International Conference on Biomedical Engineering and Bioinformatics
1056
