
The Relationship between Regional, Race, Gender and the Number of
Deaths from Heart Disease
Boda Xie
Hong Kong Baptist University, Hong Kong, China
Keywords: Heart Disease, Race, Gender, Region.
Abstract: In the United States, heart disease continues to be the leading cause of death in the United States. The National
Heart, Lung and Blood Institute reports that heart disease and cancer account for about 50 percent of deaths
among people aged 45 to 64. This article used cardiac patient data from all 50 states in the United States in
2015. In this paper, the author conducted the research by analyzing the data via ANOVA and multiple linear
regression. The number of heart disease deaths (per 100,000 people) also varied significantly by gender, race
and region. Men were more likely to die from heart disease than women; Native Americans and blacks have
higher rates of death from heart disease than any other race; Regionally, people in four states — the District
of Columbia, Massachusetts, Minnesota and Rhode Island — were less likely to die from heart disease than
in the rest of the country.
1 INTRODUCTION
The 2019 report of the National Heart, Lung and
Blood Institute (Sally and Curtin 2019) shows that the
death rate of heart disease in the United States has a
downward trend. As can be seen from the graph, the
death rate of men is still higher than that of women,
and the death rate of blacks is higher than that of
whites.
Heart disease has a huge impact on the American
people. The study published by the American Heart
Association and the National Heart, Lung and Blood
Institute looked at trends and numbers in the number
of people with heart disease. The factors that
contribute to heart disease have not been thoroughly
studied. So, this is a big gap in the current research.
It is of great significance for the state government
to adjust the medical policy and the state people to
seek more effective health resorts.
Therefore, heart disease is a major cause of death
in the United States. This paper intends to explore
whether there is a significant difference in the number
of heart disease deaths among different genders, races
and regions. It also means that there are significant
differences in the chances of dying from heart disease
among people of different genders, races and regions.
2 THE BACKGROUND OR THE
DEFINITION OF THE HEART
DISEASE
Heart disease is the leading cause of death in both
men and women in the United States. In the United
States, someone dies of cardiovascular disease every
36 seconds (Centers for Disease Control and
Prevention 2020). Each year, about 655,000
Americans die of heart disease — 1 in 4 of them
(Virani, Alonso, Benjamin, Bittencourt, Callaway,
Carson, et al 2020).
Every 40 seconds someone in the United States
has a heart attack. Every year, about 805,000
Americans suffer a heart attack. Of these, 605,000
were first-time heart attacks and 200,000 occurred in
people who had already had a heart attack.
From 2014 to 2015, heart disease cost the U.S. an
estimated $219 billion annually. This includes health
care services, medicines and lost productivity due to
death (Fryar, Chen and Li 2019).
Coronary heart disease is the most common type
of heart disease, causing 365,914 deaths in 2017.
Approximately 18.2 million adults age 20 and older
have coronary heart disease (approximately 6.7%).
Approximately two in 10 coronary heart disease
deaths occur in adults under 65 years of age
(Benjamin, Muntner, Alonso, Bittencourt, Callaway,
456
Xie, B.
The Relationship between Regional, Race, Gender and the Number of Deaths from Heart Disease.
DOI: 10.5220/0011372100003438
In Proceedings of the 1st International Conference on Health Big Data and Intelligent Healthcare (ICHIH 2022), pages 456-464
ISBN: 978-989-758-596-8
Copyright
c
2022 by SCITEPRESS – Science and Technology Publications, Lda. All rights reserved

Carson, et al 2019). About a fifth of heart attacks are
silent — the damage is done but the patient doesn’t
realise it.
Heart disease is the leading cause of death among
minority groups in the United States, including
African-Americans, American Indians, Alaska
Natives, Hispanics and whites. For women from the
Pacific Islands, as well as Asian American, American
Indian, Alaska Native and Hispanic women, heart
disease is only second to cancer (Heron 2019).
Death rates from heart disease and diabetes rose
significantly in the United States in 2020, and experts
believe a big reason may be that many people with
dangerous symptoms made the fatal mistake of
staying out of the hospital for fear of contracting the
coronavirus. It’s been the deadliest year in U.S.
history, and that’s largely because of COVID-19. But
death rates from heart disease and diabetes increased
by the most in at least 20 years, the data showed. The
death rate from heart disease rose to 167 per 100,000
from 161.5 the previous year. This is only the second
time in 20 years that the rate has risen. That’s more
than 3 percent, up from less than 1 percent in 2015. In
the raw numbers, there were about 32,000 more
deaths from heart disease than in the previous year.
3 RESULTS OF THE STUDY
3.1 Data Frequency and Descriptive
Statistics
First, the author sorted out the frequency table of
variables as shown below.
Table 1: Frequency statistics of each variable.
The Relationship between Regional, Race, Gender and the Number of Deaths from Heart Disease
457
As can be seen from Table 1, there are 13,870
samples in total, including 7,135 males and 6,735
females, with a proportion of 51.44% and 48.56%
respectively. Among ethnic groups, the Indian sample
was the least, with 753 people, accounting for 5.43%;
The white sample was the largest, 6,353 people,
accounting for 45.80%; Except for Indians and
Asians, there are more than 1300 people of other
ethnic groups, and the samples of other ethnic groups
account for more than 10%. There were only 10
samples in the least area, accounting for 0.07%; The
largest region, Texas, had 1,331 samples, or 9.60%.
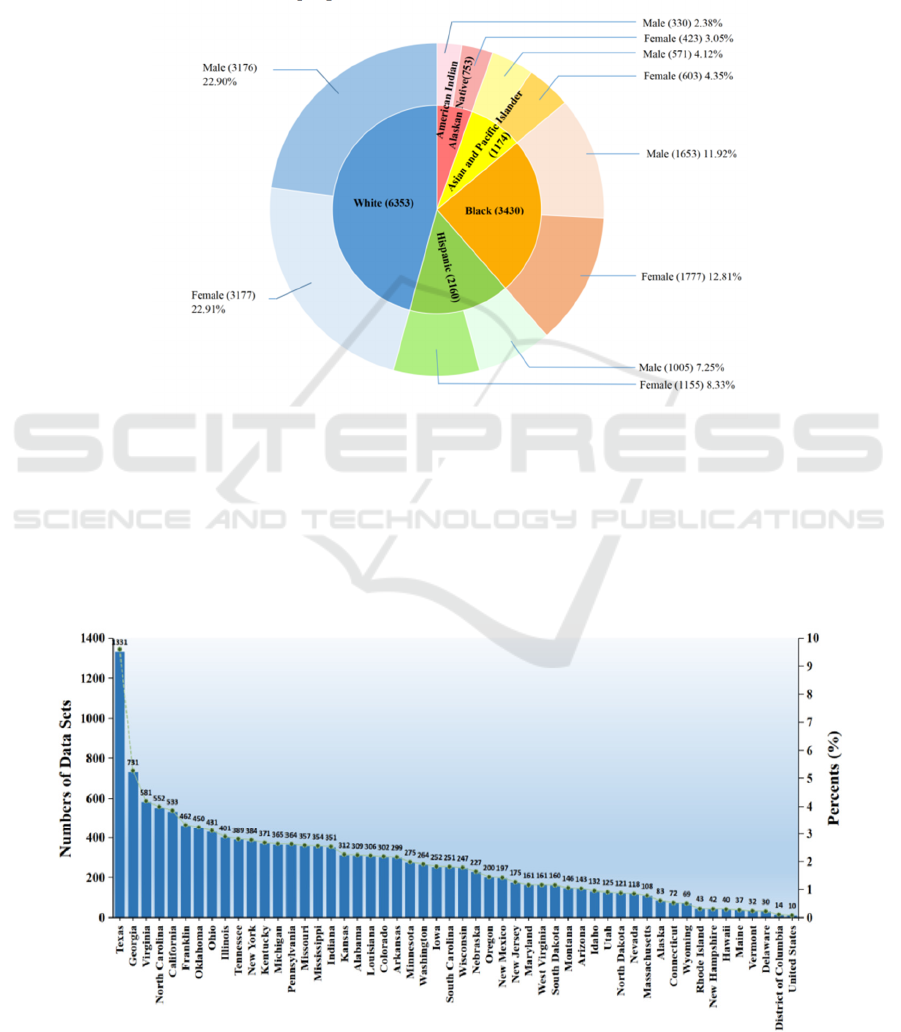
In order to display the frequency information of
data more clearly, the author made the pie chart of
gender distribution of each race as shown below.
Figure 1: Gender distribution of each ethnic group.
As can be seen from Figure 1, in our data, white
people have the largest sample size (6353 samples),
followed by black people (3430 samples), Hispanics
(2160 samples), Asians (1174 samples) and
American Indians (753 samples). The overall sample
size is large, and the sample ratio of male and female
of each race is close to 1:1, avoiding the deviation
caused by too little data.
Further, the author made a bar chart of the
frequency and proportion of data in each region of the
United States, as shown in the figure below.
Figure 2: Frequency and proportion of data by region.
ICHIH 2022 - International Conference on Health Big Data and Intelligent Healthcare
458

As can be seen from Figure 2, Texas has the
largest number of data samples, with 1,331 samples.
Far more than Georgia’s 731 samples.
As for the number of deaths from heart disease,
we classified the number of deaths from heart disease
by gender and race in different regions of the United
States in 2015, and then conducted descriptive
statistics on the number of deaths from heart disease
per 100,000 people to observe its distribution
characteristics, as shown in the figure below.
Figure 3: descriptive statistics of deaths from heart disease (per 100,000) in the United States in 2015As can be seen from
Figure 3, the average number of deaths from heart disease in the United States was 348.1 and the median was 331.5. Where
the minimum value is 0; 25% quantile was 233.1; the 75% quantile is 442.9, while the maximum value is 5161.7. It can be
seen that the data shows a right-biased distribution, with more data below the mean on the whole, and a few data are larger.
It can be seen that the number of deaths from heart disease in the United States as a whole is low and well controlled, and
only a few areas have poor outcomes and outliers.
3.2 One-way ANOVA
To analyze whether there are differences in the
number of heart disease deaths among different
genders, different races and different regions, one-
way ANOVA was used for each variable (Wilkinson
and Rogers 1973).
First, we conducted one-way ANOVA for gender
to verify whether there is a significant difference in
the number of heart disease deaths of different
genders. The original hypothesis of ANOVA is that
there is no significant difference in the number of
heart disease deaths of different genders.
Figure 4: One-way ANOVA for gender grouping.
As can be seen from Figure 4, the death rate of
heart disease in females is about 272±107, and that in
males is about 420±174. After one-way ANOVA, the
F statistic was 3619 and P value <0.05, indicating that
we rejected the null hypothesis at the significance
level of 5%. There are significant differences between
the sexes in the number of heart disease deaths.
The Relationship between Regional, Race, Gender and the Number of Deaths from Heart Disease
459
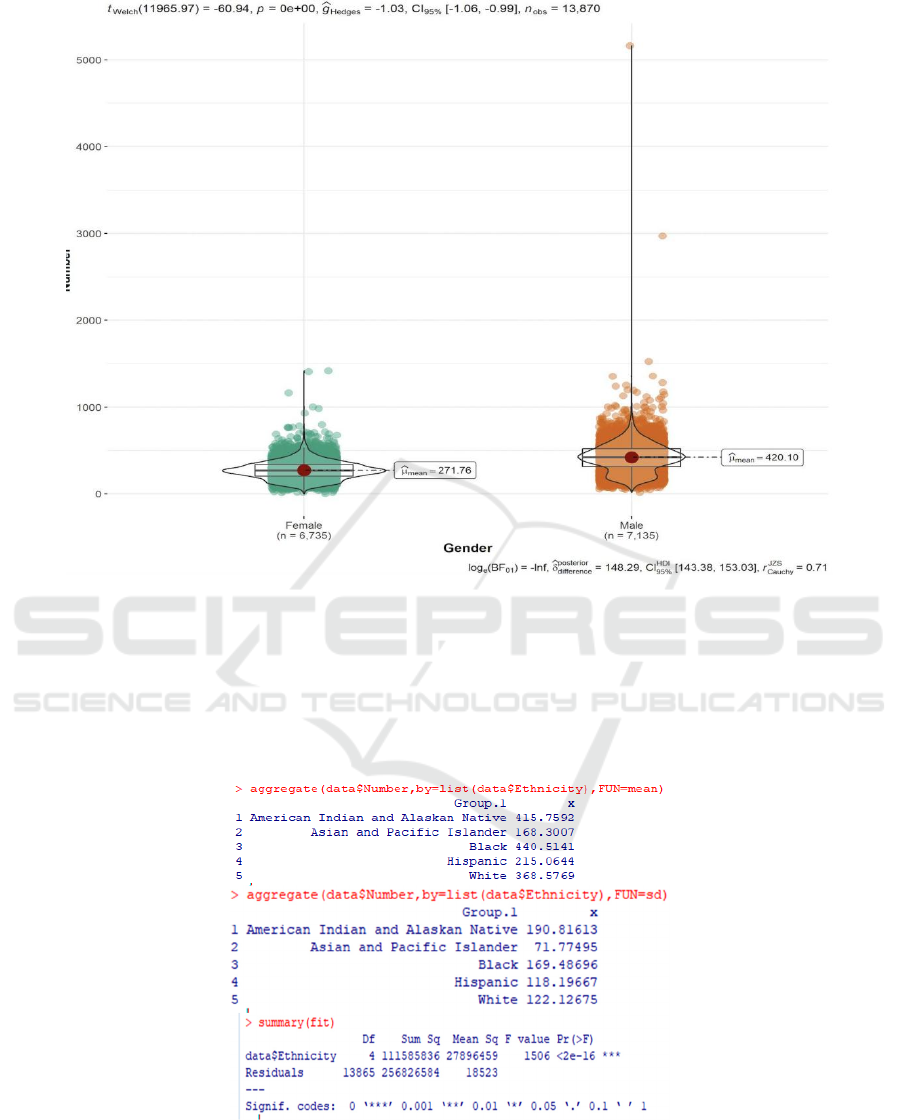
Figure 5: Data distribution of different gendersIt can be further seen from Figure 5 that the average number of heart disease
deaths was 420.10 for males and 271.76 for females. The average number of male deaths is about 1.55 times that of female
deaths. The overall data distribution was significantly higher for men than for women
.
Second, the author conducted a one-way ANOVA
on race to verify whether there was significant
difference in the number of heart disease deaths
among different races. The original hypothesis of
ANOVA was that there was no significant difference
in the number of heart disease deaths among different
races.
Figure 6: Results of variance analysis of different races.
As can be seen from Figure 6, the death toll from
heart disease among American Indians is about
415.76±190.81, Asians 168.30±71.77, African
Americans 440.51±169.48 and Hispanics
215.06±118.20. The number of heart disease deaths
among white Americans was 368.58±122.13. The
ICHIH 2022 - International Conference on Health Big Data and Intelligent Healthcare
460
results of one-way ANOVA showed that the F
statistic was 1506 and the P value was <0.05,
indicating that we rejected the null hypothesis at the
significance level of 5%. There are significant
differences in heart disease deaths among ethnic
groups. The data distribution of specific ethnic groups
is shown in the figure below.
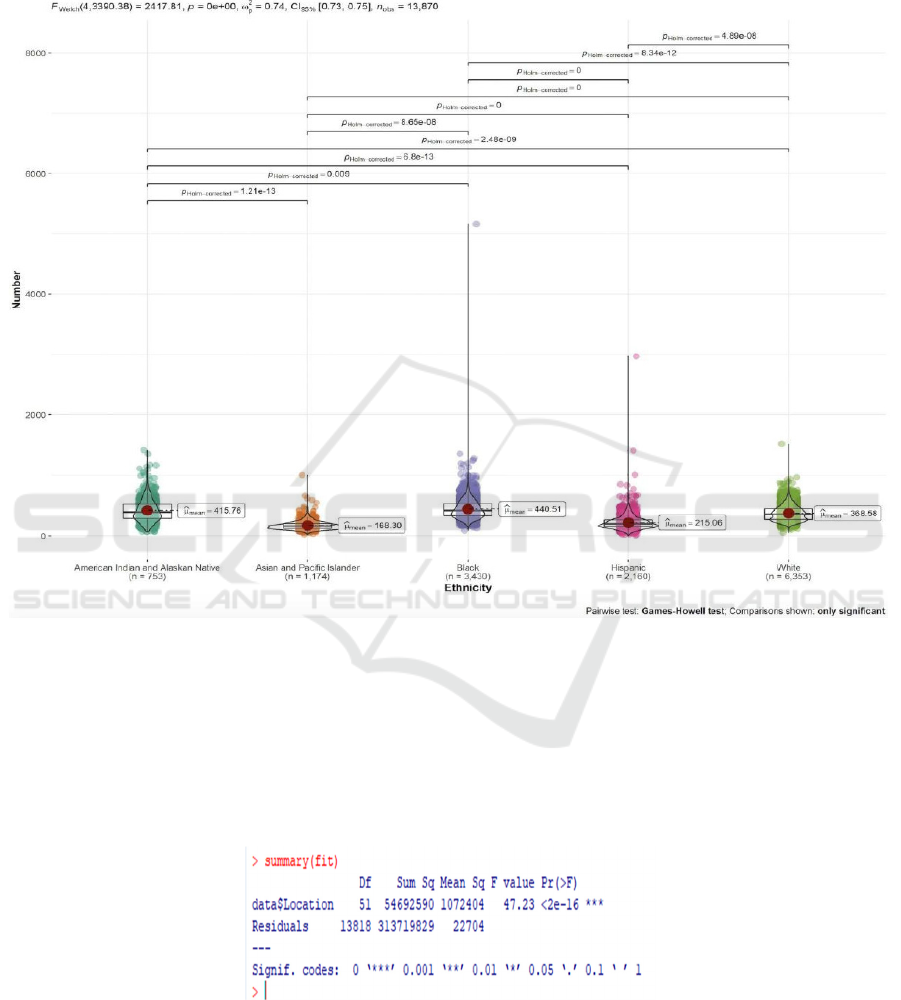
Figure 7: Distribution of heart disease deaths by race.
As can be seen from Figure 7, from the overall
distribution of data, asians have the lowest number of
heart disease deaths, while black people have the
largest number, and the maximum value of black
people is also the largest, reaching more than 5000.
Similarly, we conducted a one-way ANOVA for
regions to verify whether there is a significant
difference in the number of deaths from heart disease
in different regions. The original assumption of
ANOVA was that there was no significant difference
in the number of deaths from heart disease in different
regions. Because of the excessive grouping of
regions, we omit the results of mean and standard
deviation for regions.
Figure 8: Analysis of variance in different regions.
FIG. 8 shows that the one-way ANOVA shows
that the F statistic is 47.23 and the P value is <0.05,
indicating that the null hypothesis is rejected. The
number of deaths from heart disease varies
significantly by region. The data distribution in
different areas is shown in the figure below.
The Relationship between Regional, Race, Gender and the Number of Deaths from Heart Disease
461
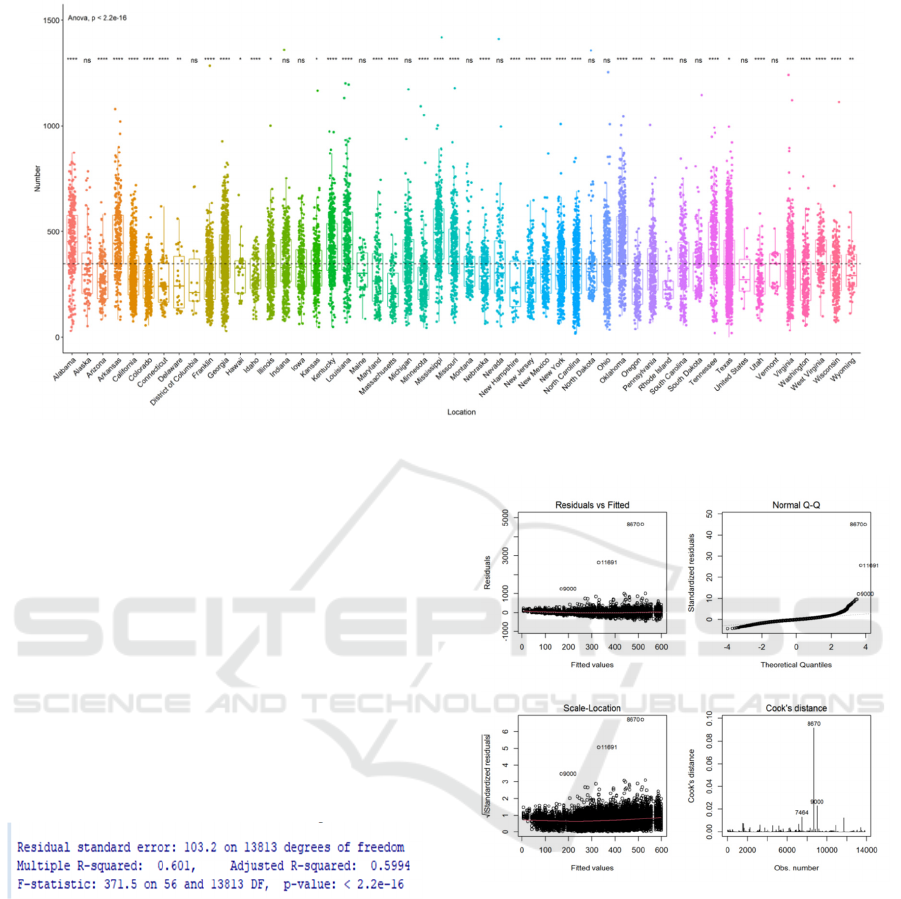
Figure 9: Distribution of different regions.
As can be seen from Figure 9, only the District of
Columbia, Massachusetts, Minnesota and Rhode
Island have lower mean lines, indicating that the
average number of deaths from heart disease in these
four states is lower.
3.3 Multiple Linear Regression
In order to analyze the impact of each variable on the
number of deaths from heart disease, we adopted
multiple linear regression, adding gender, race and
region as independent variables into the model. The
model fitting results are as follows (the regression
coefficients of each variable are not shown one by one
due to the excessive classification of regions).
Figure 10: Results of multiple linear regression.
As shown in Figure 10, the R2 of multiple linear
regression was 0.601, and the adjusted R2 was 0.599,
indicating that gender, race, region and other
variables explained 60% of the changes in the number
of deaths from heart disease, and the overall model
had a good fitting degree. The F statistic is 371.5, and
the corresponding P value <0.05 indicates that the
regression coefficients of the model are not all 0.
Further, we conduct model diagnosis on the
multiple linear regression model, and the diagnosis
results are shown in the figure below.
Figure 11: Multiple linear regression analysis model
diagnosis.
It can be seen from the upper left of Figure 11 that
the relationship between the fitted value and the
residual is a horizontal line, indicating that there is no
systematic correlation between the residual and the
fitted value, and there is no problem with the linear
hypothesis of the model.
It can be seen from the above figure on the right
that some of the QQ charts of residuals deviate from
the dotted line, indicating that residuals violate the
normality hypothesis.
As you can see from the lower left figure, the
points around the horizontal line are randomly
ICHIH 2022 - International Conference on Health Big Data and Intelligent Healthcare
462

distributed, indicating that the homovariance
hypothesis is satisfied.
As can be seen from the figure below, there are
three outliers in the value of Cook’s D, which may
have a little influence on the fitting effect of the
model due to the extreme data. However, the data
sample size in this paper is large, so the influence can
be ignored theoretically.
On the whole, from the model diagnosis of
multiple linear regression analysis, there is no
problem in model setting and no missetting model.
Finally, ANOVA was used to verify whether each
variable of the above multiple linear regression model
could not be deleted. The results of the analysis of
variance are as follows.
Figure 12: ANOVA results of multiple linear regression.
It can be seen from the figure above that the P-
values of the F-test of different variables removed are
all less than 0.05, which indicates that these variables
have a significant impact on the model and there are
significant differences between the removed model
and the original model.
4 DISCUSSION
From the above analysis, there was a significant effect
on the number of heart disease deaths (per 100,000)
by sex, race and region. The average death toll for
men was nearly 1.55 times higher than for women,
probably because women were better at taking care of
themselves.
In terms of race, the number of heart disease
deaths of American Indians and blacks was higher
than that of white Americans, with blacks having the
highest number. Asians and Hispanics are below the
average for white Americans. This may be related to
the high cost of medical treatment in the United
States, which is unaffordable for ordinary people
without medical insurance. The income of American
Indians and blacks is generally lower than that of
white Americans, resulting in fewer people buying
health insurance and thus more deaths. Asians and
Hispanics who move to America tend to be wealthy
locals, have better health insurance, and die less. It
could also have something to do with the smaller
sample sizes of Asians and Hispanics.
In terms of regions, the distribution of most
regions is similar, and only the District of Columbia,
Massachusetts, Minnesota and Rhode Island have
lower mean values, which should be related to the
environment and income and expenditure of each
region.
In the multiple linear regression, we found that
gender, race and region were all independent
variables that could not be ignored. In ANOVA, no
matter which variable was deleted, it would have a
significant impact on the multiple linear regression
model.
Compared with the previous analysis, the
previous data were mainly used for trend analysis to
study the changing trend of the number of deaths from
heart disease. Or to study the related causes of death
from heart disease, to see which causes have a higher
number of deaths. This paper does not stop at the
description and summary of data. Further analysis of
variance, multiple linear regression and other
methods are used to reveal the relationship between
data from the perspective of statistics.
5 CONCLUSIONS
This study found that the number of heart disease
deaths (per 100,000 people) was significantly
different by gender, race and region. Men were more
likely to die from heart disease than women, and
women were better able to take care of themselves.
Indians and blacks have higher rates of death from
heart disease than other races, which is probably
related to the lower income of Indians and blacks.
Regionally, people in the District of Columbia,
Massachusetts, Minnesota and Rhode Island died less
frequently from heart disease than people in other
regions.
Due to the data, there are still many conjectures
that cannot be verified. For example, the reason for
the higher death rate of heart disease among Indians
and blacks, and the reason for the higher death rate of
men than women remains to be revealed.
REFERENCES
Benjamin EJ, Muntner P, Alonso A, Bittencourt MS,
Callaway CW, Carson AP, et al. Heart disease and
stroke statistics—2019 update: a report from the
The Relationship between Regional, Race, Gender and the Number of Deaths from Heart Disease
463

American Heart Associationexternal icon. Circulation.
2019;139(10):e56–528.
Centers for Disease Control and Prevention. Underlying
Cause of Death, 1999–2018. CDC WONDER Online
Database. Atlanta, GA: Centers for Disease Control and
Prevention; 2018. Accessed March 12, 2020.
Fryar CD, Chen T-C, Li X. Prevalence of uncontrolled risk
factors for cardiovascular disease: United States, 1999–
2010. NCHS data brief, no. 103. Hyattsville, MD:
National Center for Health Statistics; 2012. Accessed
May 9, 2019.
Heron, M. Deaths: Leading causes for 2017. National Vital
Statistics Reports;68(6). Accessed November 19, 2019.
Sally C. Curtin, M.A.Trends in Cancer and Heart Disease
Death Rates Among Adults Aged 45–64: United States,
1999–2017.National Vital Statistics Reports,2019.
Virani SS, Alonso A, Benjamin EJ, Bittencourt MS,
Callaway CW, Carson AP, et al. Heart disease and
stroke statistics—2020 update: a report from the
American Heart Associationexternal icon. Circulation.
2020;141(9):e139–e596.
Wilkinson, G. N. and Rogers, C. E. Symbolic descriptions
of factorial models for analysis of variance. Applied
Statistics,1973; 22, 392–399. doi: 10.2307/2346786.
ICHIH 2022 - International Conference on Health Big Data and Intelligent Healthcare
464
