
Research on the Classification of Risk of Coronary Heart Disease
Fanchao Kong and Yi Lin
Tezerakt, 3714 Pyramid Way, Mountain View, CA 94043, U.S.A.
Keywords: Cardiovascular Disease, Machine Learning, Data Exploration, Neural Network.
Abstract: The majority issue of current death is heart disease. Due to the growing information technology, data is
generated and has to be collected in daily life. The data could be converted as knowledge and wisdom by
applying different algorithm in data analysis. Some of medical professionals in the area of heart disease are
not able to predict the probability of getting heart disease with high accuracy due to their own limitations. The
paper seeks to enhance the predictive accuracy of cardiovascular disease by using linear, logistic and neural
network models to classifies the people whether they have cardiovascular disease or not based on recorded
information.
1 INTRODUCTION
The load of cardiovascular diseases is quickly
growing all over the world from the past decade.
Approximately one person dies per minute due to
cardiovascular disease. As time goes by, data is
created and has to be collected daily due to the rapidly
increasing information technology. According to the
World Health Organization (WHO), it has roughly
computed 12 millions deaths due to cardiovascular
disease for every single year crossing the world
(Cardiovascular diseases 2020). In the most
developed countries, half of deaths are due to
cardiovascular disease. In the field of heart disease,
many medical professionals and exports have their
own limitations, and they are not able to predict the
possibility of getting cardiovascular disease up to
high accuracy.
The motivation for this topic exploration is driven
by the desire to improve the coronary heart disease
predict accuracy and to enhance awareness and
knowledge on our health. By using data analysis, the
collected data is converted into knowledge by using
different algorithms. Although these diseases have
been found as the primary source of death, coronary
heart disease has been demonstrated as the
manageable and avoidable disease. The early
prognosis of coronary heart disease enables relief and
aid in making decisions on lifestyle changes in high
risk patients and in lessening the complications. This
presents an opportunity to further conversation of
cardiovascular disease prediction by using logistic
regression, Fisher’s Linear Discriminant, and Neural
Networks. To determine the most relevant/risk factors
of coronary heart disease, and to identify if the
subjects have 10-year risk of future coronary heart
diseases or not are necessary to explore the
relationship between human lifestyles/behavior and
their impacts on potential coronary heart disease.
2 DATA SOURCE AND
ACQUISITION
The dataset as an open source on the Kaggle website
is published in .csv format which comes from a
continuous cardiovascular study on residents of the
town of Framingham and Massachusetts in the United
States (Linear discriminant analysis 2020). To predict
whether the subjects have a 10-year chance of
coronary heart disease (CHD) is the classification
goal/desired target.
Quantity: In this dataset, it offers the information
of patients, including 15 attributes (risk factors) along
with 4240 records in the .csv file. Each attribute is a
possible risk factor for coronary heart disease.
There are four majority risk factors in this dataset:
Demographic: Sex, Age, Education
Behavioral: Current Smoker, Cigarettes Per Day
Information on medical History: BP Meds (Blood
pressure medication), Prevalent Stroke, Prevalent
hypertensive, Diabetes
424
Kong, F. and Lin, Y.
Research on the Classification of Risk of Coronary Heart Disease.
DOI: 10.5220/0011371600003438
In Proceedings of the 1st International Conference on Health Big Data and Intelligent Healthcare (ICHIH 2022), pages 424-428
ISBN: 978-989-758-596-8
Copyright
c
2022 by SCITEPRESS – Science and Technology Publications, Lda. All rights reserved
Information on present medical condition: Total
cholesterol level, systolic blood pressure, diastolic
blood pressure, Body Mass Index, Heart Rate,
Glucose level.
All the attributes will be classified as either
nominal or continuous.
Quality: From the beginning glance, the
“Education” was one irrelevant attribute in our
dataset which could affect the quality of the results.
There is no significant difference between
“Education” and the CHD risk when applying the
histogram of the dataset.
There are several missing values in different
attributes. To impute those missing values, the dataset
was computed by mean for categorical variables and
numerical variables. The dataset was cleaned to
improve its quality before performing the
classification analysis. The dataset was randomly
splitted with 20% of testing data and 80% of training
data. Since there is no noisy data, data quality could
go through this step.
3 THREE MACHINE LEARNING
MODELS
3.1 Logistic Regression Description
Logistic regression is the statistical method to predict
and calculate the probability of the outcome. When
the data collection was finished, the dataset was
imported from a CSV file into a pandas dataframe to
build a regression model. Python processes data
cleaning and analysis. Python packages pandas,
NumPy, matplotlib, statsmodels.api, scipy.stats,
seaborn, and sklearn were applied for the regression
model and visualization. To simplify the data cleaning
process, it can be seen that drop the attribute
“Education.” To impute missing values, the dataset
was replaced with “N/A” to the mean values. For
instance, if there is a missing numerical value in BMI,
then the dataset was replaced with “N/A” to mean
values.
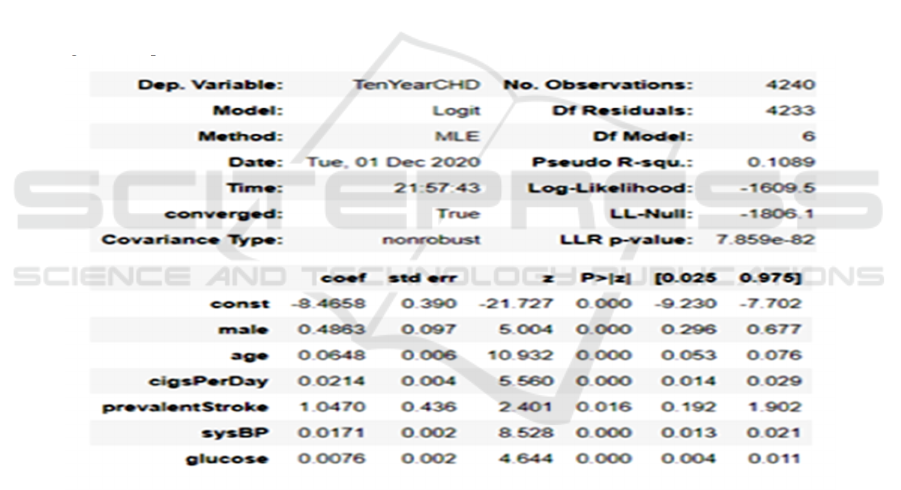
Figure 1: Chi Square Test
When exploratory analysis, there are 3596
patients without cardiovascular disease (CHD = 0)
and 644 patients with risk of cardiovascular disease
(CHD = 1). Initially, the plan was to use the chi-
square test to calculate each attribute's P-value,
showing the relationship with the probability of
coronary heart disease. However, some of the P-value
attributes greater than the preferred alpha, which is
5%. And therefore, it shows a statistically
insignificant connection between attribute and
coronary heart disease. To avoid finding little impact
attributes on the model and select only those crucial
features, backward elimination as a good approach is
applied to eliminate those attributes with the highest
P-value. It is then followed by running the regression
again and again until P-values of all attributes are
fewer than 5% (Figure 1).
Here, notice that such attributes have a
statistically significant relationship with the chance of
cardiovascular disease, including Sex_male, age,
cigsPerDay, prevalentStroke, sysBP, glucose. Those
featured attributes can generate as a logistic
regression equation:
Research on the Classification of Risk of Coronary Heart Disease
425
logitp logp/1 p
β
Sex
male ∗ β
age
∗β
cigsPerDay ∗ β
prevalentStroke ∗ β
sysBP ∗ β
glucose ∗ β
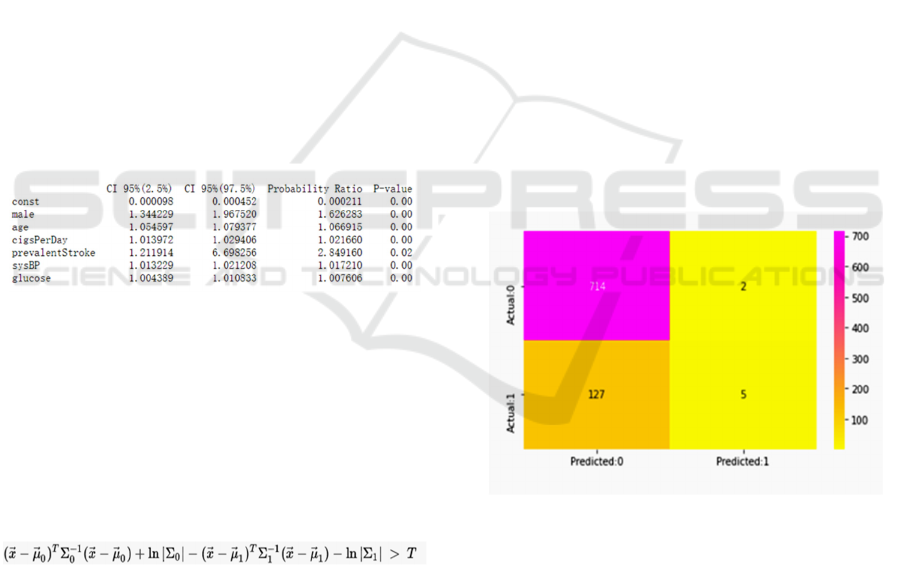
To take forward into the results, we interpret the
outcomes from Figure 1 with the probability ratio,
confidence intervals, and P-values. While keeping
other attributes consistent, this fitted model (Figure 2)
indicates that the probability of receiving a diagnosis
with the cardiovascular disease of males (male = 1) is
higher than that of females (male = 0), which is
exp(0.4863) = 1.626283. Regarding the percentage,
the fitted model demonstrates that males' probability
is 62.63% higher than that of females. Similar to age,
the coefficient of age shows that the chance of
receiving a diagnosis with cardiovascular disease has
grown 6.69% within one year, which is exp(0.0648)
= 1.066915. Also, people smoke with one additional
cigarette, and there is further 2.17% growth in the
probability of having cardiovascular disease. Notice
that there are no apparent changes in both systolic
blood pressure (sysBP) and glucose level. However,
there is a significant growth in prevalentStroke,
which is exp(1.0470) = 2.849160. The chance of
cardiovascular disease is 184.92% growth.
Figure 2: CI, Probability Ratio, P-Value
To train the data and gather the model's accuracy,
the dataset was randomly split with 20% of testing
data and 80% of training data. And we get that the
accuracy of the model is 85.14%.
3.2 Fisher’s Linear Discriminant
Description
Fisher’s Linear Discriminant is a statistical
method used to find the regression matrix w such that
this corresponding projection of the input vector. This
resulting combination can be used as a classifier for
classification problems.
When the classifier is used for binary
classification, the classification would be based on
whether the log-likelihood is more significant than a
threshold T. Matlab package fisheries was applied for
the regression model and visualization.
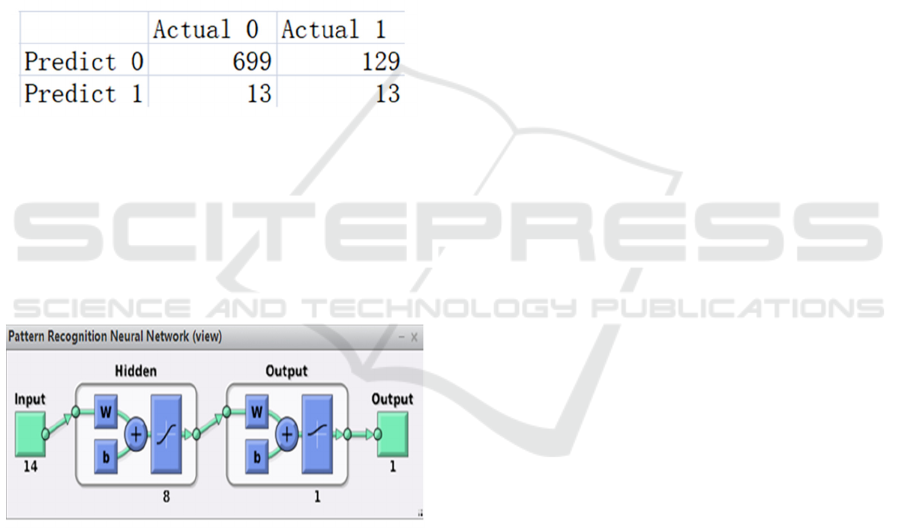
3.3 Neural Network Description
Neural Network is a machine learning method that is
based on a series of connected neurons. By training
the Neural Networks Classification with processing
examples, each instance of the subject contains an
input and an output (a labeled instance). And then, we
stored the probability-weighted results on the net as
we trained the network.
The Neural Network contains three layers: an
input layer, an output layer, and a hidden layer. The
numbers of the input layer and the output layer are 14
and 1, respectively. The hidden layer number of 8,
which is ⅔ of the input layer + the number of output
layers = 8.
As for the program's implementation, we initially
set up the number of hidden layers and specify the
percentages of training and testing. And then start to
train and test the Neural Network. Matlab applies the
Deep Learning Toolbox to the neural network and
visualization (
M. Saw, T, 2020
).
4 RESULTS AND ANALYSIS
4.1 Logistic Regression Analysis
Figure 3: Confusion Matrix
After the data cleaning, attributes with P-values of
fewer than 5% illustrate the significant and important
roles in the cardiovascular disease prediction,
including male, age, cigsPerDay, prevalentStroke,
sysBP, and glucose level. Based on the model, males
have more easily to get cardiovascular disease than
females. When the subjects’ age gets older, subjects
who have previously had a stroke and smoked the
number of cigarettes on average in one day have a
larger chance of getting cardiovascular disease.
Notice that there is a significant increase in the
subject who have previously had a stroke. But there
ICHIH 2022 - International Conference on Health Big Data and Intelligent Healthcare
426
are no obvious changes in both systolic blood
pressure (sysBP) and glucose level. By using 20% of
testing data, the model accuracy is 84.79%. To
compute the model, the confusion matrix was applied
to the dataset (Figure 3). The confusion matrix
demonstrates that the model with 5 (TP) + 714 (TN)
=719 is correct, and 2 (FP) + 127(FN) = 129 is not
correct. The negative predictive value is also less
correct than the positive predictive value, which is
85% < 71%. The sensitivity is 3.79%, and specificity
is 99.72% indicating that the model has lower
sensitivity than specificity. With the accuracy of the
model, the model could get better with more data.
4.2 Fisher’s Linear Discriminant
Analysis
Figure 4: Fisher’s Linear Discriminant Confusion Matrix
For this model, the general accuracy rate is 83.37%.
The sensitivity is 9.15%, and the specificity is
98.17%. Overall, this algorithm yields higher
accuracy and specificity, but lower sensitivity. The
positive predictive value is 84.42%, greater than the
negative predictive value of 50%.
Figure 5: Neural Network Diagram.
4.3 Neural Network Analysis
For the Neural Network algorithm, the general
accuracy is 85.7%. The sensitivity is 14.5%, and the
specificity is 97.1%. Overall, the neural network
algorithm shows that it has higher accuracy and
specificity, but lower sensitivity. The positive
predictive value is 87.7%, which is far greater than
the negative predictive value of 44.7%.
5 CONCLUSIONS
Based on the results, all algorithms behave better on
the specificity than the sensitivity. With the accuracy
of the model, three algorithms could get better with
more data. In addition, both logistic regression and
neural networks' accuracy are slightly higher than
those of the fisher's linear discriminant. Therefore,
those two algorithms can determine the risky factors
of cardiovascular disease.
The neural network puts its testing process in a
black box, so further investigation of attribution is
needed (Larry Hardesty 2020). As the algorithm runs
one more time, one distinct attribute would be
manually dropped, and the accuracy of the test set
would be recorded. The neural network shows that the
most significant tier of attributes includes: male, age,
diabetes, sysBP, and BMI. The second most
significant tier of attributes includes: cigsPerDay,
BPMeds, prevalentStroke, prevalentHyp, and
totChol.
Logistic regression can evaluate the significance
of the attributes in the CHD based on the P-value.
After the data cleaning, attributes with P-value less
than 5% illustrate the significant and vital roles in the
cardiovascular disease prediction, including male,
age, cigsPerDay, prevalentStroke, sysBP, and glucose
level.
The most relevant and risk factors of coronary
heart disease should be male, age and sysBP since
these attributes were demonstrated as the most
significant factors in both logistic regression and
neural network algorithms. Besides, since their P-
values are less than 5% in the logistic regression and
their accuracy in the neural network, both
“cigsPerDay” and “prevalentStroke” are relatively
risky factors for coronary heart disease.
All three of the methods have their advantages.
Although the accuracies of Logistic Regression and
Neural Network are slightly higher than the accuracy
of Fisher’s Linear Discriminant, Fisher’s Linear
Discriminant still provided a decent accuracy.
Individually, Logistic Regression provided a chance
to evaluate the significance of the attributes directly
through the p-values. Fisher’s Linear Discriminant is
easy to understand and implement for the beginner to
start with a vast machine learning project since it can
quickly provide a working model. Neural Network
generally has high accuracy and robustness, which
can functionally operate with high volume and data
dimensions. The layer sizes are flexible. And
therefore, under the right scenarios, each one of the
algorithms can be optimal.
Research on the Classification of Risk of Coronary Heart Disease
427

ACKNOWLEDGEMENTS
I would like to express my sincere gratitude to
Professor Vipul Goyal for providing his valuable
guidance, comments, and suggestions throughout the
course of the project.
Special thanks are due to my friend Shicuo Xie for
his help during the preparation of the sample,
providing me an overview of Neural Network, and
reviewing this paper.
REFERENCES
Cardiovascular diseases (CVDs). (n.d.). Retrieved
November 30, 2020, from
https://www.who.int/en/news-room/fact-
sheets/detail/cardiovascular-diseases-(cvds)
Larry Hardesty, “Explained: Neural Network”, MIT News
Office. Retrieved December 02, 2020, from
https://news.mit.edu/2017/explained-neural-networks-
deep-learning-0414
Linear discriminant analysis. (2020, November 29).
Retrieved December 02, 2020, from
https://en.wikipedia.org/wiki/Linear_discriminant_ana
lysis
M. Saw, T. Saxena, S. Kaithwas, R. Yadav and N. Lal,
"Estimation of Prediction for Getting Heart Disease
Using Logistic Regression Model of Machine
Learning," 2020 International Conference on Computer
Communication and Informatics (ICCCI), Coimbatore,
India, 2020, pp. 1-6, doi:
10.1109/ICCCI48352.2020.9104210.
MathWorks. Retrieved December 02, 2020, from
https://www.mathworks.com/help/deeplearning/gs/clas
sify-patterns-with-a-neural-network.html
Neural network. (2020, November 30). Retrieved
December 02, 2020, from
https://en.wikipedia.org/wiki/Neural_network
ICHIH 2022 - International Conference on Health Big Data and Intelligent Healthcare
428
