
10-Year Breast Cancer Survival Prediction Research based on
Missing Value Imputation
Yufang Deng
School of Computer, Electronics and Information, Guangxi University, China
Keywords: Breast Cancer, Missing Values, Machine Learning, 10-Year Survival Model.
Abstract: The use of machine learning for medical data mining is one of most preferable research field in the
healthcare field. In the medical health field, there is a large amount of data containing information, and these
data will be continuously stored in the database. Using machine learning to mine valuable information from
medical data can provide a certain scientific reference for decision-making about patient health. This paper
used breast cancer data from SEER (Surveillance of Epidemiology and End Result) which is contributed by
National Cancer Institute. The database is a large-scale and open database. The proposed research work first
analyzes the breast cancer data set, and then applies data mining methods to evaluate the results. Data
mining is used to obtain disease patterns that doctors can effectively use. In order to predict the survival
ability of breast cancer patients, this paper proposes an hybrid missing values imputation method that is
KNNI + kmeans-GMM to deal with missing values, and four classifiers ( XGBoost, Random Forest,
Decision tree, K-nearest neighbor ) are used to established 10-year survival models. The experimental
results show that the accuracy of breast cancer survival model can be improved through missing value
imputation. KNNI + kmeans-GMM is an effective missing value imputation method, which combines the
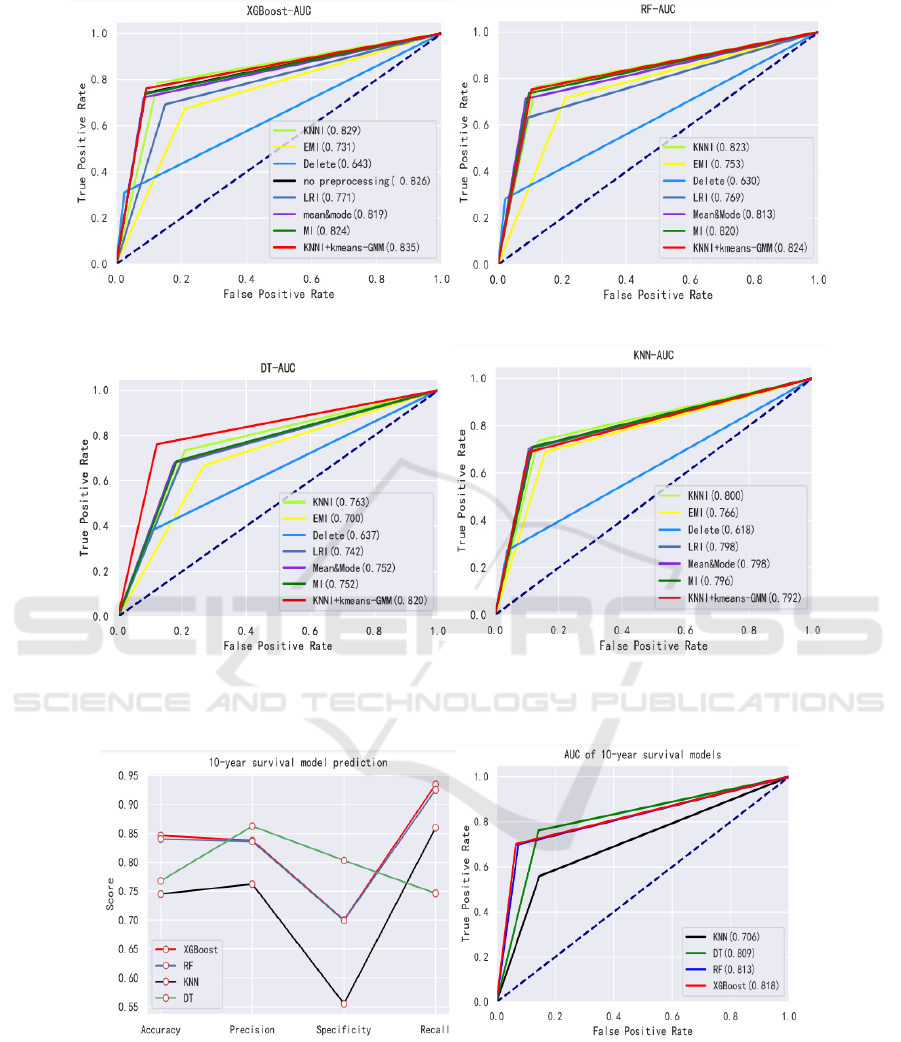
survival model established by the XGBoost classifier with the best accuracy(0.854) and AUC(0.835).
Besides, the accuracy and AUC of the 10-year breast cancer survival model established based on this data
and the XGBoost algorithm are 0.847 and 0.818, respectively.
1
INTRODUCTION
According to the World Health Organization
(WHO), breast cancer is the most common cancer
among women worldwide in 2020, it is estimated
that about 30% of the newly added female patients
are diagnosed as breast cancer patients, which not
only seriously threatens the health of women but
also affects countries at all levels of modernization.
Thankfully, the mortality rate of breast cancer has
been declining since about 1990, one of the main
reasons for this is the continuous improvement of
treatment. In recent years, machine learning
algorithms to construct cancer survival data-driven
model can help predict prognosis and management
of cancer, to make informed decisions provide a
reference for physicians to potential necessity to
adjuvant therapy. Therefore, over the years, there
have been many studies trying to use data mining or
machine learning techniques to predict patient
survival rates. The literature shows that it has made
a certain contribution to the treatment of breast
cancer patients by predicting the survival rate.
Survival model prediction is based on scientific
data analysis of big data, and most of the medical
data has missing values, that is, the effective
information of the data is uncertain, which makes
the data difficult to use. Besides, the data basis of
machine learning algorithms is complete and
categorizable. Therefore, how to deal with the data
to obtain valid information to improve the accuracy
of survival models become one of the new
challenges.
In order to deal with the problem of missing data
more effectively, it is necessary to understand the
mechanism and form of missing data. Variables
(attributes) in the data set that do not contain missing
values are called complete variables, and variables in
the data set that contain missing values are called
incomplete variables, Little and Rubin define the
following three different data missing mechanisms.
(1) Missing completely at random (MCAR), the
missing data is completely random, does not depend
on any incomplete or complete variables, and does
332
Deng, Y.
10-Year Breast Cancer Survival Prediction Research based on Missing Value Imputation.
DOI: 10.5220/0011369000003438
In Proceedings of the 1st International Conference on Health Big Data and Intelligent Healthcare (ICHIH 2022), pages 332-342
ISBN: 978-989-758-596-8
Copyright
c
2022 by SCITEPRESS – Science and Technology Publications, Lda. All rights reserved

not affect the unbiasedness of the sample,
for example patients’ race. (2) Missing at random
(MAR), missing data is not completely random, that
is, missing data of this type depends on other
complete variables, eg. the extension of tumor is
related to tumor size. (3) Not missing at random
(NMAR), missing values depend on both the
complete variable and the incomplete variable itself,
such as tumor size depend on whether the patient’s
tumor is benign or malignant. Missing value
processing is one of important parts of data
preprocessing.
The purpose of this study is to establish a better
breast cancer survival model from the data level.
There are many strategies available for handling
missing data. Delen et al. used a complete analysis
method to impute SEER breast cancer data, and
three machine learning algorithms (neural network,
decision tree (DT), and logistic regression (LR))
were used to build survival models. Rathore et al.
replaced missing value with mean value in their
SEER breast cancer data preprocessing, and
ensemble approach was used to classify. Lotfnezhad
Afshar used the multiple imputation method for
missing value based on SEER breast cancer data.
Pedro J.et al. compared three missing value
imputation methods, mode imputation, expectation
maximization imputation (EMI), K-nearest neighbor
imputation (KNNI) methods and combined four
classification algorithms of K-nearest neighbor
(KNN), decision tree (DT), logistic regression (LR),
and support vector machine (SVM) to establish
breast cancer survival model, respectively, the result
showed that the combination of KNNI and KNN
classifier was the best. Missing values are dealt
differently in different studies. Although the most
commonly reported dealing with missing value
approaches in breast cancer survival are simple
statistical analysis methods, it is worth noting that
missing value processing is an area that is getting
more and more attention, several techniques, derived
from machine learning and improved methods, have
been developed and applied for breast cancer
datasets. Migdady used enhanced fuzzy kmeans
clustering methods to impute missing values, the
experiments showed a clear improvement in the
imputation accuracy. Zhang. et al. predicted missing
values in medical data via XGBoost regression, and
the result showed that their model exhibits an
imputation improvement by over 20% on average.
Marco proposed EM-based finite mixed multivariate
Gaussian (GMM) for missing data, Rahman applied
fuzzy clustering methods and fuzzy expectation
maximization algorithms (FEMI) to identify a group
of similar records and estimate missing values based
on the group of records, the result showed that it
performs significantly better than EMI, GkNN,
FKMI, SVR, and IBLLS.
Each strategy for handling missing data has an
underlying assumption regarding the missing data
mechanism, that is, the missing value processing
method conforms to the missing mechanism of
missing data, if not satisfied, it may lead to
deviations in parameter estimates. For example, the
commonly used complete case analysis assumes that
the missingness in the covariates is not associated
with the outcome. Most single imputation and
multiple imputation approaches assume that the
missingness is related to the observed data but does
not depend on the unobserved value itself.
Therefore, in this research, we propose an improved
missing value imputation method KNN imputation
(KNNI) + kmeans-GMM to fill in missing values
and compared with six commonly use missing value
methods(KNNI, EMI, LRI, mean& mode,
missforest, deleting). Finally, an effective 10-year
breast cancer survival prediction model based on
complete dataset was established.
2
SEER BREAST CANCER
DATASET
Surveillance, Epidemiology, and End Results
(SEER) database is the authoritative cancer
statistical database in US, which collects cancer
diagnosis, treatment and survival data for
approximately 30% of the American population.
Among these data, SEER contains information about
over 1.6 million incidences of BC between the years
1973 and 2015. Due to the database has huge and
comprehensive data, it not only provides a good data
foundation for machine learning, but also supplies
data support for the establishment of breast cancer
survival model. By referring to literatures, in this
experiment, more than 1.3 million cases with 22
features from 1973 to 2015 are used to establish
breast cancer survival model after data type
conversion, features merging and data cleaning. It is
similar to literature, that after simple data
processing, many features in the data still have a lot
of data missing. The data information is shown in
the Figure 1 below.
And not all features of each sample are missing,
but a single or a certain feature in the sample is
missing.
10-Year Breast Cancer Survival Prediction Research based on Missing Value Imputation
333

For the prediction of the overall survival rate of
patients, we use the final state of the patient that is
‘vital status’(‘vst’) as the classification label, when
‘vst’ is ‘alive’, patient is alive, otherwise the patient
is dead. According to the relative survival
framework, for different survival prediction (for
example, 10 years), patient survival information is
used to define classification categories. Patients who
survive beyond the prognosis period are marked as
positive, while patients who die before reaching this
stage are considered as negative. Therefore, when
predicting the 10-year survival probability of breast
cancer patients, the label of ‘survival
month’&(‘SM’) is more than 10 years that the
patient is survival, otherwise, non-survival. As a
result, the problem of predicting breast cancer
survival can be correctly defined as a binary
classification problem, and the prediction model of
machine learning can be used.
3
METHODS
In this section, common missing data imputation
methods applied in our breast cancer dataset and the
machine learning methods used to predict survival
models will be described. We first introduce the
commonly used missing value imputation methods,
which are mean imputation, K-Nearest neighbors
imputation(KNNI), MissForest imputation(MI),
Linear regres- sion imputation(LRI), Expectation
maximization imputation(EMI) and the hybrid
imputation KNNI + kmeans-GMM. Then, the four
classification algorithms XGBoost
classifier(XGBoost), Random Forest classifier(RF),
K Nearest Neighbor classifier (KNN) and Decision
Tree classifier (DT) are introduced.
3.1 Mean or Mode Imputation
The mean imputation method is to fill in the
missing value with the corresponding attribute mean
of the existing data, but it should be noted that the
data variable needs to obey or approximately obey
the near-state distribution, otherwise the mode or
median under the attribute is used to fill in the
missing value. In other words, it is to first determine
the data type of the missing value, and then adopt
different filling methods according to the data type,
fill the average value of other objects under the
same attribute to the numerical missing value; or
use the principle of majority to take the same
attribute down The value with the most number of
values is filled with non-numeric missing values.
Mean filling method is currently the most used in
filling methods.
3.2 K-Nearest Neighbors Imputation
(KNNI)
KNNI is a classical method for missing value
imputation. KNN commonly uses Euclidean
distance as the sample similarity measurement
distance. Given two n-dimensional vectors {x
1
, x
2
,
..., x
n
}, {y
1
, y
2
, ..., y
n
}, then Euclidean distance
Dist=
∑(
𝑥
−𝑦
)
. Through distance
measurement, k neighboring samples of the missing
data sample can be found, and then the approximate
value of the missing sample can be determined. For
example, Given data X =
[[3, np.nan, 5], [1, 0, 0], [3, 3, 3]], d
12
=
(
3−1
)
+
(
5−0
)
>d
13
=
(
3−3
)
+
(
5−3
)
then the first sample
is closer to the third sample so the
approximate value of the null value is
3.
3.3 MissForest Imputation (MI)
MissForest is a highly flexible model that uses the
random forest method to predict missing values, it
can impute multivariate data consisting of
continuous variables and categorical variables with
missing values, and it outperforms KNNI, MICE and
mean on multiple biological and medical data sets.
3.4 Linear Regression Imputation
(LRI)
LRI is basically to establish a regression equation
through a complete data set, and then use the
predicted value of the regression equation to fill in
the missing data. Assuming Y is the missing
variable, existing complete features X
i
(i = 1, 2, ...m)
having a linear regression relationship with Y , the
regression equation is established as follows: 𝑌
=
𝛼
+ 𝛼
𝑋
, α
0
is intercept, α
i
represents the
relationship between variable X
i
and dependent
variable Y .
ICHIH 2022 - International Conference on Health Big Data and Intelligent Healthcare
334

Table 1: Experimental data used to evaluate missing value imputation methods and establish survival prediction models.
N
ame Type SEER field Description Missing rate
80%train 20%test
nodesexamined Continuous Regional nodes examined (1988+) Total number of regional
lymph nodes detected
14.1% 14.1%
nodespositive Continuous Regional nodes positive (1988+) Total number of regional 34.5% 34.5%
lymph nodes metastasized
tumorsize Continuous CS tumor size (2004+) Information on tumor size 22.8% 22.9%
extension Continuous CS extension (2004+) Information on extension of 13.9% 14.0%
the tumor
lymphnodes Continuous CS lymph nodes (2004+) Information on involvement 13% 13%
of lymph nodes
mets Continuous CS mets at dx (2004+) Information of tumor on 47.8% 47%
metastasis
grade Discrete Category based tumor stage Category based on the ap- 23.3% 23.4%
pearance of tumor, tumor
stage
reasonsurgery Discrete Reason no cancerdirected surgery Reasons for not performing 0.8% 0.8%
surgery at the primary site
ER Discrete ER Status Recode Breast Cancer (1990+) Estrogen receptor 15.2% 15.3%
PR Discrete PR Status Recode Breast Cancer (1990+) Progesterone receptor 16.6% 16.6%
race Discrete Race recode (W, B, AI, API) Race information 0.6% 0.5%
surgery Discrete Surgery Surgical site information 0.5% 0.5%
BCstage Discrete Breast Adjusted AJCC 6th Stage (1988+) Breast tumor information 0.5% 0.5%
maritalstatus Discrete Marital status at diagnosis Patient’s marital status 16.9% 16.9%
historicstage Discrete SEER historic stage A Extent of tumor spread 4.3% 4.3%
based on histological type
behavior Discrete Behavior code ICD-O-3 Tumor classification( ma- 0 0
lignant or benign)
laterality Discrete Laterality One side of the matched or- 0 0
gan
histology Discrete Histology ICD-O-3 Tumor histological type 0 0
primsrysite Discrete The origin of the primary tumor The origin of the primary 0 0
tumor
Year Discrete Year of diagnosis Year when the tumor was 0 0
first diagnosed
raceethnicity Discrete Race/ethnicity Patient’s nationality 0 0
age Continuous Age at diagnosis Age of the patient at diag- 0 0
nosis
SM Continuous survival month Survival time after diagno- 0.4% 0.5%
sis (months)
vst Discrete vital status record Survival status of patients 0 0
on follow-up deadline
10-Year Breast Cancer Survival Prediction Research based on Missing Value Imputation
335

3.5 Expectation Maximization
Imputation (EMI)
The Expectation Maximization (EM) algorithm is an
iterative method to find maximum likelihood or
maximum a posteriori (MAP) estimates of
parameters in statistical models, where the model
depends on unobserved latent variables. The EM
iteration alternates between performing an
expectation (E) step, which creates a function for the
expectation of the log-likelihood evaluated using the
current estimate for the parameters, and a
maximization (M) step, which computes parameters
maximizing the expected log-likelihood found on
the E step. These parameter estimates are then used
to determine the distribution of the latent variables
in the next E step, and missing values are imputed.
3.6 Hybrid Method of KNNI and
Kmeans-Gaussian Mixture Model
(GMM) Imputation
(KNNI + kmeans-GMM)
In order to improve the accuracy of breast cancer
survival model form the data level, Hybrid missing
value imputation method of combining KNNI and
kmeans-Gaussian Mixture Model(GMM) is used. In
our experiment, KNNI is used for discrete feature
missing value. For missing values of continuous
features, kmeans-GMM is used to impute.
Considering large data scale and long running
time, kmeans is firstly used to cluster data. k of
kmeans is determined by the minimum error square
sum(SSE). Given a data matrix X = {x
1
, x
2
, ...x
n
},
formulated of SSE as
𝑆𝑆𝐸= 𝑥
−µ
∈
,
j=1,2,…n.(1)
。where C
i
is the ith cluster, µ
i
is the
centroid of C
i
, and SSE is the clustering error of all
samples, representing the quality of the clustering
effect.
Within each cluster, Gaussian Mixture
Model(GMM) is used to estimate model parameters
for cluster data with missing values. The Maximum
Likelihood Estimation (MLE) of the EM algorithm
is the most commonly used method for parameter
estimation. Each clustering data consists of observed
data Y
obs
and missing data Y
mis
, Y = {Y
obs
, Y
mis
}, it is
generated
by a Gaussian Mixture Model, Y distributed as a
mixture of K Gaussian distributions P (Y |θ) =
𝜋
𝑁
(𝑥
;
𝜃
)
,
where Σ
π
k
= 1, π
k
≥ 0 for k = 1, ..., K, and θ
k
=
(µ
k
,𝛴
). Note that θ denotes the full set of parameters
of the mixture model: θ = (π
1
, ..., π
K
; θ
1
, ..., θ
K
). We
also introduce hidden variables γ
i
= γ
i1
, ..., γ
iK
, where
γ
ik
is 1 if the ith sample belongs to group k, and 0
otherwise.
In each cluster, we first use the mean of observed
data features to fill in the missing values of the
corresponding features. And initialize the parameters
to start iteration. At this time, the likelihood function
of complete data can be written as the following
formula,
P
(
Y,γ
|
θ
)
=
𝛱
𝑘=1
𝑘
𝜋
𝑘
𝑛
𝑘
𝛱
𝑖=1
𝑛
1
√
2𝜋𝜎
𝑘
exp−
𝑦
𝑖
−µ
𝑘
2
2𝜎
2
^(γ
𝑘
)
where, n
k
=
∑
γ
,
∑
𝑛
=n. Then the log-
likelihood function of the complete data is as
follows:
𝑙𝑜𝑔𝑃
(
𝑌,𝛾
|
𝜃
)
=𝑛
𝑙𝑜𝑔𝜋
+𝛾
𝑖𝑘
[log
1
√
2𝜋
−𝑙𝑜𝑔𝜎
𝑘
−
1
2𝜎
𝑘
2
(𝑦
𝑖
−µ
𝑘
)^2]
E-step of EM algorithm: Determine the Q
function.
Qθ,θ
(
)
=𝐸𝑙𝑜𝑔𝑃
(
𝑌,𝛾
|
𝜃
)
𝑌,θ
(
)
={𝐸
𝛾
𝑖𝑘
𝑙𝑜𝑔
𝜋
𝑘
+
𝐸
𝛾
𝑖𝑘
[log (
1
√
2𝜋
) −𝑙𝑜𝑔𝜎
𝑘
−
1
2𝜎
𝑘
2
(𝑦
𝑖
−
µ
𝑘
)^2]}
According to the current model parameters,
calculate the responsiveness of sub-model k to
observation data y
i
,
γ
= E(γ
ik
|y
i
,𝜃
) =
;
;
M-step of EM algorithm: Calculate the model
parameters for the new iteration.
µ
𝑘
′
=
(γ
𝑖𝑘
′
∗𝑦
𝑖
)
𝑛
𝑖=1
γ
𝑖𝑘
′
𝑛
𝑖=1
𝜎
=
γ
𝑖𝑘
′
(𝑦
𝑖
− µ
𝑘
)^2
γ
𝑖𝑘
′
ICHIH 2022 - International Conference on Health Big Data and Intelligent Healthcare
336

π
k
′
=
γ
𝑖𝑘
′
𝑛
𝑖=1
𝑛
,𝑘=1,2,3,…,𝐾
Imputation: Conditional mean imputation is the
most commonly used methods in imputation
methods. Because the distribution of the complete
data and the observation data is known, the missing
data distribution P (y
mis
|y
obs
) under the observation
data can be obtained by Bayes, so that the
conditional expectation can be obtained and the
corresponding missing data can be filled. EMI
believes that the deviation between missing value y
ij
∈ y
mis
and the mean value of the j-th feature is
proportional to the deviation between y
il
∈ y
mis
and
the mean value of the lth feature, so that the missing
value y
mis
can be imputed using formula y
mis
= µ
m
+
(y
a
− µ
a
)B + e, where,
m
is the mean vector of the
features having missing values for a record y
.j
∈
y
mis
,
a
is the mean vector of the features without
missing values for a record y
i
∈ y
mis
, B is a
regression coefficient matrix. e is a residual error.
Here, we believe that in the Gaussian Mixture
distribution, the missing values y
m
∈ y
mis
can be
imputed by the formula:
𝑦
=
π
(µ
+
1𝜎
,
𝜎
,
(𝑦
−µ
))
the k-th model of the t-th iteration, represents the
covariance between the mth attribute and the lth
attribute in the k-th model of the t-th iteration, σ
k
is
the covariance matrix of observed features in the k-
th model, µ
is the mean value of the l-th attribute in
the k-th model.
3.7 Machine Learning Methods
In this section, we briefly introduce several
classification algorithms applied in this research.
3.7.1 XGBoost
XGBoost is a reliable distributed machine learning
system that can be used to expand tree boosting
algorithms. XGBoost optimizes the construction of
fast parallel trees to have good running speed and
satisfactory accuracy. In addition, XGBoost can
process tens of millions of samples on a single node
so that it can handle large scale data, and when the a
eigenvalue of the sample is missing, XGBoost can
treat missing data as a sparse matrix so that it can
effectively perform data modeling and analysis.
3.7.2 Random Forest (RF)
Random forest trains by selecting a data set with the
same size of N that may have repetitions from all
training samples N when training each tree (ie
bootstrap sampling), and at each node, randomly
select a subset of all features, the classifier built to
calculate the best segmentation method. The final
output category of the random forest is determined
by the mode of the category output by each tree. RF
has been widely used in data classification
applications because of its good classification
performance.
3.7.3 K-Nearst Neighbors (KNN)
The main idea of KNN is that if most of the k most
similar samples in the feature space (that is, the
closest neighbors in the feature space) of a sample
belong to a certain category, the sample also belongs
to this category. KNN commonly uses Euclidean
distance as the sample similarity measurement
distance. Through distance measurement, k
neighboring samples of the missing data sample can
be found, and then the approximate value of the
missing sample can be determined.
3.7.4 Decision Tree (DT)
DT is a common type of machine learning method.
The purpose is to produce a decision tree with strong
generalization ability, that is, strong ability to deal
with unseen examples. There are three algorithms
for generating decision trees: ID3, C4.5 and CART.
In this research, we use CART algorithm. The
generation of CART decision tree is a process of
recursively constructing a binary decision tree. The
square error minimization criterion is used for the
regression tree, and the Gini index minimization
criterion is used to performed feature selection in the
classification tree, and the binary tree is finally
generated.
4
PERFORMANCE
EVALUATION
In this section, five common measures that are
accuracy, precision, sensitivity, specificity and AUC
are employed to evaluate the survival prediction
models. The first four measures are given by
follows: accuracy=(tp+tn)/(tp+tn+fp+fn),
precision=tp/(tp+fn), sensitivity=tp/(tp+fp),
specificity=tn/(tn+fp), where tp, tn, fp, fn represent
10-Year Breast Cancer Survival Prediction Research based on Missing Value Imputation
337

true positive, true negatives, false positives and false
negatives, respectively.
Table 2: Confusion matrix.
Prediction class
Actual tp fn
class fp tn
5
EXPERIMENTAL RESULTS
The experimental purpose of this research is to
evaluate the impact of different missing value
imputation methods on the performance of survival
prediction in SEER breast cancer dataset, and we
compare improved hybrid imputation method
KNNI + kmeans-GMMI with six common
existing techniques namely mean& mode, KNNI,
LRI, MI, EMI and deleting. In order to prove the
effectiveness of the data imputation method for data
modeling, we first used the classification algorithm
of the XGBoost framework to establish a breast
cancer survival prediction model for the data without
preprocessing of missing values. Then, the missing
value imputation methods are applied to the data to
make the processed data without missing values,
finally, to design survival prediction models using
the resulting dataset.
Because XGBoost can treat missing values as a
sparse matrix during the model building process, and
it is more efficient when processing large-scale data.
Therefore, in the first experiment, we build an
overall survival model through XGBoost base on
data with missing values, the evaluation result of this
model is similar to the evaluation result of MI as
shown in no preprocessing of Figure 1(a), and its
AUC of this model is 0.826 as is showed in Figure
2(a).
In the second experiment, we used an improved
hybrid imputation method KNNI + kmeans-GMM to
preprocess the missing values and compare it with
other six common imputation methods(deleting,
mean&mode, KNNI, LRI, EMI, MI).
For KNNI + kmeans-GMM, we mainly consider
the difference between discrete value and continuous
imputation, and the long running time caused by the
large scale of experimental data, so we use KNNI to
fill discrete feature missing values, kmeans-GMM to
impute continuous feature missing values. The
resulting complete data set is divided into 80%
training set and 20% test set. The training set is used
to train the best survival prediction model, and the
corresponding test set is used for testing. Four
classification algorithms XGBoost classifier, KNN
classifier, RF classifier, and DT classifier are used
for overall survival prediction modeling. For each
combination of imputation and classifiers, the
corresponding set of model parameters are
determined by the best AUC through small
parameter adjustments. Figure 1 shows the obtained
test results in terms of four measures of survival
prediction: accuracy, precision, sensitivity and
specificity. And Figure 2 shows AUC of each
combination of imputation and classifiers. Next, we
measure the impact of different missing value
imputation techniques on survival prediction
performance through accuracy, precision,
specificity, sensitivity, and AUC five indicators. For
the second experiment, the overall survival model is
to predict the survival of the group as a whole, and
whether a patient can survive for 10 years, a 10-year
survival prediction model needs to be established. In
this experiment, we use the complete data set
imputed by KNNI + kmeans-GMM to predict the
10-year breast cancer survival model. The evaluation
results of the model are shown in the Figure 3(a) and
Figure 3(b).
The five commonly used evaluation indicators of
accuracy, precision, specificity, recall and AUC are
used to measure the impact of different missing
value processing methods on survival prediction
performance. As Figure1 and Figure2, an effective
model can be built through XGBoost with missing
data, and its accuracy, specificity and AUC are
0.849, 0.740, 0.826 respectively. For a given
classifiers, in terms of AUC, the results obtained
using KNNI + kmeans-GMM are statistically
significantly better than using others imputation
methods, except for KNN classifier, where the AUC
values of KNNI + kmeans-GMM is 0.792 which is
lower than KNNI (0.8), MI (0.796), LRI (0.798) and
mean& mode (0.798). In terms of combination
methods, we found that the difference between the
AUC provided by RF classifier and KNN classifier
is not statistically significant. On the contrary, the
difference in DT classifier is the relatively
significant, but the result gives the worst. In
addition, based on specificity results, DT classifier
and KNN classifier tend to favor the majority class
(in the best case, the specificity is less than 0.761).
Although the impact is small, this bad behavior also
occurs in XGBoost classifier and RF classifier. The
most robust and accurate method is the XGBoost
method: For the same missing value imputation
technique, it provides better AUC than the other
three classifiers (using KNNI + kmeans-GMM up to
0.835), and its specificity is 0.761, precision is
ICHIH 2022 - International Conference on Health Big Data and Intelligent Healthcare
338
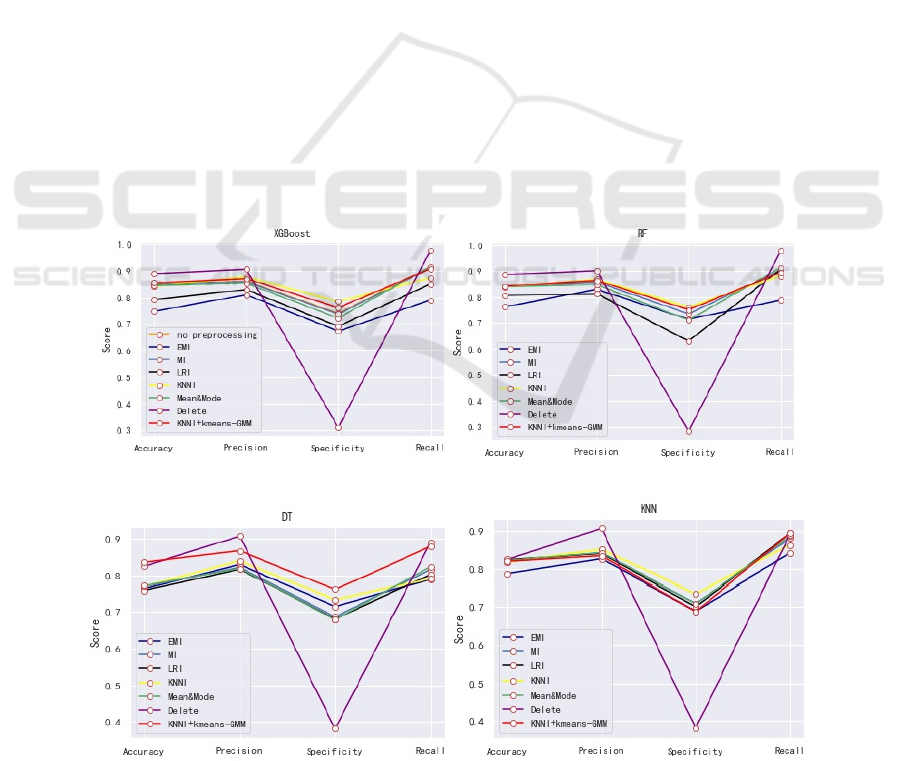
0.870, which can reduce the number of FP, and then
increase the number of TN.
6
DISCUSSIONS AND
CONCLUSIONS
Breast cancer survival prediction models have been
extensively studied and have provided great help in
improving cancer treatment. These models are built
using historical patient information stored in clinical
data sets, and they can be used to predict breast
cancer outcomes in new patient data. However, it
should be noted that most of the historical
information is incomplete or there are missing
values, such as the breast cancer data set in the
SEER database. Therefore, in order to carry out such
research, some pre-processing measures need to be
taken. Different from previous studies, we propose a
hybrid imputation method to impute missing breast
cancer data. Considering the messiness of data types,
we use KNNI to perform numerical imputation on
discrete data, and use an improved GMM algorithm
to interpolate continuous missing data. Since using
different imputation methods for the same
incomplete data set may produce different
imputation results, the better the quality of the
imputation of the training data set, the higher the
classification accuracy. Therefore, a better
imputation method can be determined. For the
phenomenon of missing values in the test set, in
order to maintain the original data distribution, we
use linear regression algorithms to train the
corresponding model to impute the missing values in
the test set. After the imputation process is
completed, use different classifiers to train the
imputed data set without missing values, and use the
test set to test the model performance.
(a) Model evaluation based on XGBoost (b) Model evaluation based on RF
(c) Model evaluation based on DT (d) Model evaluation based on KNN
Figure 1: Overall Survival Model Evaluation.
10-Year Breast Cancer Survival Prediction Research based on Missing Value Imputation
339
(a) AUC based on XGBoost (b) AUC based on RF
(c) AUC based on DT (d) AUC based on KNN
Figure 2: AUC of Overall Survival Model Evaluation.
(a) AUC of 10-year survival model (b) The evaluation of 10-year survival models
Figure 3: AUC and evaluation based on 10 year-survival model.
From the Figure1 and Figure 2, it is obvious that
the method of deleting will cause data imbalance
and ultimately affect the accuracy of the model. In
the combination of different imputation methods and
classification algorithms, except for the KNN
classification algorithm, the KNNI+kmeans-GMM is
better than other imputation algorithms in terms of
AUC evaluation indicators. Compared with models
without missing value imputation, the model of
kNNI+kmean+GMM + XGBoost is an effective
ICHIH 2022 - International Conference on Health Big Data and Intelligent Healthcare
340

combination whose AUC is 0.835 greater than other
combinations.
This study considers the use of all data
information as much as possible for survival
modeling, and does not consider whether certain
features are related to label. If a column of features
and labels are not very relevant, then data imputation
for this miss data will increase data noise. Therefore,
in the following research, we will explore the
importance of features in more depth in the future.
REFERENCES
A. Burton and D. Altman, “Missing covariate data within
cancer prognostic studies: a review of current
reporting and proposed guidelines,” British journal of
cancer, vol. 91, no. 1, pp. 4–8, 2004.
A. K. Waljee, A. Mukherjee, A. G. Singal, Y. Zhang, J.
Warren, U. Balis, J. Marrero, J. Zhu, and P. D.
Higgins, “Comparison of imputation methods for
missing laboratory data in medicine,” BMJ open, vol.
3, no. 8, p. e002847, 2013.
B. U. Wu, R. S. Johannes, X. Sun, Y. Tabak, D. L.
Conwell, and P. A. Banks, “The early prediction of
mortality in acute pancreatitis: a large population-
based study,” Gut, vol. 57, no. 12, pp. 1698–1703,
2008.
B. Zheng, S. W. Yoon, and S. S. Lam, “Breast cancer
diagnosis based on feature extraction using a hybrid of
k-means and support vector machine algorithms,”
Expert Systems with Applications, vol. 41, no. 4, Part
1, pp. 1476–1482, 2014.
D. B. Rubin, “Inference and missing data,” Biometrika,
vol. 63, no. 3, pp. 581–592, 1976.
D. B. Rubin, “Multiple imputations in sample surveys-a
phenomenological bayesian approach to nonresponse,”
in Proceedings of the survey research methods section
of the American Statistical Association, vol. 1, pp. 20–
34, American Statistical Association, 1978.
D. B. Rubin, Multiple imputation for nonresponse in
surveys, vol. 81. John Wiley & Sons, 2004.
D. Delen, G. Walker, and A. Kadam, “Predicting breast
cancer survivability: a comparison of three data
mining methods,” Artificial Intelligence In Medicine,
vol. 2, no. 34, pp. 113–127, 2005.
D. J. Stekhoven and P. Bühlmann, “Missforest—non-
parametric missing value imputation for mixed-type
data,” Bioin- formatics, vol. 28, no. 1, pp. 112–118,
2012.
D. J. Stekhoven, “missforest: Nonparametric missing
value imputation using random forest,” 2013.
E. Y. Kibis, “Data analytics approaches for breast cancer
survivability: comparison of data mining methods,” in
IIE Annual Conference. Proceedings, pp. 591–596,
Institute of Industrial and Systems Engineers (IISE),
2017.
G. Kabir, S. Tesfamariam, J. Hemsing, and R. Sadiq,
“Handling incomplete and missing data in water
network database using imputation methods,”
Sustainable and Resilient Infrastructure, vol. 5, no. 6,
pp. 365–377, 2020.
H. L. Afshar, M. Ahmadi, M. Roudbari, and F. Sadoughi,
“Prediction of breast cancer survival through
knowledge discovery in databases,” Global journal of
health science, vol. 7, no. 4, p. 392, 2015.
H. Miao, M. Hartman, N. Bhoo-Pathy, S.-C. Lee, N. A.
Taib, E.-Y. Tan, P. Chan, K. G. Moons, H.-S. Wong,
J. Goh, et al., “Predicting survival of de novo
metastatic breast cancer in asian women: systematic
review and validation study,” PLoS One, vol. 9, no. 4,
p. e93755, 2014.
H. Migdady and M. M. Al-Talib, “An enhanced fuzzy k-
means clustering with application to missing data
imputation,” Electronic Journal of Applied Statistical
Analysis
, vol. 11, no. 2, pp. 674–686, 2018.
J. L. Schafer and J. W. Graham, “Missing data: our view
of the state of the art.,” Psychological methods, vol. 7,
no. 2, p. 147, 2002.
J. M. Jerez, I. Molina, P. J. García-Laencina, E. Alba, N.
Ribelles, M. Martín, and L. Franco, “Missing data
imputation using statistical and machine learning
methods in a real breast cancer problem,” Artificial
Intelligence in Medicine, vol. 50, no. 2, pp. 105–115,
2010.
K. Maheswari, P. P. A. Priya, S. Ramkumar, and M. Arun,
“Missing data handling by mean imputation method
and statistical analysis of classification algorithm,” in
EAI International Conference on Big Data Innovation
for Sustainable Cognitive Computing, pp. 137–149,
Springer, 2020.
M. Di Zio, U. Guarnera, and O. Luzi, “Imputation through
finite gaussian mixture models,” Computational
Statistics & Data Analysis, vol. 51, no. 11, pp. 5305–
5316, 2007. Advances in Mixture Models.
M. Di Zio, U. Guarnera, and O. Luzi, “Imputation through
finite gaussian mixture models,” Computational
Statistics & Data Analysis, vol. 51, no. 11, pp. 5305–
5316, 2007.
M. G. Rahman and M. Z. Islam, “Missing value
imputation using a fuzzy clustering-based em
approach,” Knowledge and Information Systems, vol.
46, no. 2, pp. 389–422, 2016.
M. M. L. A. K. D. A. G. S. A. J. R. L. Carol E, Jiemin,
“Breast cancer facts & figures 2019-2020,” CA: A
Cancer Journal for Clinicians, vol. 69, no. 6, pp. 438–
451, 2019.
M. Naghizadeh and N. Habibi, “A model to predict the
survivability of cancer comorbidity through ensemble
learning approach,” Expert Systems, vol. 36, no. 3, p.
e12392, 2019.
M. Vazifehdan, M. H. Moattar, and M. Jalali, “A hybrid
bayesian network and tensor factorization approach for
missing value imputation to improve breast cancer
recurrence prediction,” Journal of King Saud
University-Computer and Information Sciences, vol.
31, no. 2, pp. 175–184, 2019.
N. Rathore, D. Tomar, and S. Agarwal, “Predicting the
10-Year Breast Cancer Survival Prediction Research based on Missing Value Imputation
341

survivability of breast cancer patients using ensemble
approach,” in 2014 International Conference on Issues
and Challenges in Intelligent Computing Techniques
(ICICT), pp. 459–464, 2014.
N. Shukla, M. Hagenbuchner, K. T. Win, and J. Yang,
“Breast cancer data analysis for survivability studies
and prediction,” Computer methods and programs in
biomedicine, vol. 155, pp. 199–208, 2018.
P. J. García-Laencina, P. H. Abreu, M. H. Abreu, and N.
Afonoso, “Missing data imputation on the 5-year
survival prediction of breast cancer patients with
unknown discrete values,” Computers in biology and
medicine, vol. 59, pp. 125– 133, 2015.
R. J. Kate and R. Nadig, “Stage-specific predictive models
for breast cancer survivability,” International journal
of medical informatics, vol. 97, pp. 304–311, 2017.
R. J. Little and D. B. Rubin, Statistical analysis with
missing data, vol. 793. John Wiley & Sons, 1987.
R. Kleinlein and D. Riaño, “Persistence of data-driven
knowledge to predict breast cancer survival,”
International journal of medical informatics, vol. 129,
pp. 303–311, 2019.
R. Kleinlein and D. Riaño, “Persistence of data-driven
knowledge to predict breast cancer survival,”
International journal of medical informatics, vol. 129,
pp. 303–311, 2019.
S. Eloranta, J. Adolfsson, P. C. Lambert, and P. Stattin…,
“How can we make cancer survival statistics more
useful for patients and clinicians: an illustration using
localized prostate cancer in sweden.,” Cancer Causes
& Control Ccc, vol. 24, no. 3, pp. 505–515, 2013.
T. Chen and C. Guestrin, “Xgboost: A scalable tree
boosting system,” in Proceedings of the 22nd acm
sigkdd interna- tional conference on knowledge
discovery and data mining.
T. Chen and C. Guestrin, “Xgboost: Reliable large-scale
tree boosting system,” in Proceedings of the 22nd
SIGKDD Conference on Knowledge Discovery and
Data Mining, San Francisco, CA, USA, pp. 13–17,
2015.
T. Schneider, “Analysis of incomplete climate data:
Estimation of mean values and covariance matrices
and imputation of missing values,” Journal of climate,
vol. 14, no. 5, pp. 853–871, 2001.
W. Vach and M. Blettner, “Missing data in epidemiologic
studies,” Encyclopedia of biostatistics, vol. 5, 2005.
X. Zhang, C. Yan, C. Gao, B. A. Malin, and Y. Chen,
“Predicting missing values in medical data via xgboost
regression,” Journal of Healthcare Informatics
Research, no. 383–394, 2020.
ICHIH 2022 - International Conference on Health Big Data and Intelligent Healthcare
342
