
Expectation and Stock Returns: Evidence from Trademark
Applications
Jiaming Zhu
Beijing No.35 High School, Grade 12, IFY Engineering, Beijing, China
Keywords: Trademark, Expectation, Stock Return.
Abstract: This paper tests the hypothesis that companies’ trademark applications on an “intent-to-use” basis deliver
messages of new developing lines of products in the future. I collect data from USPTO and use fuzzy match
techniques to find the trademark applications for each publicly traded firm in the United States. I find stock
prices of the applicants are indistinguishable prior to the application but start to diverge in the month following
application. Moreover, I show evidence of a strong correlation between the trademark applications behaviours
and stock market index returns. My results imply that the applications of trademarks contain important
information of stock prices for firms.
1 INTRODUCTION
How does expectation impact a decision? Is
expectation biased? These two questions are of
general interests to economists in general., and I find
trademark application behaviours of public firms are,
to some extent, a good opportunity to address these
two questions.
Trademark is a recognizable sign, design, or
expression that identifies products of a particular
source from products of others. Therefore,
trademarksare important for product differentiation.
However, in contrast to our impression of trademark
applications, over half of them are filed on an “intent-
to-use” basis, which means to file an application,
there is no need to have any existing product in
production or sales. The U.S. Patent and Trademark
Office (USPTO)--the authority of trademark
application and registration– allows a maximum of 36
months before a final decision to register or abandon
the mark.
Therefore, an intention to apply for a product
mark suggests a company’s hope to develop new
lines of products. Before application, investors form
expectations of a company’s future growth rates.
After application, a company invests to research,
develop, and collect information to determine if they
will continue R&D on the product. This decision then
translates into a decision to register or abandon the
application. This divergence causes heterogeneous
shocks to investors of applying companies: positive
shock to investors of those registering applicants and
negative shocks to investors of abandoning
applicants. Do stock prices move accordingly?
If expectation is incorporated into a stock price,
then there is no difference between the two types of
companies before a trademark application, and
following the application, stock prices should move
in line with the type being revealed when uncertainty
is gradually resolved.
To answer the second question of expectation
bias, I first build an illustrative model which is
necessary because the impacts of expectation bias are
mixed with shocks to different types. The model
predicts that the average abnormal return to
trademark applicants will deviate from zero if the
expectation is not rationally formed. In particular,
negative abnormal returns on a high type implies
huge optimism and positive returns on low type
implies huge pessimism. My results suggest that there
is considerable optimistic expectation bias across
firms and over time on average, even causing
negative returns for registering applicants.
My research mainly contributes to three fields of
research. First, this paper is related to research in
behavioral finance such as Abarbenell and Bernard
(Abarbenell, Bernard, 1992) Amronin and Sharpe
(Amronin, Sharpe, 2013), Hirshleifer and Yu
(Hirshleifer, Yu, 2012), Greenwood and Shleifer
(2014), Gennaioli et al. (2015) and Barberis et al.
(2018) which find that investor expectations are
Zhu, J.
Expectation and Stock Returns: Evidence from Trademark Applications.
DOI: 10.5220/0011360400003440
In Proceedings of the International Conference on Big Data Economy and Digital Management (BDEDM 2022), pages 973-978
ISBN: 978-989-758-593-7
Copyright
c
2022 by SCITEPRESS – Science and Technology Publications, Lda. All rights reserved
973

extrapolative. Barberis (Barberis 2003) provides a
good handbook of behavioral finance topics. Many of
them use survey data of investors, CFO/CEOs and
analysts
1
. However survey expectations can suffer
from measurement error problem. Greenwood and
Shleifer’s (Shleifer 2014) paper suggest survey
expectations of future returns are low in recessions
which seems controversial as surveyees may
misunderstand the survey questions. Instead of
studying the expectation itself, I study the ex post
responses to the expectation formed earlier when
information is gradually available to resolve
uncertainty. In particular, the ex post outcome is
binary and identifiable in my setting: a company
either registers or abandons the application. Most of
existing research relies on the argument that a rational
expectation predicts that the average stock returns are
zero even though the high type are faced with positive
shock and low type are faced with negative shocks.
This binary division of types via application outcome
lends researchers another lens to study the impacts of
expectation bias.
Second, my research is also related to stock return
reversals. In general, I find a negative 1-year return
predictability around trademark applications.
Jagadeesh (Jagadeesh 1990) and Lewellen (Lewellen
2001) are examples that show negative short-horizon
autocorrelation of returns. Explanations of
“reversal”/”momentum” are broadly divided into
overreaction and underreaction. My results point to
overreaction in explaining a 1-year reversal of stock
returns. The “overreaction”/“underreaction” can also
be rephrased as “optimism”/“pessimism”. The former
behaviour pair refers to investors’ reactions to any
news about the prospect of the stock. The latter
sentiment pair describes investors’ attitudes towards
uncertain futures. My study shows the second type;
when information is not enough to resolve
uncertainty, investors tend to overestimate future
growth rates, and stock prices start to diffuse when
uncertainty is resolved. It is worthwhile to emphasize
that the 1-year negative autocorrelation is augmented
when there are trademark application events. It
suggests that trademark application initiates an
important period of information release.
The last contribution of my research is enhancing
people’s understanding of trademarks. Compared to
patents, the value of trademarks are small and
ambiguous, and the innovation behind a trademark is
lower (Krasnikov, 2009, Schmoch, Gauch, 2009). It
1
Gennaioli et al. (2015) provides a good comparison
among them
is not surprising. Patents exclude rivals from using
the technology such that they are totally prohibited
from entry to the market. Trademarks, however,
mostly lead to horizontal differentiation of products
and add marginal value to a firm. Hsu et al. (2018)
used the similarities of trademark portfolios among
firms to study a firm’s intention to merge and the
resulting impacts on industry competition. My results
are supposed to draw the attention of researchers to
another important yet ignored dimension of
trademarks: the expectations of future growth.
In the sections to follow: section 1 describes the
trademark data set; Section 2 shows the sample
selection and summary statistics; Section 3 is a
simple model that illustrates the impact of
expectation bias on stock returns; Section 4 provides
empirical evidence for the model at both the
aggregate and firm levels; Section 5 concludes.
2 DATA DESCRIPTION
2.1 Trademarks
The USPTO is an agency mostly known for issuing
patents for inventions to inventors and businesses.
Another important, but often forgotten role, is that
they also issue trademark registration for product and
intellectual property identification. Trademarks are
important for product differentiation via a form of
recognizable sign, design, or expression that
identifies products of a particular source from those
of others
2
. Therefore, companies with profitable
products have an incentive to register a mark for their
product so that they can enjoy the exclusive benefits
of their product and identify against their rivals.
For the purpose of this research, I will only focus
on applications with two distinctive features: (1)
applications that signal new product lines and (2)
applications for products that have uncertain
prospects. The first feature leaves a task to filter out
trademarks that are not related to specific products or
are for advertising/marketing purposes. The previous
points to logos that can be used for any of a
company’s products; the latter case is advertising
slogan or redesign of the slogan. Even though
USPTO does not directly provide a classification of
product versus marketing, the datasets provided by
2
There are also service markers, but their percentage in
the dataset is small . I will only focus on those about
products.
BDEDM 2022 - The International Conference on Big Data Economy and Digital Management
974

USPTO
3
allow researchers to determine a product
mark from a marketing mark. Following Hsu et al.
(2017), this research relies mainly upon two sources
of information to determine if a trademark is related
to specific products: drawing code and identification
character. In general, the trademark should have a
moderate amount of textual content and the text of the
mark should be relatively novel. (See Appendix 1 for
details of the classification scheme.)
I am also interested in trademark applications
because they express companies’ intentions to invest.
In general, there are two legal bases of applications:
“intent-to-use” and “in-use”
4
. “Intent-to-use”
applications can be filed when there is no product, but
applicants must file a declaration stating that they
have a bona fide intent to use the mark in commerce.
To file under the use basis, the owner must submit a
declaration stating that, as of the filing date, the mark
is used in commerce. The first option has only been
available since November 1989. An applicant filing
based on intended use cannot obtain registration until
(a) the mark is actually used in commerce, (b) a
verified statement or declaration to that effect is filed,
and (c) a specimen of use is submitted. By default,
there is a 6-month window for the applicant to file a
Statement of Use (SOU). The applicant may request
up to five six-month extensions for filing the SOU,
making the effective deadline for establishing use up
to 36 months. If the owner fails to establish use, the
application is treated as abandoned. Furthermore,
unlike patents, the review of trademark applications is
simple: (1) procedural matters such as proper
identification of the products and (2) the applicant’s
mark is not merely descriptive or likely to cause
confusion with a preexisting applied-for or registered
mark. With these said, for “intent-to-use” applicants,
they play an active role in the process-the decision to
apply and the decision to exit. Therefore, behaviors
engaged in trademark applications imply much about
a company’s expectations of future growth and how
they adjust to new information after the application.
2.1.1 Example: Apple Inc
One good case study about trademarks is Apple Inc.,
the world famous technology company that designs,
develops, and sells consumer electronics, computer
software, and online services. Its website
5
, has an non-
exhaustive list of 286 active and registered trademarks
owned by Apple Inc., and I matched about 80 % of
3
https://www.uspto.gov/learning-and-
resources/electronic-data-products/trademark-case-files-
dataset-0
4
See Graham et al. (2013) for more details.
them by name with the data set from USPTO
6
.
Additionally, using USPTO’s trademark data set, I
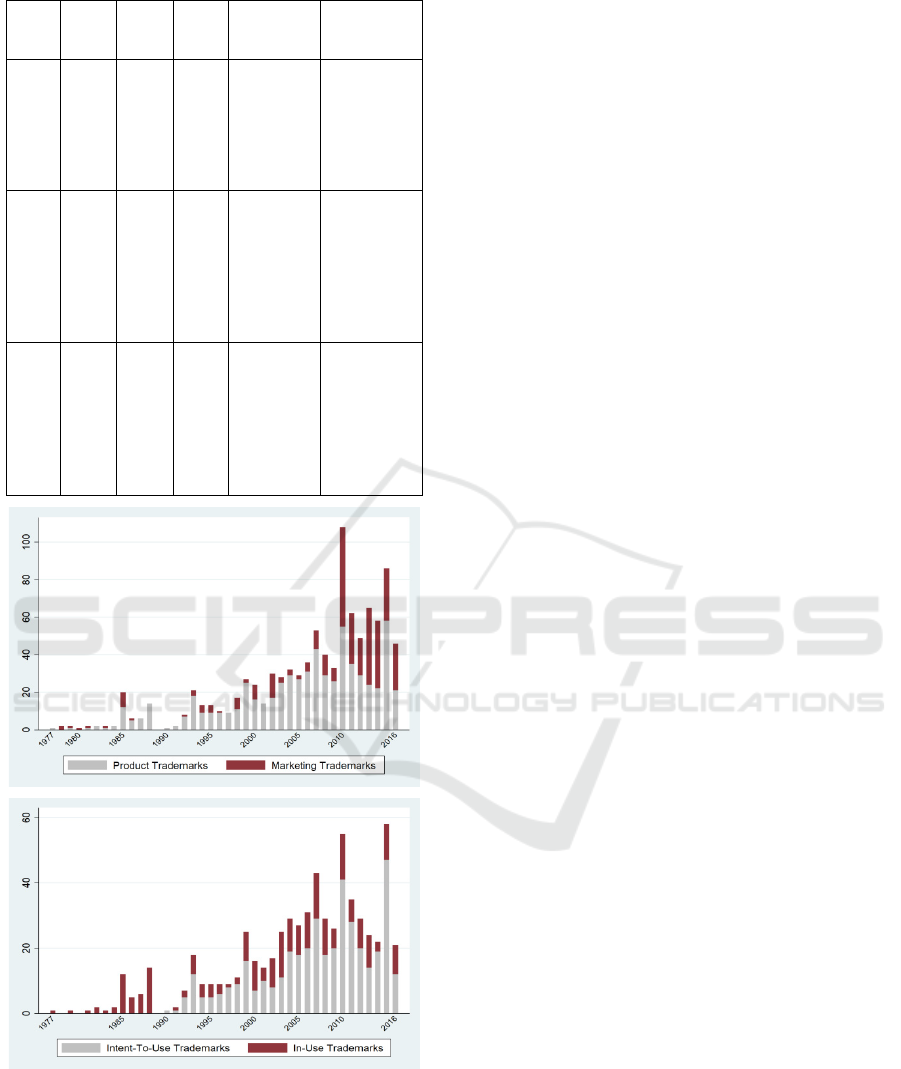
found 973 applications made by Apple Inc. since
1977. 66.5% are for new products, 59.5% are filed on
the basis of “intent-to-use,” and 18.8% are abandoned.
In the pool of applications made by Apple Inc.,
there are strong examples to show the difference
between: (1) a marketing trademarks and production
trademarks; (2) an “intent-to-use” and “In-Use”
application; and (3) registered applications and
abandoned applications. In Appendix 2, I have a list
of sample trademark applications made by Apple Inc.
Except for those well know logos and brands, for
example iPhone 6 and iPod, there are also many
attempts on products that are eventually abandoned,
for example the “Premium Reseller” and “X-Ray”.
The case of applying for a trademark for the first iPod
in 2001 is a good example of “intent-to-use”. Though
the iPod was released in 2001, its price and Mac-only
compatibility caused sales to be relatively slow until
2004. The final registration of the trademark was in
April of 2004. So what concerns the applicant of
trademarks is not only product development out of an
idea or technology, but also sales and profits.
Apple Inc.’s history of trademark applications
(Appendix) is typical for public firms. First, in the
early stage of the company, they devote more effort to
the research and development of new products, and in
later stages they focus on marketing and advertising to
shape their corporate image. Second, when firms have
developed, they become more aggressive/encouraged
to develop new products and apply for ”intent-to-use”
trademarks to seize the opportunity for any potentially
profitable projects.
3 RESULT
3.1 Summary Statistics
Since I will use the sample of intent-to-use
applications among public firms, I want to have an
overview of their patterns. I compare the time series
of public firms’ trademark applications growth rate of
intent-to-use (ITU) applications with a set of
aggregate level variables. I conduct pairwise
comparisons in Figure 1 and also show the correlation
matrix in Table 1. Grow rates or returns are
5
https://www.apple.com/legal/intellectual-
property/trademark/appletmlist.html
6
The unmatched can result from little difference in
names.
Expectation and Stock Returns: Evidence from Trademark Applications
975
logarithmized and over 12-month period: growth(x)
=100*[ln(X
t
) - ln(X
t-12
)] where t is the month.
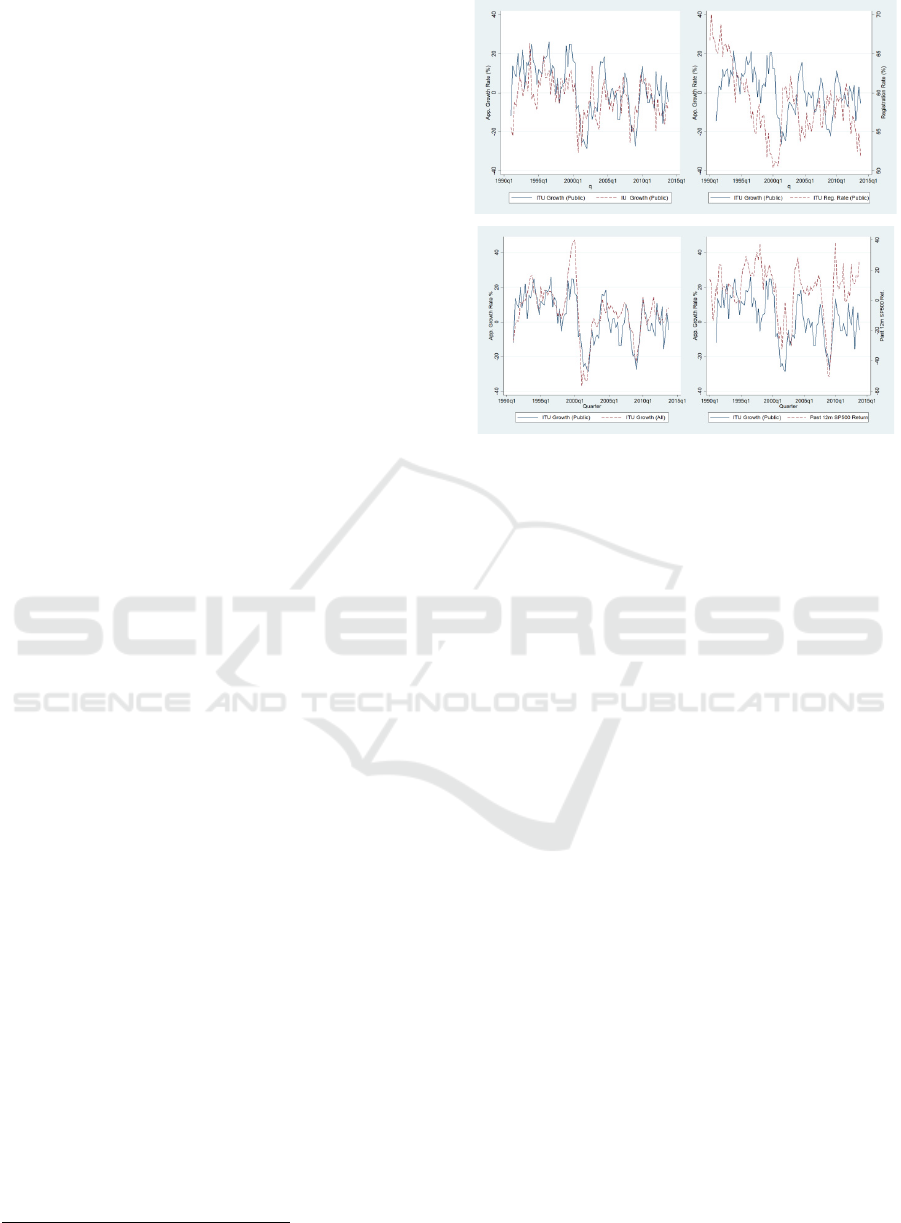
First, I compared it with the ITU growth rate of
all applicants (both public and private). They have
very similar patterns and a correlation coefficient of
0.8. The most stark
disparity is in the period of the “dot-com bubble”
between 1995-2000. The public companies are less
aggressive in filing applications than private
companies. Otherwise, the magnitudes and patterns
of the two time series are very similar. This suggests
that even though the matched sample of public
companies only contributes to 14% of the
applications, it is a representative sub-sample.
Second, I compared it with SP500 index total return,
and the two are highly correlated with coefficients of
0.6. Companies tend to file more trademarks in times
of bull market. I also check if the growth rate predicts
future SP500 return and find insignificant correlation.
Third, I compared it with the growth of in-use
applications in the same sample of public firms.
There are co-movements, but the growth of intent-to-
use is more volatile and has higher correlation with
the prior 12-month stock market performance.
Fourth, I wanted to check if a higher growth rate was
followed by lower probability of registration. There
is no evidence for this. However, registration rate is
associated with future performance.
This summary is a prelude of the empirical studies
to follow. It does not provide strong support to a story
of expectation bias and diffusion around trademark
applications. Therefore, I need more thoughtful
empirical design to disentangle the effects from these
other noises.
3.2 Correlation with Market Index
Return
For my empirical studies, I also used the SP500 index
total return, monthly stock return data from CRSP,
and returns to factors from Kenneth French’s Data
library
7
. Returns were value-weighted when there are
multiple stocks (permno) for one company (permco).
Also, consistent with most empirical asset pricing
research, I deleted stocks whose price is below five
dollars a share (for example, Jegadeesh and Titman
2001, Lou 2012) to address potential micro-structure
issues. Moreover, I used the logarithm of returns.
7
Kenneth French’s Data library.
Figure 1: Public firms’ intent-to-use application growth and
other variables in the time series.
There are five variables in these figures: the
growth rate of intent-to-use (ITU) applications by
public firms; the growth rate of intent-to-use (ITU)
applications by all firms; the growth rate of in-use
(IU) applications by public firms; the rate of
registration of ITU applications by public firms; the
past 12-month SP500 index total returns. I compared
pairwise between the first and the other four variables
in four figures, and I plotted the data in quarterly
frequency–each point presents the quarter-end month
value. Rates and returns are in percentages.
4 CONCLUSION
A company filing trademark applications on an
"intended use" basis conveys a message of
developing a new product line. After an application,
the effect is gradually visible. This research
determined that an applicant's stock price was
indistinguishable prior to application, but
disagreements began to emerge within a month of the
application. In addition, the number of trademark
application filings is positively associated with the
market index returns. My findings support that
trademark applications contain valuable information
for stock pricing. To a certain extent, the effect of
trademark registration measures the innovation
degree of a company's new product. The difference
BDEDM 2022 - The International Conference on Big Data Economy and Digital Management
976

between a trademark and a patent is that the object
and content of their protection are different.
The findings in the paper also pave the way for
future explorations. I can construct the tradeable
portfolio holding companies that have recently filed
trademarks. I can check if they can generate
exceptional returns which cannot be explained by a
six-factor model. If the risk-adjusted returns are
negative, it can support the optimistic expectations
bias and may help explain short-term reversals in
equity returns.
Table 1: Correlation and Summary Statistics.
Panel A: Correlation Matrix
Growth
(ITU,P
ublic)
Growt
h
(ITU,
All)
Grow
th
(IU,P
ublic)
Reg.
%
Past
12m
Stoc
k
Ret.
Fut
ure
12m
Stoc
k
Ret.
Gro
wth
(ITU
,Pub
lic)
1
Gro
wth
(ITU
,All)
0.800* 1
(0.00)
Gro
wth
(IU,
Publ
ic)
0.552* 0.603* 1
(0.00) (0.00)
Regi
strati
on
%
0.039* -0.103 0.104 1
(0.71) (0.33) (0.32)
Past
12m
Stoc
k
Ret.
0.590* 0.595*
0.384
*
-
0.108
1
(0.00) (0.00) (0.00)
(0.30
)
Futu
re
12m
Stoc
k
Ret.
0.116 0.083 0.103
0.233
*
0.09
7
1
(0.27) (0.43) (0.33)
(0.02
)
(0.02
)
Panel B: Summary Statistics
Variab
le
Obs Mean Std.
Dev.
Min Max
Growt
h
(ITU,P
ublic)
92
2.4
1
13.
36
-28.50
25.8
9
Growt
h
(ITU,
All)
92
5.8
1
15.
06
-36.70
47.2
8
Growt
h
(IU,Pu
92
-
2.6
3
10.
21
-30.67
25.4
7
b
lic)
Regist
ration
%
96
58.
68
4.3
6
50.43
69.9
6
Past
12m
Stock
Ret.
96
6.7
9
17.
57
-50.55
38.2
3
Future
12m
Stock
Ret.
96
7.4
0
17.
48
-50.55
38.2
3
There are six variables in these figures: the growth
rate of intent-to-use (ITU) applications by public
firms; the growth rate of intent-to-use (ITU)
applications by all firms; the growth rate of in-use
(IU) applications by public firm; the rate of
registration of ITU applications by public firms; the
past 12-month SP500 index total return; and the
future 12-month SP500 index total return. The first
panel of their correlation coefficients and p-values
are shown in brackets (Significance level:* 95% ).
The second panel provides a summary of statistics of
the six variables. I only keep quarter-end month
values, resulting in a time series of quarterly
frequency for each variable. Rates and returns are in
percentages.
APPENDIX
The following table lists detailed information of five
typical trademark applications made by Apple Inc..
The information is extracted from USPTO case file
and USPTO trademark search system.
Table:Examples of Trademark Applications by Apple Inc.
S
e
ri
al
N
0.
T
yp
e
Le
gal
Ba
sis
F
il
in
g
D
at
e
Reg
. /
Aba
n.
Dat
e
Log
o /
Nam
e
7
3
1
2
0
4
4
4
M
ar
ke
ti
ng
In-
Us
e
2
5/
0
3/
1
9
7
7
29/
11/
197
7
8
6
5
0
1
8
Pr
od
uc
t
In-
Us
e
1
3/
0
1/
2
0
09/
08/
201
6
IPHONE 6
Expectation and Stock Returns: Evidence from Trademark Applications
977
9
9
1
5
7
5
9
8
2
8
7
1
Pr
od
uc
t
Int
ent
-
To
-
Us
e
1
8/
1
0/
2
0
0
1
27/
04/
200
4
IPOD
8
5
1
7
9
3
6
1
Pr
od
uc
t
Int
ent
-
To
-
Us
e
1
7/
1
1/
2
0
1
0
04/
05/
201
5
(Ab
n.)
PREMIUM
RESELLER
7
7
0
9
9
1
7
0
Pr
od
uc
t
Int
ent
-
To
-
Us
e
0
5/
0
2/
2
0
0
7
20/
11/
200
8
(Ab
n.)
XRAY
Figure 2: Apple Inc.’s Yearly Number of Trademark
Applications By Type and Legal Basis.
REFERENCES
Amromin, G. and Sharpe, S.A., 2013. From the horse’s
mouth: Economic conditions and investor expectations
of risk and return. Management Science, 60(4), pp.845-
866.
Argente, D., Lee, M. and Moreira, S., 2018. How do Firms
Grow? The Life Cycle of Products Matters.
Barberis, N., Greenwood, R., Jin, L. and Shleifer, A.,
2018. Extrapolation and bubbles.
Bloom, N. and Van Reenen, J., 2002. Patents, real options
and firm performance. The Economic Journal,
112(478), pp.C97-C116.
Fama, E.F. and French, K.R., 1988. Permanent and
temporary components of stock prices. Journal of
political Economy, 96(2), pp.246-273.
Faurel, L., Li, Q., Shanthikumar, D. and Teoh, S.H., 2015.
CEO incentives and product development innovation:
Insights from trademarks.
Gennaioli, N., Ma, Y. and Shleifer, A., 2016. Expectations
and investment. NBER Macroeconomics Annual,
30(1), pp.379-431.
Greenwood, R. and Shleifer, A., 2014. Expectations of
returns and expected returns. The Review of Financial
Studies, 27(3), pp.714-746.
Hirshleifer, D., Li, J. and Yu, J., 2015. Asset pricing in
production economies with extrapolative expectations.
Journal of Monetary Economics, 76, pp.87-106.
Hsu, P.H., Li, K., Liu, Y. and Wu, H., 2018. Product Market
dynamics and mergers and acquisitions: Insights from
the USPTO trademark data.
Kogan, L., Papanikolaou, D., Seru, A. and Stoffman, N.,
2017. Technological innovation, resource allocation,
and growth. The Quarterly Journal of Economics,
132(2), pp.665-712.
Krasnikov, A., Mishra, S. and Orozco, D., 2009. Evaluating
the financial impact of branding using trademarks: a
framework and empirical evidence. Journal of
Marketing, 73(6), pp.154-166.
Lewellen, J., 2001. Temporary movements in stock prices.
Millot, V., 2009. Trademarks as an indicator of product and
marketing innovations.
Sandner, P., 2009. The market value of R&D, patents, and
trademarks. In The Valuation of Intangible Assets (pp.
35-72). Gabler.
Schmoch, U. and Gauch, S., 2009. Service marks as
indicators for innovation in knowledge-based services.
Research Evaluation, 18(4), pp.323-335.
BDEDM 2022 - The International Conference on Big Data Economy and Digital Management
978
