
Slide-recommendation System: A Strategy for Integrating Instructional
Feedback into Online Exercise Sessions
Victor Obionwu
1
, Vincent Toulouse
1
, David Broneske
2 a
and Gunter Saake
1 b
1
University of Magdeburg, Magdeburg, Germany
2
German Centre for Higher Education Research and Science Studies, Hannover, Germany
Keywords:
Text Mining, Filtering, Instructional Feedback, Learning Analytic, Natural Language Processing.
Abstract:
A structured learning behavior needs an understanding of the learning environment, the feedback it returns,
and comprehension of the task requirements. However, as observed in the activity logs of our SQLValidator,
students spend most time doing trial-and-error until they came to the correct answer.While most students re-
sort to consulting their colleagues, few eventually acquire a comprehension of the rules of the SQL language.
However, with instructional feedback in form of a recommendation, we could reduce the time penalty of inef-
fective engagement. To this end, we have extended our SQLValidator with a recommendation subsystem that
provides automatic instructional feedback during online exercise sessions. We show that a mapping between
SQL exercises, lecture slides, and respective cosine similarity can be used for providing useful recommen-
dations. The performance of our prototype reaches a precision value of 0.767 and an F
β=0.5
value of 0.505
which justifies our strategy of aiding students with lecture slide recommendation.
1 INTRODUCTION
The beauty of traditional task exercise sessions is the
on-hand availability of instructors to provide guid-
ance, corrections to tasks, and immediate feedback to
questions that arise in the course of learning. How-
ever, owing to new regulations that require online
dispensation of lectures and corresponding exercises,
the use of online tools and platforms, such as Moo-
dle (Costello, 2013), Blackboard (Machado and Tao,
2007), and the SQLValidator (Obionwu et al., 2021),
for lecture administration, and collaborative learning
(Obionwu et al., 2022) is the new standard. This
switch to online learning platforms, while making
learning flexible, mostly erases direct instructional
feedback, which is necessary for computer science
and engineering-related disciplines. Moreover, for
learners that are new to programming languages like
the structured query language, SQL, absence of in-
structional feedback results in a trial and error-based
form of learning engagement which results in a high
count of easily avoidable errors and an inconvenient
time penalty that leads to frustration. Thus, instruc-
tional feedback is necessary to aid novice students in
a
https://orcid.org/0000-0002-9580-740X
b
https://orcid.org/0000-0001-9576-8474
bringing their task engagement behavior into confor-
mity with the rules of SQL. Ergo, we integrated auto-
matic recommendations into the exercise task engage-
ment workflow. Hence, student need not get frustrated
as the feedback is persistent, automatic, and efficient
compared to traditional settings. Our implementation
relies on content-based filtering since the pedagogical
aspects of the database concepts course, correspond-
ing exercise tasks, and student’s proficiency levels are
already known (Charu, 2016). Hence, feedback pro-
vided to students are enriched with recommendations
that point to sections of our lecture material contain-
ing SQL topics, and sample queries necessary to suc-
cessfully solve the exercise task in question. Com-
pared to related efforts at student SQL learning en-
gagement improvement, optimization, and skill ac-
quisition, our method:
• provides meaningful instructional feedback dur-
ing individual online exercise sessions.
• fosters SQL skill acquisition by linking SQL the-
ory with corresponding exercise tasks.
In the following, we first present related work. In Sec-
tion 3, we present the conceptual idea of our following
implementation in Section 4. We evaluate our imple-
mentation in Section 5 and discuss challenges in Sec-
tion 6. Finally, in Section 7, we conclude our work.
Obionwu, V., Toulouse, V., Broneske, D. and Saake, G.
Slide-recommendation System: A Strategy for Integrating Instructional Feedback into Online Exercise Sessions.
DOI: 10.5220/0011351000003269
In Proceedings of the 11th International Conference on Data Science, Technology and Applications (DATA 2022), pages 541-548
ISBN: 978-989-758-583-8; ISSN: 2184-285X
Copyright
c
2022 by SCITEPRESS – Science and Technology Publications, Lda. All rights reserved
541
2 RELATED WORK
Several systems were developed to foster SQL learn-
ing. An educational tool developed by Arizona State
University enables the students to learn about rela-
tional query languages by letting the students solve
their homework assignments using their tool (Diet-
rich, 1993). However, the students receive their feed-
back directly from the interpreter, and thus we assume
the feedback to be too technical to be understood by
class participants with minor knowledge about SQL.
In comparison, our recommendation point’s students
to the lecture material that explains the correct us-
age of SQL concepts, thus reduces the time penalty
of the trial and error pattern. Another tool that sup-
ports students at learning SQL is the SQL-Tutor de-
veloped by the University of Canterbury (Mitrovi
´
c,
1998) and used at many universities around the globe.
The tool prompts students to solve SQL-related exer-
cises and, while doing so, it provides different stages
of feedback to the students. The feedback although
is restricted to the task at hand and is not utilizing
the learning materials of the course. Another tool, the
SQL Tester (Kleerekoper and Schofield, 2018), is an
online assessment tool based on a 50-minute test that
comprises ten questions. These questions are based
on a table with different categories of SQL concepts.
There is no limit to the number of trials that a student
can attempt the test. However, the students only re-
ceived the regular error messages from the RDBMS
as feedback. We are not aware of any research that
is trying to improve the SQL learning experience by
automatically connecting exercises to the material of
the lecture. In general, no techniques have been pro-
posed to improve SQL learning experience by inte-
grating our method of instructional feedback.
3 CONCEPTUAL FRAMEWORK
Several systems have been developed to facilitate
SQL skill acquisition. SQLValidator (Obionwu et al.,
2021) is one of such web-based tools.It is an integral
part of the database courses held is our faculty, and
encompasses exercises, questionnaires, and tests to
assess students’ SQL programming skills. In the next
subsection, we describe the Concept of analyzing the
lecture’s slides
3.1 Analyzing the Lecture’s Slides
Being that our aim is to support students in solving
SQL exercises by recommending slides from the lec-
ture that relates to the exercise they engage with, we
restrict the analysis of the lecture slides to the chapters
that contain SQL query-related information required
in the exercises. Ergo, the lecture slide analysis work-
flow consists of the following activity blocks: slide
conversion, preprocessing, keyword recognition, and
keyword analysis as shown in Figure 1. These activi-
ties are briefly described in the subsections below.
Lecture Slides
Chapter 1 Chapter n
...
Page 1 (counts)
select: 2
join: 1
where: 1
Sub-chapter 1
...
Page n (counts)
select: 2
join: 0
where: 5
...
Sub -
chapter n
Sub -
chapter 1
Chapter 1
Page 1 (tf)
select: 1
join: 0.5
where: 0.5
Page 1
Page 1 (idf)
select: 0.2
join: 1.2
where: 0.5
Page 1 (tf *idf)
select: 0.2
join: 0.6
where: 0.25
Slide Conversion Preprocessing
Keyword recognition
Tf, idf and tf * idf calculation
Figure 1: Lecture slide analysis workflow.
3.1.1 Slide Conversion & Preprocessing
The objective of the slide conversion step is the ex-
traction of relevant information from lecture slides.
To achieve this, we first convert a selected chapter
from PDF file format into a string format, enabling
us to further examine the textual contents of the chap-
ter. From here, we transit to the preprocessing activity
as shown in Figure 1. The objective of the prepro-
cessing stage is to clean the string data from the slide
conversion step (Famili et al., 1997; Nadkarni et al.,
2011). To execute the preprocessing step, the strings
are normalized and tokenized, splitting the normal-
ized strings into individual word stems. After this pro-
cess, the stop words are removed. Also at this stage,
further separation into subchapters, and partitioning
into pages are done as shown in Figure 1.
3.1.2 Keyword Recognition
This task aims to detect a slide’s topic designation.
Thus, the subchapters are broken down into pages,
and their contents are parsed, and stored for further
analysis. Then, for each page, the number of occur-
ring SQL keywords is counted. A list of relevant key-
words is predefined for this event. A sample list of
detected keywords is shown in the keyword recogni-
tion block. We observed that the frequency of the key-
word in a page is insufficient for deriving the slide’s
designation, as some keywords like the ”SELECT”
occur too often. Hence, we further perform keyword
analysis. Requisite for keyword analysis is the com-
putation of term frequency tf of a term, which can
easily be done by taking a count of all occurrences
of a keyword in a document (Manning et al., 2008).
DATA 2022 - 11th International Conference on Data Science, Technology and Applications
542

We further observed that larger documents are more
likely to repeat terms, which results in higher tf val-
ues in comparison to smaller pages. To eliminate the
effect of page length, we employ the maximum tf nor-
malization technique (Leskovec et al., 2014).
3.1.3 Keyword Analysis
Having evaluated, and normalized the term frequency,
we discriminate the pages from each other based on
term occurrences using a heuristic approach, inverse
document frequency, (idf). The mere occurrence of
a term in a document gives little or no insight into
the document with respect to its topic. When a term
appears seldom in the collection but occurs frequently
in a specific document, this term provides a hint about
how to distinguish the observed document from other
documents of the collection. The idf value for each
term t
i
is calculated by dividing the corpus (number of
documents), N, by the number of documents in which
the term n
i
appears and applying the logarithm, The
term frequency multiplied with the result of the for-
mula below equals the tf*idf value.
The inverse document frequency assigns a weight
to each keyword based on the number of pages the
keyword appears in. The keyword recognition block
in Figure 1 shows the idf values for the three key-
words WHERE, SELECT, and JOIN. The WHERE
keyword appears less often than the SELECT clause,
and the JOIN keyword among these three keywords is
least often featured in the slides. Thus, in the lower
part showing the calculations, the JOIN keyword re-
ceives a weight of 1.2 while the WHERE and SE-
LECT clauses receive an idf value of 0.5, and 0.2 re-
spectively. Next, we proceed to multiply the tf and idf
values for each keyword to compute the tf*idf value.
The Tf*idf (term frequency times inverse docu-
ment frequency) is used as a term weighting system
to calculate a weighing which translates to the influ-
ence that a keyword has on a page. Figure 1 shows the
JOIN keyword to have the highest tf*idf value with
0.6 compared to 0.25 for the WHERE clause and 0.2
for the select keyword (Ramos et al., 2003; Wu et al.,
2008). Thus, we estimate the topic of the page to
be mostly about joins. As a result, we can use these
tf*idf values for the typical SQL keywords to extract
the topic of a slide that can be compared to the topic
of the SQL exercise task. This process, Figure 1. is
repeated for the lecture slide.
3.2 Comparing Slides and Exercises
Having processed respective slides and SQL exer-
cises, Section 3.1, into a comparable format, we use
the cosine similarity between the lecture slides and
SQL exercises as a comparison metric. A depiction of
this process for a hypothetical Exercise 1 is shown in
Figure 2. It consists of the following steps: merging
of previous analysis, computation of cosine similarity,
and mapping of exercises to pages with the highest
cosine similarity.
Page. 2 (tf*idf)
select: 0.2
from: 0.5
Page. n (tf*idf)
alter: 1
table: 0.5
Lectures slides
(1) Results of previous
analysis are merged
(2) Computation of cosine
similarity between
exercise and slides
(3) Mapping of exercise
to pages with highest
cosine similarity
Page. 1 (tf*idf)
select: 0.2
from: 0.2
where: 0.3
Ex. 1 (tf*idf)
select: 0.2
from: 0.2
where: 0.3
Exercise 1
Exercise 1
Ex. 1 (cosine)
page 1: 0.8
page 2: 0.631
page n: 0
Exercise 1: Mapping
Ex. 1 (cosine)
page 1: 1.0
> : 0.3
Figure 2: Concept of combining the analysis results for the
lecture slides and SQL exercises.
In the merge stage, the slides and exercise analy-
sis are merged into a list during the first step of the
comparison process. Thus, for each exercise, we now
have access to the tf*idf values from every page with
respect to this exercise. Figure 2 shows the mapping
between Exercise 1, and each page alongside the re-
sult of their keyword analysis. Having performed the
merging, we evaluate the cosine similarity, i.e.,the an-
gle between two-word vectors (Sidorov et al., 2014).
In our use case, the word vectors consist of keywords
recognized from a query or lecture slide. A low an-
gle between those vectors means that the content of
the vectors is similar, while a high angle expresses
dissimilar content. An advantage of using the cosine
angle as a similarity metric is that the length of the
vectors is not relevant. As a result, the cosine similar-
ity for each page of the lecture is calculated in regard
to Exercise 1. The result shows that Page 1 has the
highest cosine similarity of 0.8 followed by Page 2
with 0.631, and Page n with 0. The page with the best
cosine value, in this case, Page 1, is then selected to
be mapped to Exercise 1, and hence recommended to
students having a problem with Exercise 1.
4 KEYWORD AND JOIN
RECOGNITION
Keywords, being a vital part of our system as they are
used every time we search for the occurrence of cer-
tain SQL keywords, we implemented a tool to create
a customary keyword lists that contain specific SQL
keywords selected by the administrator. For example,
Slide-recommendation System: A Strategy for Integrating Instructional Feedback into Online Exercise Sessions
543

there are SQL keywords available in our implemen-
tation, such as CONCAT, that are currently not men-
tioned in the lecture. Since this could also change
in the future, our implementation already supports a
wide variety of keywords. We now show the process
of mapping slides to exercises by walking through a
recommendation for Exercise E that is about the up-
date operation:
Update wine set vintage = vintage +1
Where color = ’red’;
The keyword analysis for Exercise E is displayed in
Table 1 with WHERE and UPDATE recognized once
and the equality sign twice. The idf values reveal that
the UPDATE keyword is the rarest keyword of these
three with an idf of 1.82 compared to 0.301 for the
WHERE keyword and 0.519 for the equality sign. A
tf*idf value of 0.91 is assigned to the UPDATE state-
ment, which means that it is the most important SQL
keyword for the Exercise E.
Table 1: Keyword analysis for exercise E.
keywords count tf idf tf-idf
Where 1 0.5 0.301 0.151
Update 1 0.5 1.82 0.91
= 2 1 0.519 0.519
Table 2: Keyword analysis of the recommended page to ex-
ercise E.
Chp: 2, Page: 34, Cosine: 0.984
keywords count tf idf tf-idf
where 1 0.5 0.507 0.254
update 2 1 1.109 1.109
in 1 0.5 0.273 0.137
= 2 1 0.556 0.556
as 1 0.5 0.316 0.158
Our system declares the 34th page of the second
chapter as the most similar slide of the lecture. The
keyword analysis for this slide is shown in Table 2
with the keywords WHERE, IN, AS recognized once
and UPDATE and equality sign twice. The cosine
similarity between Exercise E and the recommended
page with 0.984 is close to one, which resembles a
high similarity.Compared to keyword recognition,
the recognition of joins needs a more sophisticated
effort because joins in SQL can either be created with
the JOIN keyword or by the usage of the WHERE
keyword. In case of a join in the form of the WHERE
keyword, simply counting the number of keywords
would lead to an increase of recognized equality
signs and WHERE keywords, but a JOIN would not
be recognized. We have implemented a way to recog-
nize those disguised joins in our implementation. An
example of a join formulated by using the WHERE
keyword in Query 4 below
select Name, Vintage, PRODUCER.Vineyard
Table 3: Keyword analysis of the recommended page to ex-
ercise E.
keywords where update in = as
Count 1 1 1 1 1
Table 4: Method to recognize joins in the WHERE clause.
1 $ join stack = [ ] ;
2 array push ( $ join stack , ’ where ’ , ’
˙
’ , ’=’ , ’ n . ’ ) ;
3 foreach ( $uni gram as $ index =¿ $ entry ) :
4 if ( preg match ( $ join stack [ 0 ] , $ entry ) != false )
5 if ( sizeof ( $ join stack ) ¿ 1) array shift ( $ join stack ) ;
6 else {
7 array shift ( $ joins tack ) ;
8 array push ( $ join stack , ’where ’ , ’
˙
’ , ’=’ , ’
˙
’)
9 $ join counter++;
10 }
11 end foreach ;
12 return $ join counter ;
Table 5: Keyword recognition of page 21 from chapter six
after enabling join detection.
keywords select from join
Count 1 1 1
from WINES, PRODUCER
where WINES.Vineyard = PRODUCER.Vineyard;
The keyword analysis of the above query is dis-
played in Table 3. The SQL keywords SELECT,
FROM, WHERE and = are recognized once. The de-
sired behavior would be to recognize the keywords
SELECT, FROM and JOIN once each.
Table 4 shows the conceptual implementation of
the join recognition. We employ an array $ join stack
that stores the elements ’where’, ’.’, ’=’, ’.’ in this
exact order. In Line 3, the content of a page is read
in as one-liners. For each word, we test if this word
is equal to the first element in the $ join stack. If
the word is equal to the first element, we remove it
from the stack. This will be repeated until the stack is
empty, indicating that each keyword necessary to de-
scribe a join has been found, and therefore we incre-
ment the $ join counter variable. The $ join stack is
being filled again with keywords, and we resume the
join detection until every word of the page has been
read in. In the end, we return the number of detected
joins stored in the $ join counter variable of Line 12.
Considering Query 4, we can now correctly de-
clare the recognized keywords in Table 5. There is
one JOIN keyword detected, while the WHERE and
equality sign disappeared.
DATA 2022 - 11th International Conference on Data Science, Technology and Applications
544

5 EVALUATION
Since our objective is the integration of automatic in-
structional feedback into online exercise sessions, we
resorted to adding the recommendation feature to our
exercise administration tool, SQLValidator. This re-
quired the analysis of our lecture slides, and SQL ex-
ercise tasks. The keyword list has a significant in-
fluence on the mapping between slides and exercises.
Thus, based on the performance, we collated a list of
relevant keywords from a pool of SQL keywords con-
taining 58 elements.
Furthermore, to evaluate the usefulness of a map-
ping between slides and exercises, a ground truth is
required. Thus, we manually labeled the SQL exer-
cises so for each exercise there is a stored selection of
recommendable lecture slides. The decision of which
slides shall be recommended for a particular exercise
might be a topic of discussion. Depending on the ex-
perts’ view, the selection of suitable slides can be ei-
ther flexible or strict. As a result, the evaluation is
greatly influenced by the experts’ labeling. We miti-
gate this problem by using multiple experts in the la-
beling process instead of a single expert.
5.1 Performance Measures
We will evaluate the performance of our implementa-
tion by computing several performance metrics.These
are the standard performance metrics (Sokolova and
Lapalme, 2009; Bradley et al., 2006; Alvarez, 2002):
Accuracy: the fraction of slides correctly predicted
as being recommendable plus the number of slides
that were correctly not recommended to the students,
Precision: an estimate of the exactness of the recom-
mendation,
Recall: an estimate how many slides that are labeled
as positive were recommended to the students,
F-measure: a combination of precision and recall.
We also use the F
β
, which enables us to put more em-
phasis on one of the metrics, and therefore we chose
to weigh the precision value higher. Therefore, we
chose 0.5 for our β parameter.
5.2 Baseline Evaluation
The baseline evaluation of our system derives a map-
ping between slides, and SQL exercises by purely
computing the cosine similarity without using any ad-
ditional parameters. Only the preferred way of cal-
culating the idf values has to be selected. Using the
baseline approach means that only the slide with the
highest cosine similarity will be selected for recom-
mendation. If multiple slides are sharing the best co-
Table 6: Confusion matrix of baseline approach with idf
sub
.
pred. pos. pred neg.
actual pos. 38 (TP) 178 (FN)
acutal neg. 32 (FP) 11632 (TN)
total 70 11.810
Table 7: Confusion matrix of baseline approach with idf
col
.
pred. pos. pred neg.
actual pos. 38 (TP) 178 (FN)
acutal neg. 28 (FP) 11636 (TN)
toal 66 11.814
Table 8: Performance metrics for baseline approach.
Metric Accuracy Precision Recall F-Measure F
β=0.5
value
sub
0.982 0.543 0.176 0.266 0.383
value
col
0.983 0.576 00.176 0.27 0.396
sine value, then they are recommended. The confu-
sion matrix of the baseline approach using the idf
sub
computation is shown in Table 6. In our implementa-
tion, there are 180 slides, and 66 SQL exercises result-
ing in 11.880 entries in the confusion matrix. Out of
the 70 entries predicted as positive, 38 were positive.
There are 11.810 entries in the column predicted neg-
ative with 178 counted as false negative and 11632 as
actually negative. The table cell of true negative en-
tries is of interest to us since it contains a little more
than 98% of all entries. This imbalance of instance
distribution is expected because there are 180 possible
recommendations for each exercise but usually, only
a few slides for each exercise are labeled as recom-
mendable. Suppose there is an exercise for which we
selected three pages as appropriate. If our implemen-
tation recommended a random slide for this exercise,
which turns out to be inappropriate for this exercise,
there would still be 176 slides correctly classified as
not recommendable and, hence, 176 entries are added
to the true negative cell. This effect is reinforced by
using the baseline approach, since the recommenda-
tion is restricted to only recommend the pages with
the highest cosine value, further decreasing the num-
ber of slides that are recommended. Furthermore, the
idf value of a keyword can also be calculated by con-
sidering, for all available pages, the number of oc-
currences of the keyword. Thus, we will refer to
the subchapter-wise idf calculation as idf
sub
, and the
collection-wise idf values will be referred to as idf
col
.
The result for the baseline approach in combination
with the idf
col
calculation is shown in Table 7. The idf
variation is barely visible because the idf
col
method
predicts 66 instances as positive, compared to 70 pos-
itive predictions in the idf
sub
computation. The dif-
ference in negative predictions is also negligible, with
11.810 negative predictions in Table 6 and 11.814 in
Table 7.
Slide-recommendation System: A Strategy for Integrating Instructional Feedback into Online Exercise Sessions
545

Table 8 shows the performance metrics with re-
spect to the confusion matrices from Table 6 and 7.
The accuracy of both idf calculations is rather high,
with 0.982 using idf
sub
and 0.983 using idf
col
. This is
mostly due to the previously described fact that most
of the pages are correctly classified as true negative.
The precision value of idf
sub
is slightly lower than the
precision for idf
col
method with 0.576. That means
slightly more than half of our baseline’s recommen-
dations are correct recommendations. Each of the
remaining metrics recall, F-measure and F
β=0.5
are
rather similar for both idf computations. The recall
value for both methods is 0.176 which implies that
around 17% of the slides classified as recommendable
are selected by our system. The F-measure, which is
influenced by the precision and recall metrics equally,
reaches 0.266 with the idf
sub
and 0.27 with the idf
col
.
The most important metric in our use case is the
F
β=0.5
which equates to 0.383 for the idf
sub
calcula-
tion and 0.396 for the idf
col
. The performance met-
rics of the collection-wise idf approach are slightly
better than the subchapter-wise idf. Therefore, we fo-
cus on the collection-wise idf calculation technique
in the remainder because the peak performance will
be achieved by using idf
col
. Hence, by the baseline
approach, we mean the baseline approach using the
collection-wise idf from now on. In the following sec-
tions, we will improve the recommendation perfor-
mance by utilizing our already introduced optimiza-
tions of join detection, clustering of keywords and
minimal cosine values.
5.3 Detecting Joins
The join detection has a beneficial effect on the false
negative and true negative predictions, although they
profited percentage-wise significantly less compared
to the positive predictions. Table 9 shows the con-
fusion matrix of our join detection alongside the rate
of change compared to the baseline approach using
collection-wise idf values. Applying the join detec-
tion yields a positive effect on the classification re-
sults. The number of true positive predictions in-
creased by 15.8% while the number of false-positive
predictions decreased by 21.4%. The performance
metrics of the baseline approach with and without join
detection are shown in Table 10. Each of the perfor-
mance metrics increased with the activated join detec-
tion. The accuracy value increased almost negligible
from 0.983 to 0.984. The recall and F-measure im-
proved more with 0.176 to 0.204 and 0.27 to 0.312
respectively. Especially noteworthy is the increase in
the precision value from 0.576 to 0.667 through en-
abling the join detection.
Table 9: Results of activated join detection compared with
baseline approach.
idf
col
pred. pos. pred neg.
actual pos. 44 ↑ 15.8% 172 ↓ 3.4%
acutal neg. 22 ↓ 21.4% 11642 ↑ 0.052%
total 66 ±0 11.814 ±0
Table 10: Performance with and without join detection.
Metric Accuracy Precision Recall F-Measure F
β=0.5
¬(join detection) 0.983 0.576 0.176 0.27 0.396
join detection 0.984 0.667 0.204 0.312 0.459
5.4 Clustering Keywords
To improve our slide recommendation, we analyzed
our data set and identify specific keywords that need
to be clustered. This cluster consists of the keywords
<,>=, and SELECT. This process of choosing suit-
able keywords is manual. Table 11 depicts the con-
fusion matrix for this clustering approach. The clus-
tering leads to 4.6% more true positive predictions,
while the false positive recommendations were low-
ered by 9.1%. The performance metrics are displayed
in Table 12 alongside the comparison to the former
best approach without cluster usage, but with join de-
tection. The application of the cluster causes the accu-
racy to increase from 0.983 to 0.984. More notably,
the precision rises from 0.667 to 0.697. The recall
value increases slightly from 0.204 to 0.213. The
improvement of both the recall and precision values
causes the F
β
value to increase from 0.459 to 0.479.
Especially, the improved precision and F
β
metrics im-
ply that the clustering of keywords enables our system
to recommend useful slides to the students.
The improved performance due to the clustering
is due to two more mappings between exercises and
slides that are now done correctly. One of the exer-
cises for which the prototype found the correct rec-
ommendation will be referred to as task E:
SELECT job, MIN (ALLsalary) AS min salary
FROM employee
GROUP BY job;
The keyword analysis for task E yields the results
shown in Table 13 with the recognized keywords SE-
LECT, GROUP BY, GROUP, AS, MIN, and ALL.
The MIN and ALL keywords have the highest tf*idf
value with 1.217 assigned to it and therefore they are
the most important keywords for this exercise.
The recommendation before clustering is incor-
Table 11: Confusion matrix of cluster application.
pred. pos. pred neg.
actual pos. 46 ↑ 4.6% 170 ↓ 1.2%
acutal neg. 20 ↓ 9.1% 11644 ↑ 0.02%
total 66 ±0 11.814 ±0
DATA 2022 - 11th International Conference on Data Science, Technology and Applications
546
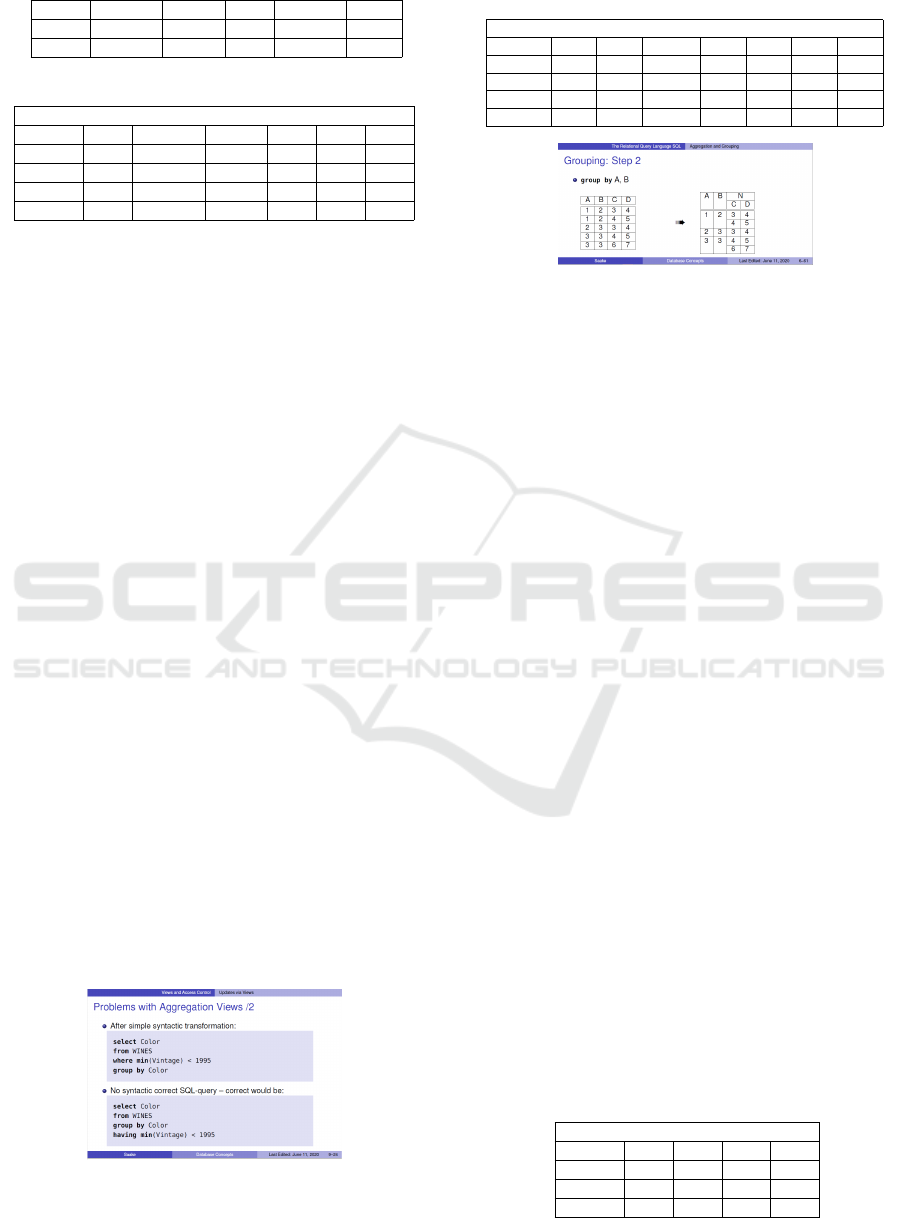
Table 12: Performance with and without clustering.
Metric Accuracy Precision Recall F-Measure F
β=0.5
¬cluster 0.984 0.667 0.204 0.312 0.459
cluster 0.984 0.697 0.213 0.326 0.479
Table 13: Keyword analysis for task E from our system.
Chapter: 9, Page: 24, Cosine: 0.625
keywords select group by group as min all
count 1 1 1 1 1 1
tf 1 1 1 1 1 1
idf by 0.087 1.121 1.121 0.405 1.217 1.217
tf*idf 0.087 1.121 1.121 0.405 1.217 1.217
rect, since the recommended page is not helpful to
the students. The chosen page is the twenty-fourth
page of the ninth chapter ”Views and Access Con-
trol”. Page 24 contains information about the prob-
lems with aggregation views, although task E does
not feature any information about views. Hence, the
recommendation of page 24 is not useful for stu-
dents that are challenged by task E. Table 14 displays
the keyword analysis for page 24. The keywords
WHERE and HAVING were recognized once, and the
keywords SELECT, GROUP BY, <, MIN, GROUP
twice. The highest tf*idf values are reached by the
keywords MIN at 1.556 and < with 1.352.
The recommendation to task E should contain in-
formation as to how the GROUP BY keyword can
be used to aggregate data. Instead of recommending
page 24 of the ninth chapter, the independent labelers
chose page 61 of the sixth chapter, displayed in Fig-
ure 4 as a good fit for task E since it visualizes the
process of using the GROUP BY clause.
The keyword analysis for our desired recommen-
dation is shown in Table 15. Page 61 contains the
three SQL keywords AND, GROUP BY and GROUP
once with the GROUP BY keyword reaching a tf*idf
of 1.109 and the GROUP clause following at 1.051.
The comparison between Table 14 and Table 15
shows that the cosine similarity of page 61 with 0.625
is lower than the cosine value of 0.682 from the cur-
rent recommendation. In order to change the recom-
mendation from page 24 to page 61, we need to in-
fluence the cosine similarity between task E and the
slides by creating a suitable cluster.
Figure 3: Incorrect recommendation of page 24 from chap-
ter nine to task E before clustering.
Table 14: Keyword analysis of the incorrectly referred page
24 from chapter nine.
Chapter: 9, Page: 24, Cosine: 0.625
keywords select where group by group having < min
count 2 1 2 2 1 2 2
tf 1 0.5 1 1 0.5 1 1
idf by 0.347 0.484 1.109 1.051 1.301 1.352 1.556
tf*idf 0.347 0.242 1.109 1.051 0.651 1.352 1.556
Figure 4: Page 61 of the sixth chapter, which should be
chosen for recommendation.
Page 24 contains the < and SELECT keywords,
with the SELECT clause being also shared with task
E. We have a cluster in use that contains the SE-
LECT and < statements and thus changes the tf*idf
values of page 24. The performance evaluation of
page 24 is shown in 16 with the SELECT keyword
having a tf*idf value at 1.352 instead of 0.347. The
increased tf*idf value causes the similarity between
task E and page 24 to shrink, and thus the new cosine
value equals 0.625. The cosine similarity of page 61
does not change in respect to task E because our de-
sired recommendation does not share any keywords
with the cluster. The unchanged similarity of 0.64 is
sufficient in order to be chosen for recommendation in
task E, since the former cosine value of page 24 de-
creased. Our cluster contains three keywords in total,
with the >= clause not being mentioned yet. In our
research, we observed a performance decrease when
using a cluster that only contains the SELECT and
< keywords. We believe that using the cluster with-
out the >=yields a side effect to the other exercises,
which is why we chose to include >= in our cluster.
6 DISCUSSION
The evaluation shows that we achieved our goals at
providing a method to optimize student learning en-
gagement during online SQL exercise task engage-
ment. However, there are still challenges with SQL
keywords which are regularly used in the English lan-
guage. Some SQL keywords such as AND, IN or AS
Table 15: Keyword analysis for page 61 from chapter six.
Chapter: 6, Page: 61, Cosine: 0.64
keywords count tf idf tf*idf
group by 1 1 1.109 1.109
group 1 1 1.051 1.051
and 2 1 0.499 0.499
Slide-recommendation System: A Strategy for Integrating Instructional Feedback into Online Exercise Sessions
547

Table 16: Keyword analysis for page 24 from chapter nine
after clustering.
Chapter: 9, Page: 24, Cosine: 0.625
keywords select where group by group having ! min
count 2 1 2 2 1 2 2
tf 1 0.5 1 1 0.5 1 1
idf by 0.347 0.484 1.109 1.051 1.301 1.352 1.556
tf*idf 0.347 0.242 1.109 1.051 0.651 1.352 1.556
are regularly used in the English language without any
SQL context. Since the lecture slides are written in
English, problems arise when counting the number of
times these keywords are used in a SQL environment.
This is challenging for our recommendation process if
the encountered keyword rarely appears in the corpus,
as it would receive a high idf weight, leading to a great
influence in deciding the topic of the page. In the
case of a page populated with many SQL keywords,
the negative effect of one incorrectly recognized key-
word might be mitigated by the tf*idf values of the
other keywords. If the page only has a few keywords,
it might happen that a word like IN or AND not used
in any SQL context will mislead the recommendation
process for this page.
7 CONCLUSION
This research is aimed at improving students’ perfor-
mance by reducing the unsystematic trial-and-error
behavior during online SQL exercises task engage-
ment in our SQLValidator. To this end, we have im-
plemented a strategy in which suitable slides from
lecture materials are mapped to respective SQL ex-
ercise tasks and are recommended to students in the
form of hints during exercise task engagement. We
have described, evaluated, and further optimized our
strategy via join detection and clustering. Our imple-
mentation as shown in the evaluation section reaches
a precision value of 0.767 and F
β=0.5
value of 0.505
thus justifying our strategy. The next stage in this rec-
ommendation system track is the impact assessment
of the recommendation on students’ engagement and
SQL skill acquisition. Students tend to share solution
codes. While solution distribution among students
cannot be stopped as it is also a part of learning. A
future direction is the implementation of a plagiarism
discouragement feature.
ACKNOWLEDGMENTS
This work was supported by the German Federal
Ministry of Education and Research [grant number
16DHB 3008].
REFERENCES
Alvarez, S. A. (2002). An exact analytical relation among
recall, precision, and classification accuracy in infor-
mation retrieval. Boston College, Boston, Technical
Report BCCS-02-01, pages 1–22.
Bradley, A., Duin, R., Paclik, P., and Landgrebe, T.
(2006). Precision-recall operating characteristic (p-
roc) curves in imprecise environments. In ICPR, vol-
ume 4, pages 123–127. IEEE.
Charu, C. A. (2016). Recommender Systems: The Textbook.
Costello, E. (2013). Opening up to open source: look-
ing at how moodle was adopted in higher education.
Open Learning: The Journal of Open, Distance and
e-Learning, 28(3):187–200.
Dietrich, S. W. (1993). An educational tool for formal re-
lational database query languages. Computer Science
Education, 4(2):157–184.
Famili, A., Shen, W.-M., Weber, R., and Simoudis, E.
(1997). Data preprocessing and intelligent data anal-
ysis. Intelligent data analysis, 1(1):3–23.
Kleerekoper, A. and Schofield, A. (2018). SQL tester: an
online SQL assessment tool and its impact. In Pro-
ceedings of the Annual ACM Conference on Innova-
tion and Technology in Computer Science Education,
pages 87–92.
Leskovec, J., Rajaraman, A., and Ullman, J. D. (2014). Min-
ing of Massive Datasets. Cambridge University Press.
Machado, M. and Tao, E. (2007). Blackboard vs. moodle:
Comparing user experience of learning management
systems. In FIE, pages S4J–7. IEEE.
Manning, C. D., Raghavan, P., and Sch
¨
utze, H. (2008). In-
troduction to Information Retrieval. Cambridge Uni-
versity Press.
Mitrovi
´
c, A. (1998). Experiences in implementing
constraint-based modeling in SQL-Tutor. In ITS,
pages 414–423.
Nadkarni, P. M., Ohno-Machado, L., and Chapman, W. W.
(2011). Natural language processing: an introduction.
JAMIA, 18(5):544–551.
Obionwu, V., Broneske, D., Hawlitschek, A., K
¨
oppen, V.,
and Saake, G. (2021). Sqlvalidator–an online student
playground to learn sql. Datenbank-Spektrum, pages
1–9.
Obionwu, V., Broneske, D., and Saake, G. (2022). Topic
maps as a tool for facilitating collaborative work ped-
agogy in knowledge management systems. Interna-
tional Journal of Knowledge Engineering.
Ramos, J. et al. (2003). Using tf-idf to determine word rele-
vance in document queries. In Proceedings of the first
instructional conference on machine learning, volume
242, pages 29–48. Citeseer.
Sidorov, G., Gelbukh, A., G
´
omez-Adorno, H., and Pinto, D.
(2014). Soft similarity and soft cosine measure: Simi-
larity of features in vector space model. Computaci
´
on
y Sistemas, 18(3):491–504.
Sokolova, M. and Lapalme, G. (2009). A systematic analy-
sis of performance measures for classification tasks.
Information processing & management, 45(4):427–
437.
Wu, H. C., Luk, R. W. P., Wong, K. F., and Kwok, K. L.
(2008). Interpreting tf-idf term weights as making rel-
evance decisions. TOIS, 26(3):1–37.
DATA 2022 - 11th International Conference on Data Science, Technology and Applications
548
