
Explainable AI based Fault Detection and Diagnosis System for Air
Handling Units
Juri Belikov
1 a
, Molika Meas
1,2
, Ram Machlev
3 b
, Ahmet Kose
2,4 c
, Aleksei Tepljakov
4 d
,
Lauri Loo
2 e
, Eduard Petlenkov
4 f
and Yoash Levron
3 g
1
Department of Software Science, Tallinn University of Technology, 12618 Tallinn, Estonia
2
R8Technologies O
¨
U, L
˜
o
˜
otsa 8a, Tallinn 11415, Estonia
3
The Andrew and Erna Viterbi Faculty of Electrical & Computer Engineering, Technion-Israel Institute of Technology,
Haifa 3200003, Israel
4
Department of Computer Systems, Tallinn University of Technology, 12618 Tallinn, Estonia
Keywords:
Buildings, HVAC, Fault Detection and Diagnosis, Machine Learning, Explainable Artificial Intelligence.
Abstract:
Fault detection and diagnosis (FDD) methods are designed to determine whether the equipment in buildings
is functioning under normal or faulty conditions and aim to identify the type or nature of a fault. Recent years
have witnessed an increased interest in the application of machine learning algorithms to FDD problems.
Nevertheless, a possible problem is that users may find it difficult to understand the prediction process made
by a black-box system that lacks interpretability. This work presents a method that explains the outputs of an
XGBoost-based classifier using an eXplainable Artificial Intelligence technique. The proposed approach is
validated using real data collected from a commercial facility.
1 INTRODUCTION
The building sector alone is responsible for ap-
proximately 36% of the global energy consumption
(Abergel et al., 2018). About half of the energy
consumed in commercial buildings comes from heat-
ing, ventilation, and air conditioning (HVAC) sys-
tems, which are used to maintain a certain level of
indoor comfort. Meanwhile, common HVAC system
faults that are caused by improper maintenance result
in 15% of waste in total annual energy consumption
(Xiao and Wang, 2009). Faults associated with HVAC
systems, such as sensor faults, control errors, com-
ponent malfunctions, and commissioning flaws, can
lead to indoor thermal discomfort, reduced compo-
nent lifespan, and increased energy consumption.
Recently, a growing number of research stud-
a
https://orcid.org/0000-0002-8243-7374
b
https://orcid.org/0000-0002-8003-4248
c
https://orcid.org/0000-0003-1439-2837
d
https://orcid.org/0000-0002-7158-8484
e
https://orcid.org/0000-0003-1266-1386
f
https://orcid.org/0000-0003-2167-6280
g
https://orcid.org/0000-0001-9775-1406
ies have focused on the development of automated
fault detection and diagnosis (FDD) tools for build-
ing HVAC systems (Mirnaghi and Haghighat, 2020).
The fault detection system is responsible for deter-
mining whether the equipment is functioning under
normal or faulty conditions, whereas fault diagnosis
aims to identify the type or nature of a fault. An-
other important component is the fault impact eval-
uation, which involves estimating the severity and
consequences of faults to help human operators to
decide on certain actions. The three common tech-
niques for HVAC system FDD problems can be gen-
eralized into knowledge (or rule)-based, model-based,
and data-driven methods (Mirnaghi and Haghighat,
2020). Modern building management systems gener-
ate vast amounts of data, enabling the implementation
of more complex data-driven algorithms (Mirnaghi
and Haghighat, 2020). Such methods have already
become prevalent in the industry due to the ability to
leverage lot of raw data (Srinivasan et al., 2021).
Several data-driven methods have been applied to
HVAC system fault detection and diagnosis. Works
(Wang and Xiao, 2004) and (Du and Jin, 2008) have
adopted the principle component analysis method to
detect faults in air handling units. Although the
Belikov, J., Meas, M., Machlev, R., Kose, A., Tepljakov, A., Loo, L., Petlenkov, E. and Levron, Y.
Explainable AI based Fault Detection and Diagnosis System for Air Handling Units.
DOI: 10.5220/0011350000003271
In Proceedings of the 19th International Conference on Informatics in Control, Automation and Robotics (ICINCO 2022), pages 271-279
ISBN: 978-989-758-585-2; ISSN: 2184-2809
Copyright
c
2022 by SCITEPRESS – Science and Technology Publications, Lda. All rights reserved
271

method is reported to have promising results, it does
not retain the original feature relationships, limiting
its application to fault diagnosis tasks where impor-
tant features need to be identified in order to locate
the root causes of the faults. Some studies regard
FDD tasks as classification problems. Some focus
on machine learning methods such as support vector
machines (SVM) (Han et al., 2011) and neural net-
works (NNs) (Du et al., 2014) for solving FDD tasks.
Deep learning methods such as convolutional neu-
ral networks (CNN) have also received an increased
interest for FDD problems due to their high perfor-
mance, computational efficiency, and ability to per-
form feature extraction and classification simultane-
ously (Liao et al., 2021; Li et al., 2021a). In gen-
eral classification tasks, SVM and other clustering al-
gorithms are also explored (Upadhyay and Nagpal,
2020; Borlea et al., 2021).
While the data-driven FDD models surveyed
above clearly have ample potential when applied to
complex HVAC systems, they may lack the ability to
explain and convince users to take informed actions.
This is due to the “black-box” nature of such mod-
els, which may hinder users from trusting the system.
This work suggests a method that explains the deci-
sions of an eXtreme Gradient Boosting (XGBoost)-
based classifier based on the so-called eXplainable AI
(XAI) concept, which significantly improves the feed-
back to the end-user, thus improving the practical use-
fulness of this method. To this end, first a diagnosis
model that is based on XGBoost is proposed to clas-
sify the normal operations of an air handling unit from
pre-selected four types of faults. A classifier model,
trained with fault-free data, is then introduced to filter
the faulty data before triggering the diagnosis model.
The resulting F1-scores are compared to two base-
line models. Then, the classification criteria of the
diagnosis model are explained using the SHAP tech-
nique, which indicates the importance of each input
feature. The obtained results are validated by a certi-
fied HVAC engineer, who confirms the correctness of
the most important features. The idea is demonstrated
using real data from a commercial building.
2 OVERVIEW OF XAI
TECHNIQUES IN BUILDING
APPLICATIONS
In this section, the application of explainable AI
technique (Gunning, 2017; Machlev et al., 2021) to
general problems in buildings is first discussed, see
(Machlev et al., 2022, Section 4.3) for a more detailed
discussion. The focus is then shifted to the specific is-
sues related to fault detection and diagnosis in typical
technical units. Based on the literature review, we in-
dicate that the use of XAI for building applications is
still new, and only a few studies have been reported so
far. Table 1 provides a summary of the XAI concept
used in building applications.
The general applications mostly encompass com-
mon problems of evaluating building performance
and predicting energy demand. In (Chakraborty et al.,
2021) XAI techniques were applied to the XGBoost
model for long-term forecasting of the cooling energy
consumption of buildings located in different climatic
areas. In (Gao and Ruan, 2021), the authors focused
on developing attention mechanisms to improve the
interpretability of the developed models. The bench-
mark of buildings using explainable AI was addressed
in several recent papers (Arjunan et al., 2020; Miller,
2019; Tsoka et al., 2021). In (Houz
´
e et al., 2021), the
use of explainability techniques was proposed in the
context of smart home applications.
Several recent papers on fault detection and diag-
nosis for HVAC systems have focused on explainabil-
ity for gaining user trust. In (Srinivasan et al., 2021),
the LIME (Local Interpretable Model-agnostic Expla-
nations) framework was adopted to explain cases of
incipient faults, sensor faults, and false positive re-
sults of the diagnosis model for the chiller system,
which is based on the XGBoost model. The gen-
eral XAI-FDD workflow was validated using several
real test cases. The proposed approach allowed to
reduce fault-detection time, analyze the sources and
origins of the problems, and improve maintenance
planning. The authors of (Madhikermi et al., 2019)
used the LIME method to explain the fault classifica-
tion results of the support vector machine and neu-
ral network models developed for the diagnosis of
heat recycler systems. In (Li et al., 2021b), a new
Absolute Gradient-weighted Class Activation Map-
ping (Grad-Absolute-CAM) method was proposed to
visualize the fault diagnosis criteria and provide the
fault-discriminative information for explainability of
the 1D-CNN model, applied to the detection of faults
in chiller systems. The developed method was vali-
dated using an experimental dataset of an HVAC sys-
tem, showing diagnosis accuracy of 98.5% for seven
chiller faults.
3 TECHNICAL BACKGROUND
AND METHODOLOGY
In this section, we provide a brief background on
the methods and notions used in the analysis and
ICINCO 2022 - 19th International Conference on Informatics in Control, Automation and Robotics
272

Table 1: Recent works on explainable AI methods for building applications.
Ref. Application AI Model XAI Technique Year
FDD
This work Detecting AHU faults RF, XGBoost SHAP 2022
(Srinivasan et al., 2021) Detecting incipient, sensor, and
chiller faults
XGBoost LIME 2021
(Li et al., 2021b) Detecting chiller faults 1D-CNN Grad-Absolute-
CAM
2021
(Madhikermi et al., 2019) Detecting heat recycler faults SVM and NN LIME 2019
General Applications
(Wenninger et al., 2022) Predicting long-term building en-
ergy performance
QLattice Permutation fea-
ture importance
2022
(Chakraborty et al., 2021) Analysis and prediction of climate
change impacts on building cooling
energy consumption
XGBoost SHAP 2021
(Akhlaghi et al., 2021) Performance forecast of irregular
dew point cooler
Deep Neural Net-
work
SHAP 2021
(Tsoka et al., 2021) Classification of building energy
performance certificate rating levels
ANN LIME 2021
(Arjunan et al., 2020) Benchmarking building energy
performance levels
XGBoost SHAP 2020
(Fan et al., 2019) Predicting coefficient of perfor-
mance of the cooling system
SVM, MLP, XG-
Boost, RF
LIME 2019
sketch the general methodology. We start with a brief
overview of the methods that are considered for the
proposed approach.
eXtreme Gradient Boosting: The XGBoost (Chen and
Guestrin, 2016) model is an efficient boosting model
that is used to solve both regression and classifica-
tion problems. It integrates several basic classifiers
together, which are usually decision tree models, to
form a more robust model.
Interpretation of Machine Learning Models: Com-
plex machine learning models such as support vec-
tor machines, neural networks, random forest, etc.
are black-box in nature. It is therefore crucial to
understand the rationale behind the decision mak-
ing process taking place in the machine in or-
der to invite more human involvement into the
loop and obtain more trust along the way. Many
methods have been developed for explaining ma-
chine learning models, such as LIME (Local inter-
pretable model-agnostic explanations), SHAP, CIU
(Contextual Importance and Utility), ELI5, and Grad-
CAM (Gradient-weighted class activation mapping),
in which the input can be an image, text, etc. (Barredo
Arrieta et al., 2020).
SHapley Additive exPlanation: SHAP is a game the-
ory based approach to explain the individual predic-
tions produced by machine learning models (Lund-
berg and Lee, 2017). It is used to show the contribu-
tions of the input features using the computed Shap-
ley values, where each feature works together as an
ensemble. The SHAP value is calculated for each fea-
ture in the input samples that needs to be explained.
Based on the aggregated Shapley values, it can also
provide global feature importance and feature inter-
actions. In fault detection tasks, having an estimation
of the input feature contribution is useful when visu-
alizing the model decision.
Figure 1 depicts the schematic flow of a general
process dedicated to the generation of explanations
for AI-based models. Here, an additional “Explainer”
layer is used at the later stage to generate explanations
by highlighting the main features that are significant
for the model output and to present them in a form
that is comprehensible by the end user.
0 1 0 1 0 0 1 0
0 0 1 1 1 0 0 0
0 1 0 1 0 1 0 0
0 1 1 0 0 1 0 1
0 1 1 0 0 0 1 1
0 1 1 0 1 0 0 0
MACHINE
LEARNING
PROCESS
EXPLAINABLE
AI MODEL
EXPLANATIONS
INFORMED
USER
Explanation 2
Explanation 1
. . .
Figure 1: The schematic of a conceptual XAI framework
with an additional explanation module, aiming to bridge the
gap between decisions made by a model and a user.
This research study, in which the above-described
methods are leveraged, is organized as follows: A
fault detection and diagnosis model based on XG-
Boost is implemented and compared with two base-
line models. A case study was conducted using real
data collected from a commercial building (a shop-
ping mall) located in Estonia. Four different types
of faults are selected to provide explanations of the
Explainable AI based Fault Detection and Diagnosis System for Air Handling Units
273

model. The SHAP method is integrated as the expla-
nation algorithm. Explanations are then evaluated by
certified HVAC engineers.
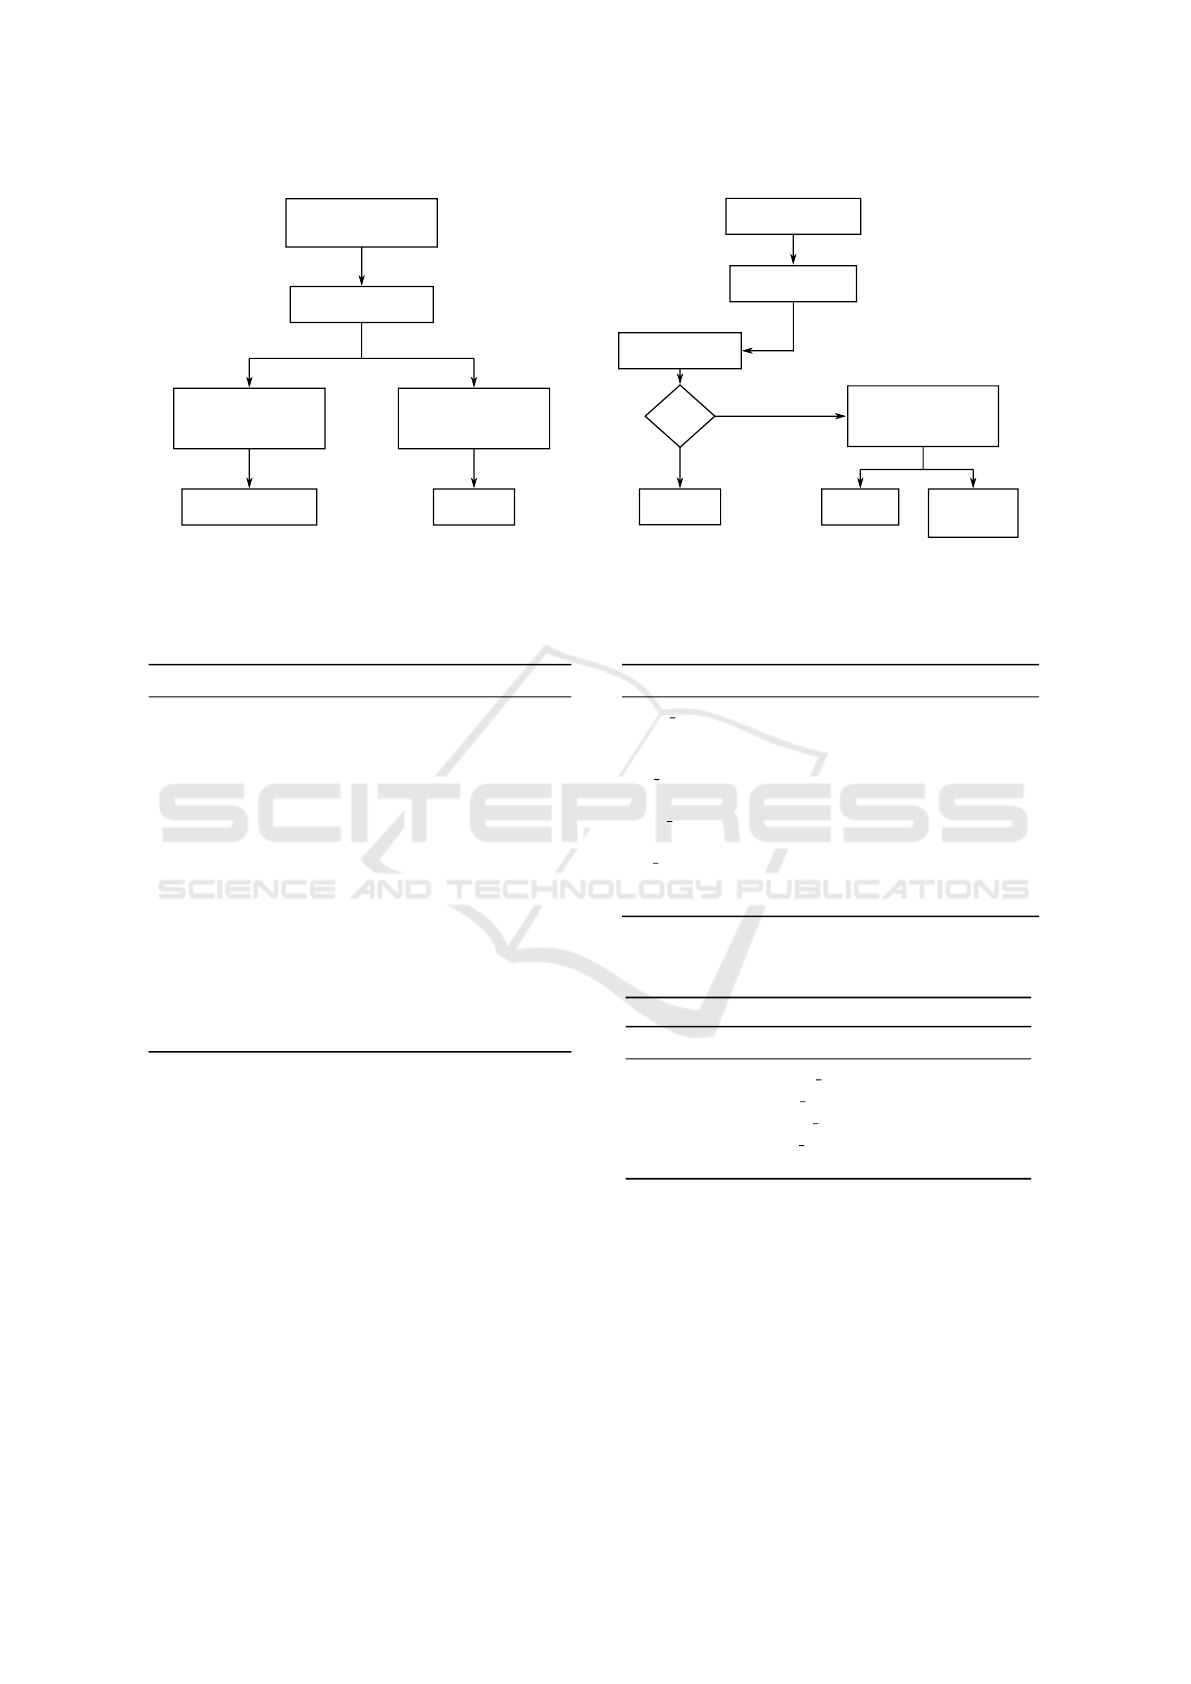
Figure 2 outlines the proposed methodology,
which can be summarized as follows:
• Data is collected for faulty and fault-free opera-
tions and is labeled according to the fault types.
Data is preprocessed by removing records with
null or non-existing values.
• Two XGBoostClassifier models are implemented
for the FDD problem:
– A binary classification model is used to classify
the sample as normal or faulty. The inputs to
the model are all the features from the dataset.
– The second model is a multiclass multi-label
classification model, which is used to classify
which fault class the sample belongs to. The
input uses the same dataset as the fault detec-
tion model.
• SHAP method is used to generate explanations for
the fault diagnosis model.
Performance metric: We use the F-measure to as-
sess the performance of the classification model. The
F-measure (or balanced F
1
score) is the harmonic
mean of the precision and recall measures, defined
as (Hripcsak and Rothschild, 2005):
F
1
=
2 · precision · recall
precision + recall
=
2TP
2TP + FP + FN
, (1)
where
precision =
TP
TP + FP
, recall =
TP
TP + FN
, (2)
TP is the number of true positives, FP is the number
of false positives, and FN is the number of false neg-
atives.
4 NUMERIC RESULTS
4.1 Data Collection and Preparation
In this paper, we consider the data obtained from a
shopping mall that was renovated over a decade ago.
The facility has three floors that are mostly heated by
the group of air handling units. The building is heated
with district heating while the cooling is provided by
two chillers.
Almost every large commercial building has a
building management system (BMS) that contains
thousands of data points that are presented through
a user interface in real-time. A BMS is usually de-
voted to information flow and communication with
the HVAC equipment. Besides monitoring, it also
provides custom reactive alarms to notify the oper-
ators at different levels. Data acquisition is accom-
plished through dedicated BMS in the facilities. The
method for data reading and writing is the API con-
nection supported by the BMS. Finally, the data trans-
mission is secured through encrypted VPN tunnels.
Data through BMS is read every 15 minutes and was
collected for the whole year in the period from Febru-
ary 01, 2020 to March 31, 2021. It includes mea-
surements obtained from an air handling unit dur-
ing different seasons. Before the analysis, the data
is filtered to exclude detected extreme outliers and
samples during non-operating periods. It was further
processed and the faults were labeled by a dedicated
HVAC engineer. The dataset includes 13 input fea-
tures as shown in Table 2, containing samples of air
handling units under normal operating conditions and
four types of faults listed in Table 3. The faults are
taken from real scenarios and operating conditions.
4.2 Model Development
In this study, the model aims to predict whether the
AHU is operating at normal or faulty condition at spe-
cific timestamps and which fault type(s) are present.
For training the fault detection model, binary labels
(0: not fault, 1: fault) are assigned to each sample.
For the fault diagnosis, the problem is formulated as
a multi-label classification problem, where the labels
are binary vectors (value 0 or 1 for each of the four
fault classes plus the normal class), and more than
one fault type can be present simultaneously. The in-
put data is split into 66% and 34% for the training and
test sets, respectively. Random stratified sampling is
applied in the data partitioning process to keep the
balance of fault classes for both sets.
Table 3 shows that the samples of normal opera-
tion (majority class) exceed those of faulty cases (mi-
nority class) with a ratio of about 10 to 1. Having im-
balanced classes for classification problems can lead
to biased predictions towards the majority class. This
problem is tackled with random over-sampling and
random under-sampling techniques to transform the
class distribution in the training set and eliminate the
extreme data imbalance.
The training set is used to train three machine
learning models, including LogisticRegression, Ran-
domForest, and XGBoost, each for both fault detec-
tion and diagnosis tasks. The hyperparameter is tuned
as follows: For the fault detection model, the num-
ber of estimators is set to 12 for both RandomForest
and XGBoost. For the fault diagnosis model, we set
the L1 regularization term on weight to 0.1 to reduce
ICINCO 2022 - 19th International Conference on Informatics in Control, Automation and Robotics
274
Training data (faulty
and fault-free data)
Data pre-processing
Training detection
model
(XGBoost Classifier)
Faulty / Faulty-free
Fault class
Training diagnosis
model
(XGBoost Classifier)
(a) Offline stage
Yes
New observation
Data pre-processing
Fault detection
Is fault?
Fault-free
Fault class
Explanation
(SHAP)
Diagnosis model
(XGBoost Classifier)
No
(b) Monitoring stage
Figure 2: Proposed fault detection and diagnosis method.
Table 2: Description of the used features.
Feature Short Description Unit
AAT Fresh air intake temperature
◦
C
ACCVO Cooling coil valve opening %
AHCT Heating coil temperature
◦
C
AHCVO Heating coil valve opening %
AHRS Heat recovery rotation speed %
AHRST Supply air temperature after heat
recovery
◦
C
ARAT Return air temperature
◦
C
ARFS Return fan speed %
ASAT Supply air temperature
◦
C
ASATCSP Supply air temperature calculated
setpoint
◦
C
ASFPE Supply fan static pressure Pa
ASFPECSP Supply fan static pressure calcu-
lated setpoint
Pa
ASFS Supply fan speed %
overfitting problem for XGBoost. For RandomForest,
we set the minimum number of samples per leaf to 2.
4.3 F1-score Results
The performance is evaluated using the test set for the
trained models—LogisticRegression (LR), Random-
Forest (RF), and XGBoost (XGB). The F
1
-scores are
displayed in Table 4. The XGBoost method achieves
the highest overall performance for most fault types.
Table 3: List of AHU faults used in the analysis.
Title Fault Type Component Sample Size
FPES M Fan pressure
sensor mal-
function
Sensor 1188
HR NW Heat recovery
not working
Heat recovery 2511
HCV L Heating coil
valve leakage
Heating coil 1044
CC C Cooling coil
closed
Controller 279
Normal – – 14246
Table 4: F
1
-score of the used models in both fault detection
and fault diagnosis tasks.
Model Fault Class LR RF XGB
Fault Detection Faulty 0.86 0.95 0.97
Fault Diagnosis FPES M 1 0.99 0.99
HR NW 0.64 0.86 0.90
HCV L 0.81 0.92 0.94
CC C 0.74 0.88 0.93
Normal 0.87 0.95 0.97
4.4 The Explanation of Individual
Instances
To assess the reliability of the predictions, four indi-
vidual instances are evaluated based on the calculated
Shapley values. As shown in Tables 5-8, the sup-
porting and opposing features are indicated by the red
and blue Shapley values, respectively, and the contri-
bution weights are based on the size of the absolute
Shapley values.
Explainable AI based Fault Detection and Diagnosis System for Air Handling Units
275

4.4.1 Fan Pressure Sensor Malfunction
The fan differential pressure sensor values correlate
with the air volume produced by the fans. If the fan
is off, the differential pressure value is expected to
be near zero. The sensor value is used to calculate
air volume and to verify if the fans are working. If
the sensor malfunctions, then the air volume control
may fail and even the whole ventilation machine may
switch to protective alarm mode.
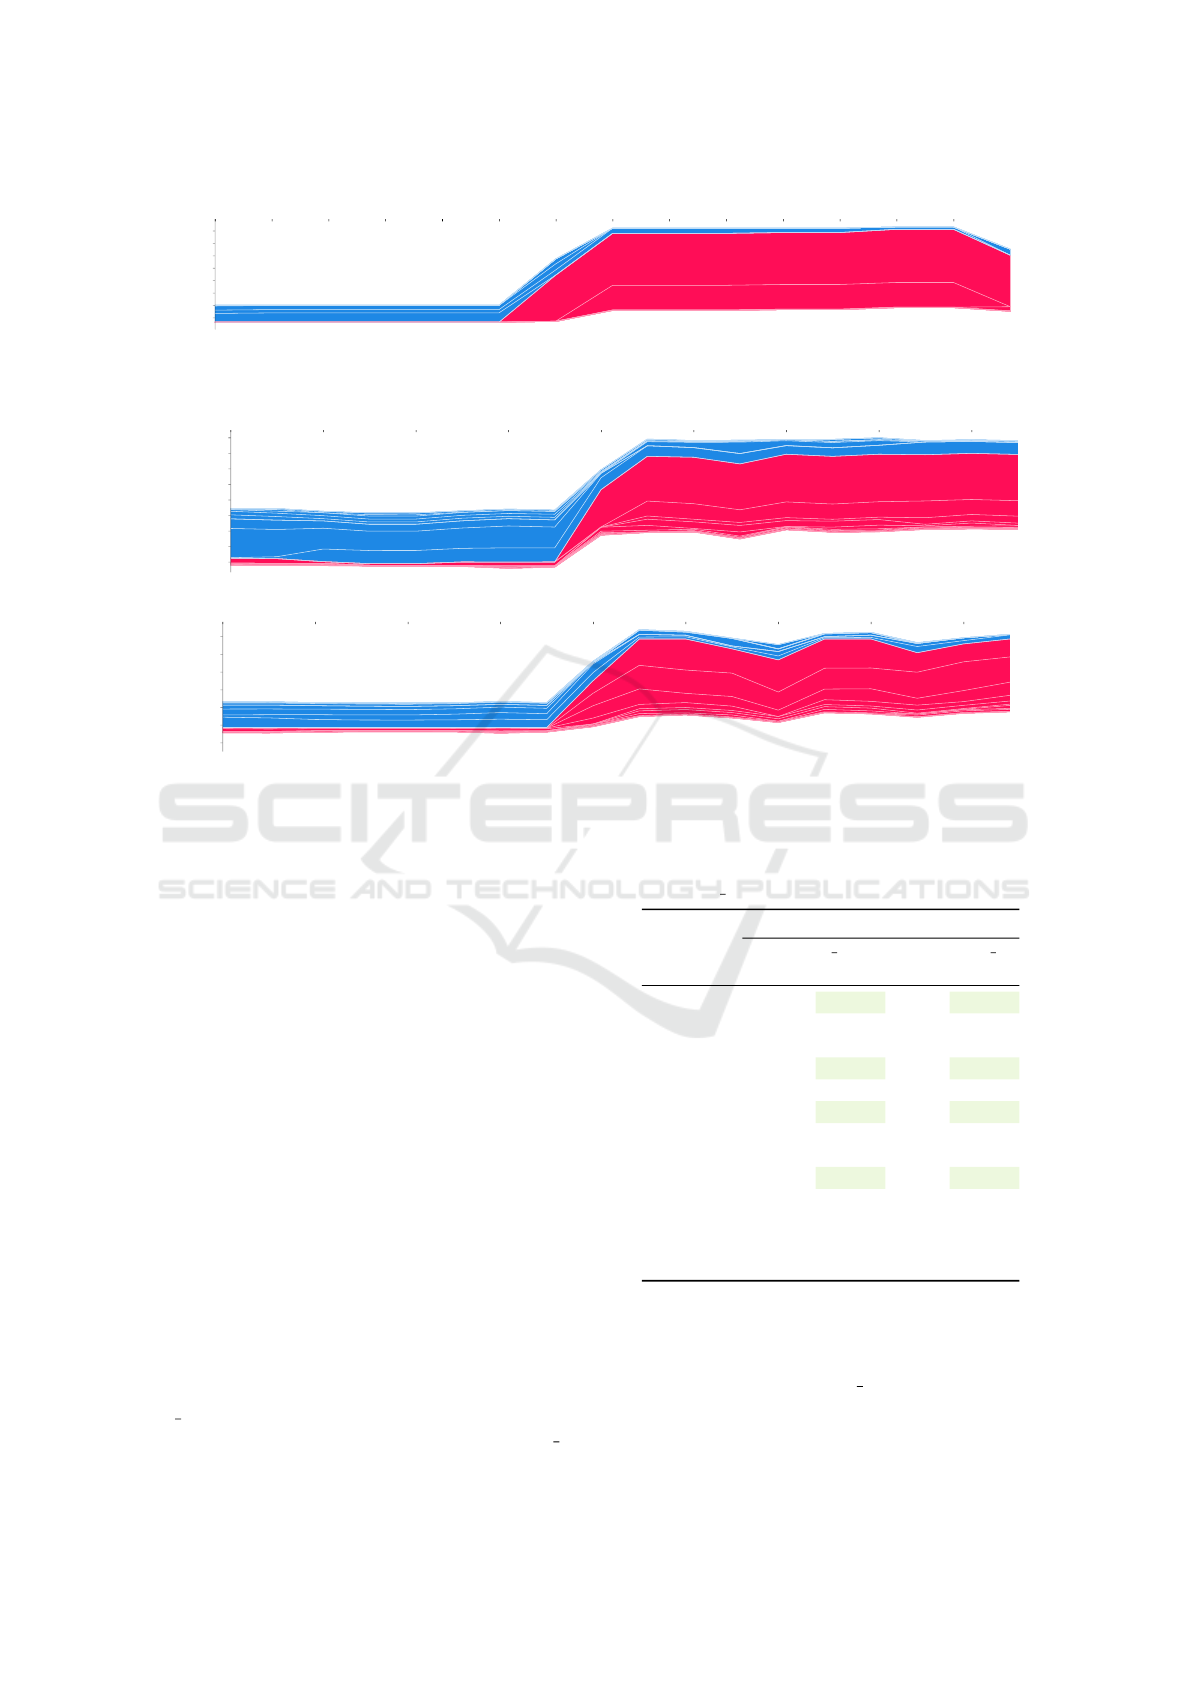
Figure 3 shows the XGBoost predictions (y-axis)
with the supply fan static pressure (ASFPE) sensor
value being the main contributing feature. The obser-
vation period (x-axis) is taken from 18:30 to 22:00 on
November 23, 2021, with the faulty state being eval-
uated at 20:45. Note that such types of sensor faults
can also be easily detected with simple statistical tools
to determine the acceptable range of sensor measure-
ments (Liao et al., 2021), eliminating the need for so-
phisticated machine learning models. However, such
complexity is not always the case for arbitrary types
of faults, as observed below.
Table 5: Quantitative explanations for XGBoost prediction
of the ‘FPES M’ type of fault.
Feature XGBoost
NOT FPES M FPES M
Real SHAP Real SHAP
AAT 6.78 0 5.17 0
ACCVO 0.0 0 0.0 0
AHCT 19.66 0 18.71 0
AHCVO 0.0 0 0.0 0
AHRS 43.24 0 18.35 0
AHRST 17.02 -0.08 10.92 0.03
ARAT 22.01 -0.53 21.79 -0.83
ARFS 75.0 -1.4 30.0 8.35
ASAT 19.21 0 18.20 0
ASATCSP 18 0 18.0 0
ASFPE 46.43 -0.66 3.7 3.97
ASFPESP 30 0 30 0
ASFS 75.0 -0.03 30 0.04
No faulty state is evaluated at the 0th instance
Faulty state is evaluated at the 9th instance
4.4.2 Heat Recovery Not Working
The heat recovery system recovers heat from return
air and uses it to heat up the supply air. There are
several different heat recovery systems: rotary, flat
plate, run-around loop coil, or return air recirculating
damper. The fault detection mechanism tries to esti-
mate if the heat-recovery system is working properly.
Figure 6 shows the individual explanations for
predictions made by the XGBoost and RandomFor-
est methods, respectively. The observation period
is taken from 20:00 on February 21 until 11:00 on
February 22, 2021, with the faulty state being evalu-
ated at 09:00. Note that the non-operating night hours
were excluded from the dataset. It can be seen that
both methods provide a similar trend picture.
Table 6 shows predictions based on XGBoost and
RandomForest methods and provides quantitative ex-
planations. It contains both measured values and cal-
culated SHAP values. According to the domain ex-
pert, the main contributing features are AAT, AHRS,
AHRST, and ARAT, marked in bold. This is further
confirmed by the corresponding Shapley values. Ob-
serve that the XGBoost method provides results that
better correlate with expert knowledge.
Table 6: Quantitative explanations for XGBoost prediction
of the ‘HR NW’ type of fault.
Feature XGBoost Random Forest
NOT HR NW HR NW NOT HR NW HR NW
Real SHAP Real SHAP SHAP SHAP
AAT 3.85 -3.37 5.45 -0.12 -0.11 -0.02
ACCVO 0.0 0.08 0.0 0.10 0.00 -0.009
AHCT 19.31 -0.03 20.63 0.02 0.00 0.02
AHCVO 0.0 -0.20 49.15 1.59 -0.020 0.26
AHRS 26.46 -1.39 100 0.06 -0.06 0.03
AHRST 14.96 -0.16 5.55 5.85 0.003 0.29
ARAT 22.73 -0.33 21.53 5.85 -0.02 -0.03
ARFS 40.00 -0.57 42.0 1.30 -0.04 0.17
ASAT 18.09 0.04 17.57 0.02 -0.009 0.04
ASATCSP 18.0 0.06 18.5 -0.53 0.01 -0.04
ASFPE 13.22 -0.05 13.63 -0.12 -0.006 -0.005
ASFPESP 14.0 -0.39 14.0 -0.19 -0.006 0.00
ASFS 45.22 0.54 45.64 0.70 0.03 0.02
No faulty state is evaluated at the 0th instance
Faulty state is evaluated at the 9th instance
4.4.3 Heating Coil Valve Leakage
The fault indicates that the heating coil valve is not
closing completely when there is a command to close
it. Regardless of the fact that the valve should be
closed, the hot water flows through the coil and heats
up the supply air. This results in the extra heating cost
and may even lead to the extra cooling costs and unde-
sired supply air temperature. The leak can be detected
by checking the temperature sensors in the supply air
channel or comparing the work of the heat recovery
and cooling coil with other ventilation machines or
this machine’s typical actions.
Figure 5 shows the individual explanations for
predictions based on XGBoost method. The obser-
vation period is taken from 20:30 on February 14
to 10:00 on February 15, 2020, with the fault be-
ICINCO 2022 - 19th International Conference on Informatics in Control, Automation and Robotics
276
0 1 2 3 4 5 6 7 8 9 10 11 12 13
0.0002
0.002
0.014
0.094
0.434
0.85
0.977
0.997
ARFS
ARFPE
f(x)
Figure 3: ‘Fan Pressure Sensor Malfunction’ type of the fault: Simulation results using XGBoost based models with SHAP
explanation method.
0 2 4 6 8 10 12 14 16
0.00036
0.0027
0.0195
0.128
0.5208
0.889
0.983
0.998
0.999
AHRST
AHCVO
AAT
ARAT
AHRST
AAT
99
f(x)
(a) XGBoost
0 2 4 6 8 10 12 14 16
0.457
0.507
0.557
0.606
0.652
0.696
0.736
AHRST
AHRST
AHCVO
AHCVO
ARFS
ASAT
99
f(x)
(b) Random Forest
Figure 4: ‘Heat Recovery not Working’ type of the fault: Simulation results using XGBoost (top plot) and Random Forest
(bottom plot) based models with SHAP explanation method.
ing evaluated at 09:15. Table 7 describes predictions
using only the XGBoost method. According to the
domain expert, the top contributing features include
AAT, AHCVO, AHRST, and ASAT. The top three
corresponding Shapley values confirm these observa-
tions.
4.4.4 Cooling Coil Closed
The problem means that the controller for the venti-
lation unit is not sending a command to use all of the
cooling capacity.
Figure 6 shows the individual explanations for
predictions based on the XGBoost method for the
fault type ‘Cooling Coil Closed’. The time period is
taken from 20:00 to 22:45 on July 15, with the fault
being evaluated at 20:45. Table 8 presents the individ-
ual explanations obtained for predictions generated
using the XGBoost model. According to the domain
expert, ACCVO, AHRST, and ASATCSP are the most
important features that help to explain the fault in this
sample. From the corresponding Shaley values, AC-
CVO has the largest impact on the fault. AHRST
and ASATCSP also have positive effects on the fault
CC
C although they are not among the top three con-
tributing features. For comparison, in the NOT CC C
Table 7: Quantitative explanations for XGBoost prediction
of the ‘AHCV L’ type of fault.
Feature XGBoost
AHCV L NOT AHCV L
Real SHAP Real SHAP
AAT 0.45 5.09 1.27 3.41
ACCVO 0.0 0.0 0.0 0.0
AHCT 19.49 -0.05 19.98 0.15
AHCVO 0.0 1.96 0.0 1.28
AHRS 21.01 1.49 51.64 0.73
AHRST 12.11 1.61 14.88 0.29
ARAT 22.50 -0.01 21.59 0.35
ARFS 40.4 0.17 40.0 -0.08
ASAT 17.959 -0.25 18.84 0.32
ASATCSP 18.0 -0.02 18.0 -0.12
ASFPE 14.03 0.01 12.68 0.12
ASFPESP 14.0 0.34 14.0 0.28
ASFS 44.84 0.75 43.78 -1.85
No faulty state is evaluated at the 0th instance
Faulty state is evaluated at the 8th instance
sample, ACCVO has 0%, which significantly reduces
the total Shapley value for CC C. Parameters AHRST
and ASATCSP also have low effects in this case.
Explainable AI based Fault Detection and Diagnosis System for Air Handling Units
277
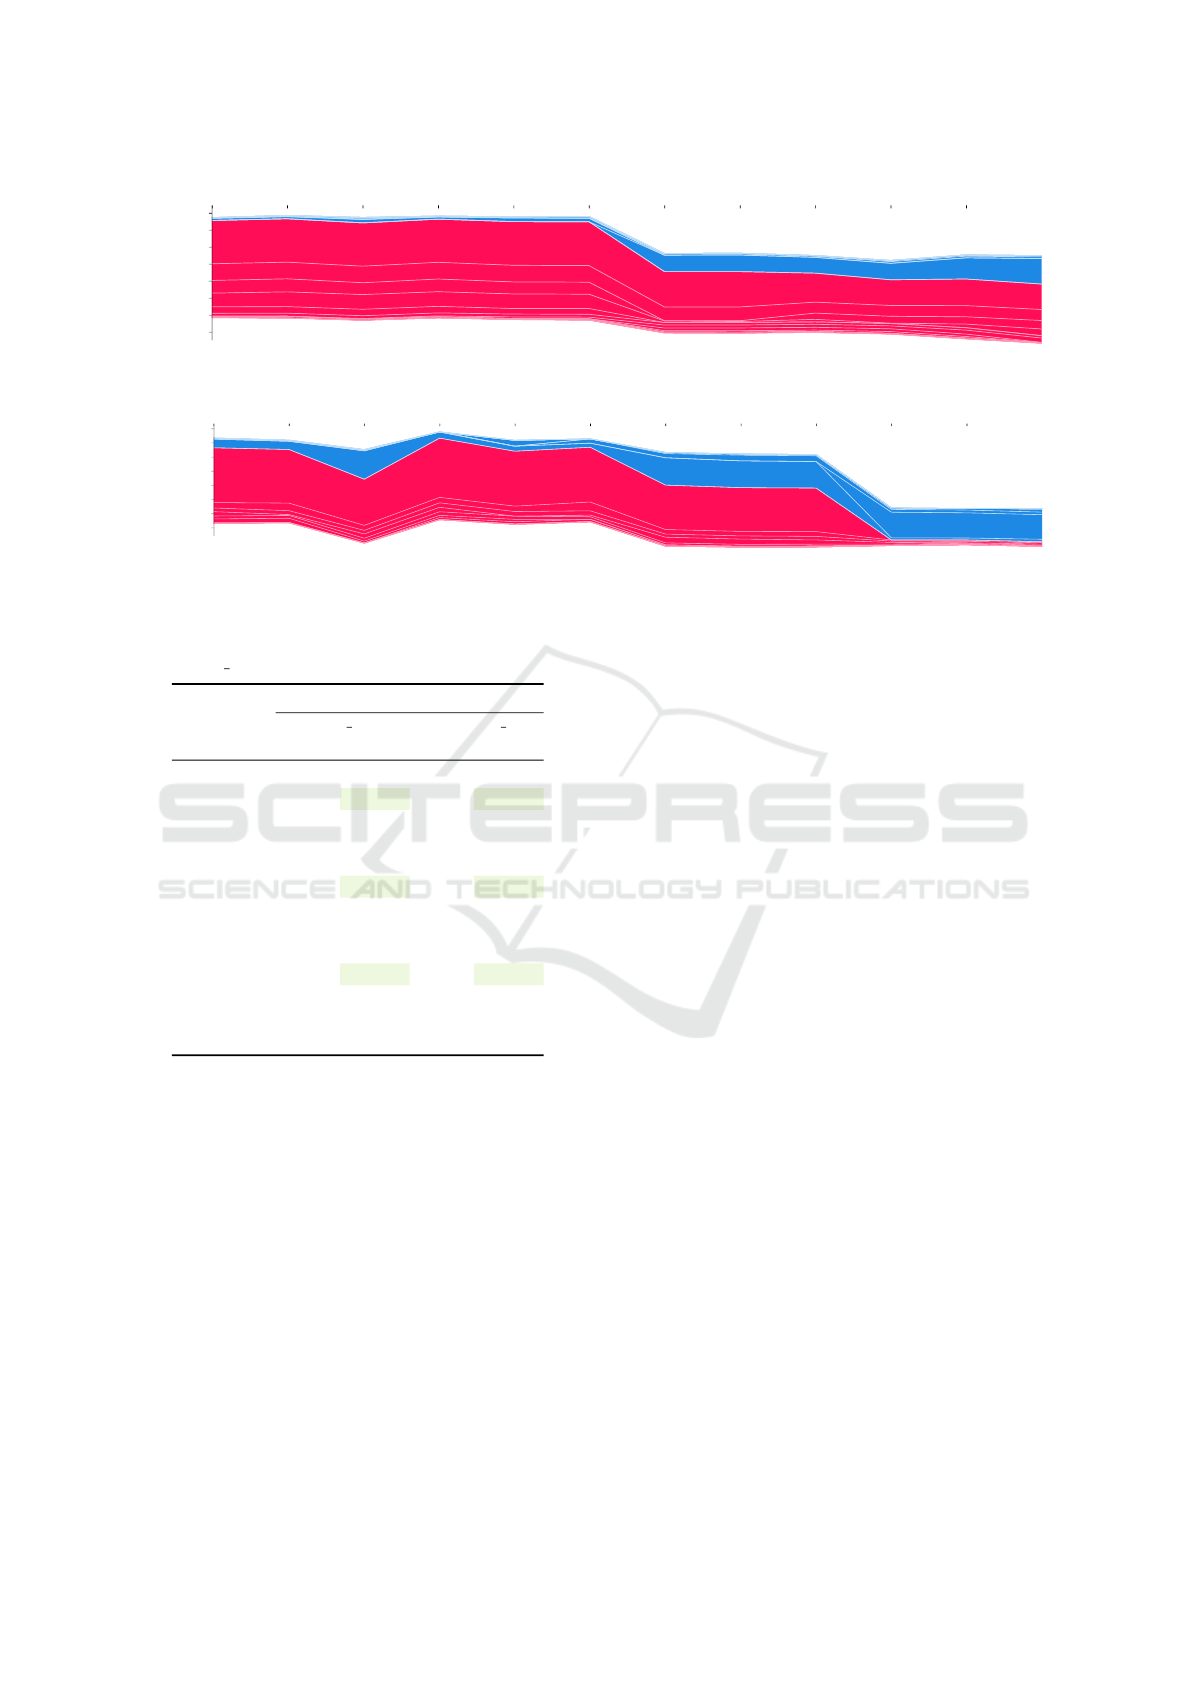
0 1 2 3 4 5 6 7 8 9 10
0.002
0.011
0.075
0.376
0.817
0.971
0.996
0.999
AAT
AAT
AHCVO
AHRST
ASFS
AHRS
f(x)
Figure 5: ‘Heating Coil Valve Leakage’ type of fault: Simulation results using XGBoost model with SHAP explanation
method.
0 1 2 3 4 5 6 7 8 9 10
0.001
0.009
0.06
0.321
0.777
0.963
0.995
0.999
ACCVO
ACCVO
ASAT
ASFS
ARAT
f(x)
Figure 6: ‘Cooling Coil Closed’ type of fault: Simulation results using the XGBoost model with SHAP explanation method.
Table 8: Quantitative explanations for XGBoost prediction
of the ‘CC C’ type of fault.
Feature XGBoost
CC C NOT CC C
Real SHAP Real SHAP
AAT 19.42 -0.11 18.39 -0.20
ACCVO 84.30 7.73 0.0 -3.55
AHCT 20.93 -0.03 20.06 0.04
AHCVO 0.0 0.0 0.0 0.0
AHRS 0.0 0.0 0.0 0.06
AHRST 19.30 0.03 18.21 0.03
ARAT 25.25 0.57 24.48 -0.39
ARFS 40.00 0.41 40.0 0.13
ASAT 18.61 -1.22 18.72 -0.28
ASATCSP 18.0 0.51 18.0 0.19
ASFPE 13.22 0.61 12.54 0.08
ASFPESP 13.0 0.0 13.0 0.0
ASFS 43.44 0.76 43.44 0.192
Faulty state is evaluated at the 0th instance
No faulty state is evaluated at the 10th instance
5 CONCLUSIONS
Advanced machine learning techniques have recently
demonstrated excellent performance in fault detection
and diagnosis problems. Nevertheless, building per-
sonnel may find it hard to evaluate and understand the
reasoning behind the produced outputs. In this way,
we propose a method that uses a XAI technique to
explain the decisions of an XGBoost-based classifier
to the end user in a simple and trustworthy way. The
obtained results are validated by the certified HVAC
engineer. This idea is demonstrated using real data
collected from a commercial building.
ACKNOWLEDGEMENTS
The work has been partly co-financed by Norway
Grants “Green ICT” programme. The work of M.
Meas and J. Belikov was partly supported by the Esto-
nian Research Council grant PRG1463. The work of
A. Tepljakov and E. Petlenkov was partly supported
by the Estonian Research Council grant PRG658. The
work of Y. Levron was partly supported by Israel Sci-
ence Foundation, grant No. 1227/18.
REFERENCES
Abergel, T., Dean, B., Dulac, J., Hamilton, I., and Wheeler,
T. (2018). 2018 Global Status Report - Towards a
zero-emission, efficient and resilient buildings and
construction sector. Technical report, Global Alliance
for Buildings and Construction. [Online] Available
https://www.worldgbc.org/news-media/2018-global-
status-report-towards-zero-emission-efficient-and-
resilient-buildings-and, Accessed January 24, 2022.
Akhlaghi, Y. G., Aslansefat, K., Zhao, X., Sadati, S.,
Badiei, A., Xiao, X., Shittu, S., Fan, Y., and Ma,
X. (2021). Hourly performance forecast of a dew
point cooler using explainable Artificial Intelligence
and evolutionary optimisations by 2050. Applied En-
ergy, 281:116062.
Arjunan, P., Poolla, K., and Miller, C. (2020). En-
ergyStar++: Towards more accurate and explana-
tory building energy benchmarking. Applied Energy,
276:115413.
Barredo Arrieta, A., D
´
ıaz-Rodr
´
ıguez, N., Del Ser, J., Ben-
netot, A., Tabik, S., Barbado, A., Garc
´
ıa, S., Gil-
L
´
opez, S., Molina, D., Benjamins, R., Chatila, R., and
Herrera, F. (2020). Explainable artificial intelligence
(XAI): Concepts, taxonomies, opportunities and chal-
ICINCO 2022 - 19th International Conference on Informatics in Control, Automation and Robotics
278

lenges toward responsible AI. Information Fusion,
58:82–115.
Borlea, I.-D., Precup, R.-E., Borlea, A.-B., and Iercan, D.
(2021). A unified form of fuzzy C-means and K-
means algorithms and its partitional implementation.
Knowledge-Based Systems, 214:106731.
Chakraborty, D., Alam, A., Chaudhuri, S., Bas¸a
˘
gao
˘
glu, H.,
Sulbaran, T., and Langar, S. (2021). Scenario-based
prediction of climate change impacts on building cool-
ing energy consumption with explainable artificial in-
telligence. Applied Energy, 291:116807.
Chen, T. and Guestrin, C. (2016). XGBoost: A scalable
tree boosting system. In Proceedings of the 22nd
ACM SIGKDD International Conference on Knowl-
edge Discovery and Data Mining, pages 785–794.
Du, Z., Fan, B., Jin, X., and Chi, J. (2014). Fault detection
and diagnosis for buildings and HVAC systems using
combined neural networks and subtractive clustering
analysis. Building and Environment, 73:1–11.
Du, Z. and Jin, X. (2008). Multiple faults diagnosis for
sensors in air handling unit using Fisher discrimi-
nant analysis. Energy Conversion and Management,
49(12):3654–3665.
Fan, C., Xiao, F., Yan, C., Liu, C., Li, Z., and Wang, J.
(2019). A novel methodology to explain and evalu-
ate data-driven building energy performance models
based on interpretable machine learning. Applied En-
ergy, 235:1551–1560.
Gao, Y. and Ruan, Y. (2021). Interpretable deep learn-
ing model for building energy consumption prediction
based on attention mechanism. Energy and Buildings,
252:111379.
Gunning, D. (2017). Explainable artificial intelligence
(XAI). Technical report, Defense Advanced
Research Projects Agency. [Online] Avail-
able https://www.darpa.mil/program/explainable-
artificial-intelligence, Accessed January 27, 2022.
Han, H., Gu, B., Hong, Y., and Kang, J. (2011). Automated
FDD of multiple-simultaneous faults (MSF) and the
application to building chillers. Energy and Buildings,
43(9):2524–2532.
Houz
´
e,
´
E., Dessalles, J.-L., Diaconescu, A., Menga, D., and
Schumann, M. (2021). A decentralized explanatory
system for intelligent cyber-physical systems. In Lec-
ture Notes in Networks and Systems, pages 719–738.
Springer International Publishing.
Hripcsak, G. and Rothschild, A. S. (2005). Agreement,
the F-measure, and reliability in information retrieval.
Journal of the American Medical Informatics Associ-
ation, 12(3):296–298.
Li, G., Yao, Q., Fan, C., Zhou, C., Wu, G., Zhou, Z., and
Fang, X. (2021a). An explainable one-dimensional
convolutional neural networks based fault diagnosis
method for building heating, ventilation and air con-
ditioning systems. Building and Environment, page
108057.
Li, G., Yao, Q., Fan, C., Zhou, C., Wu, G., Zhou, Z., and
Fang, X. (2021b). An explainable one-dimensional
convolutional neural networks based fault diagno-
sis method for building heating, ventilation and air
conditioning systems. Building and Environment,
203:108057.
Liao, H., Cai, W., Cheng, F., Dubey, S., and Rajesh, P. B.
(2021). An online data-driven fault diagnosis method
for air handling units by rule and convolutional neural
networks. Sensors, 21(13):4358.
Lundberg, S. M. and Lee, S.-I. (2017). A unified approach
to interpreting model predictions. Advances in Neural
Information Processing Systems, 30.
Machlev, R., Heistrene, L., Perl, M., Levy, K. Y., Belikov,
J., Mannor, S., and Levron, Y. (2022). Explainable
artificial intelligence (XAI) techniques for energy and
power systems: review, challenges and opportunities.
Energy and AI, 9:100169.
Machlev, R., Perl, M., Belikov, J., Levy, K. Y., and Lev-
ron, Y. (2021). Measuring explainability and trustwor-
thiness of power quality disturbances classifiers using
explainable artificial intelligence (XAI). IEEE Trans-
actions on Industrial Informatics.
Madhikermi, M., Malhi, A. K., and Fr
¨
amling, K. (2019).
Explainable artificial intelligence based heat recycler
fault detection in air handling unit. In Lecture Notes
in Computer Science, pages 110–125. Springer Inter-
national Publishing.
Miller, C. (2019). What’s in the box?! Towards explainable
machine learning applied to non-residential building
smart meter classification. Energy and Buildings,
199:523–536.
Mirnaghi, M. S. and Haghighat, F. (2020). Fault detection
and diagnosis of large-scale HVAC systems in build-
ings using data-driven methods: A comprehensive re-
view. Energy and Buildings, page 110492.
Srinivasan, S., Arjunan, P., Jin, B., Sangiovanni-Vincentelli,
A. L., Sultan, Z., and Poolla, K. (2021). Explainable
AI for chiller fault-detection systems: Gaining human
trust. Computer, 54(10):60–68.
Tsoka, T., Ye, X., Chen, Y., Gong, D., and Xia, X.
(2021). Building energy performance certificate la-
belling classification based on explainable artificial in-
telligence. In Neural Computing for Advanced Appli-
cations, pages 181–196. Springer Singapore.
Upadhyay, P. K. and Nagpal, C. (2020). Wavelet based per-
formance analysis of SVM and RBF kernel for classi-
fying stress conditions of sleep EEG. SCIENCE AND
TECHNOLOGY, 23(3):292–310.
Wang, S. and Xiao, F. (2004). AHU sensor fault diagnosis
using principal component analysis method. Energy
and Buildings, 36(2):147–160.
Wenninger, S., Kaymakci, C., and Wiethe, C. (2022). Ex-
plainable long-term building energy consumption pre-
diction using QLattice. Applied Energy, 308:118300.
Xiao, F. and Wang, S. (2009). Progress and methodolo-
gies of lifecycle commissioning of HVAC systems to
enhance building sustainability. Renewable and Sus-
tainable Energy Reviews, 13(5):1144–1149.
Explainable AI based Fault Detection and Diagnosis System for Air Handling Units
279
