
Efficient Hybrid Model for Intrusion Detection Systems
Nesrine Kaaniche
1
, Aymen Boudguiga
2
and Gustavo Gonzalez-Granadillo
3
1
SAMOVAR, Telecom SudParis, Institut Polytechnique de Paris, France
2
Universit
´
e Paris-Saclay, CEA-List, Palaiseau, France
3
Atos Research & Innovation, Cybersecurity Laboratory, Spain
Keywords:
IDS, K-Means, Bayesian Model, Hybrid Approach, Supervised and Unsupervised Learning.
Abstract:
This paper proposes a new hybrid ML model that relies on K-Means clustering and the Variational Bayesian
Gaussian Mixture models to efficiently detect and classify unknown network attacks. The proposed model first
classifies the input data into various clusters using K-Means. Then, it identifies anomalies in those clusters
using the Variational Bayesian Gaussian Mixture model. The model has been tested against the CICIDS 2017
dataset that contains new relevant attacks and realistic normal traffic, with a reasonable size. To balance the
data, undersampling techniques were used. Furthermore, the features were reduced from 78 to 28 using feature
selection and feature extraction methods. The proposed model shows promising results when identifying
whether a data point is an attack or not with an F1 score of up to 91%.
1 INTRODUCTION
During the past decade, Machine Learning (ML) tech-
nologies have gained an expanding interest, enabling
automation, accurate predictions and classification re-
sults from complex models, that are made possible
and more efficient thanks to advanced processing re-
sources (Zhavoronkov et al., 2018). From this per-
spective, various research works started to investigate
the implementation of ML for diverse tasks such as
malware analysis, intrusion detection, log analysis,
threat classification, etc., in order to enhance the secu-
rity by design principle in next-generation networks.
The intersection between ML and cybersecurity has
been studied for more than three decades, and both
domains are recently experiencing a blooming stage
due to the increasing deployment of next-generation
networks in the society. ML, on the one hand, of-
fers important capabilities to analyse threats and at-
tacks in various network systems, enabling compre-
hensive and in-depth defense strategies. However,
ML algorithms are raising several questions regard-
ing their effectiveness in real-world scenarios. For
instance, the lack of interpretability of many learn-
ing models makes it hard to develop defensive mech-
anisms against sophisticated attacks.
Cybersecurity, on the other hand, provides the means
to protect data from intrusions or attacks that usually
lead to high economic losses, personal information
leaks and reduced quality and productivity of organ-
isations. Intrusion Detection Systems (IDSs) are ef-
ficient counter-measures for detecting inappropriate
use of host machines or networks and providing in-
formation security. IDSs monitor and analyse events
to detect any deviations from a regular behaviour.
Several machine learning methods have been im-
plemented to decrease the false positive rate of
anomaly-based IDSs, including Extreme Learning
Machine (ELM) (Singh et al., 2015) and Support Vec-
tor Machine (SVM) (Feng et al., 2014; ?; ?). How-
ever, most of these approaches only use supervised
learning algorithms that strongly rely on the accurate
labeling of the training dataset and are tested against
outdated datasets.
This paper investigates the application of ML al-
gorithms in Intrusion Detection Systems (IDSs) and
provides a detailed evaluation of existing ML meth-
ods and their applications to different network sys-
tems. It proposes a new ML-based IDS model that
relies on a hybrid approach that uses supervised and
unsupervised algorithms to efficiently detect complex
and sophisticated attacks (e.g., known and unknown).
The proposed model first classifies the input data
into various clusters using K-Means. Then, it iden-
tifies anomalies in those clusters using the Variational
Bayesian Gaussian Mixture model. Conducted exper-
iments show promising results reaching 91% of F1-
scores in the supervised classification and up to 86%
in the unsupervised classification.
The remainder of this paper is as follows. Section 2
describes the proposed model and discusses the core
processing blocks. Section 3 details our methodol-
694
Kaaniche, N., Boudguiga, A. and Gonzalez-Granadillo, G.
Efficient Hybrid Model for Intrusion Detection Systems.
DOI: 10.5220/0011328300003283
In Proceedings of the 19th International Conference on Security and Cryptography (SECRYPT 2022), pages 694-700
ISBN: 978-989-758-590-6; ISSN: 2184-7711
Copyright
c
2022 by SCITEPRESS – Science and Technology Publications, Lda. All rights reserved
ogy, including selected data-sets, different types of
data pre-processing and selection techniques. Sec-
tion 4 presents preliminary experimental results, be-
fore concluding in Section 5.
2 PROPOSED SOLUTION:
HYBRID AI-BASED MODEL
FOR IDS
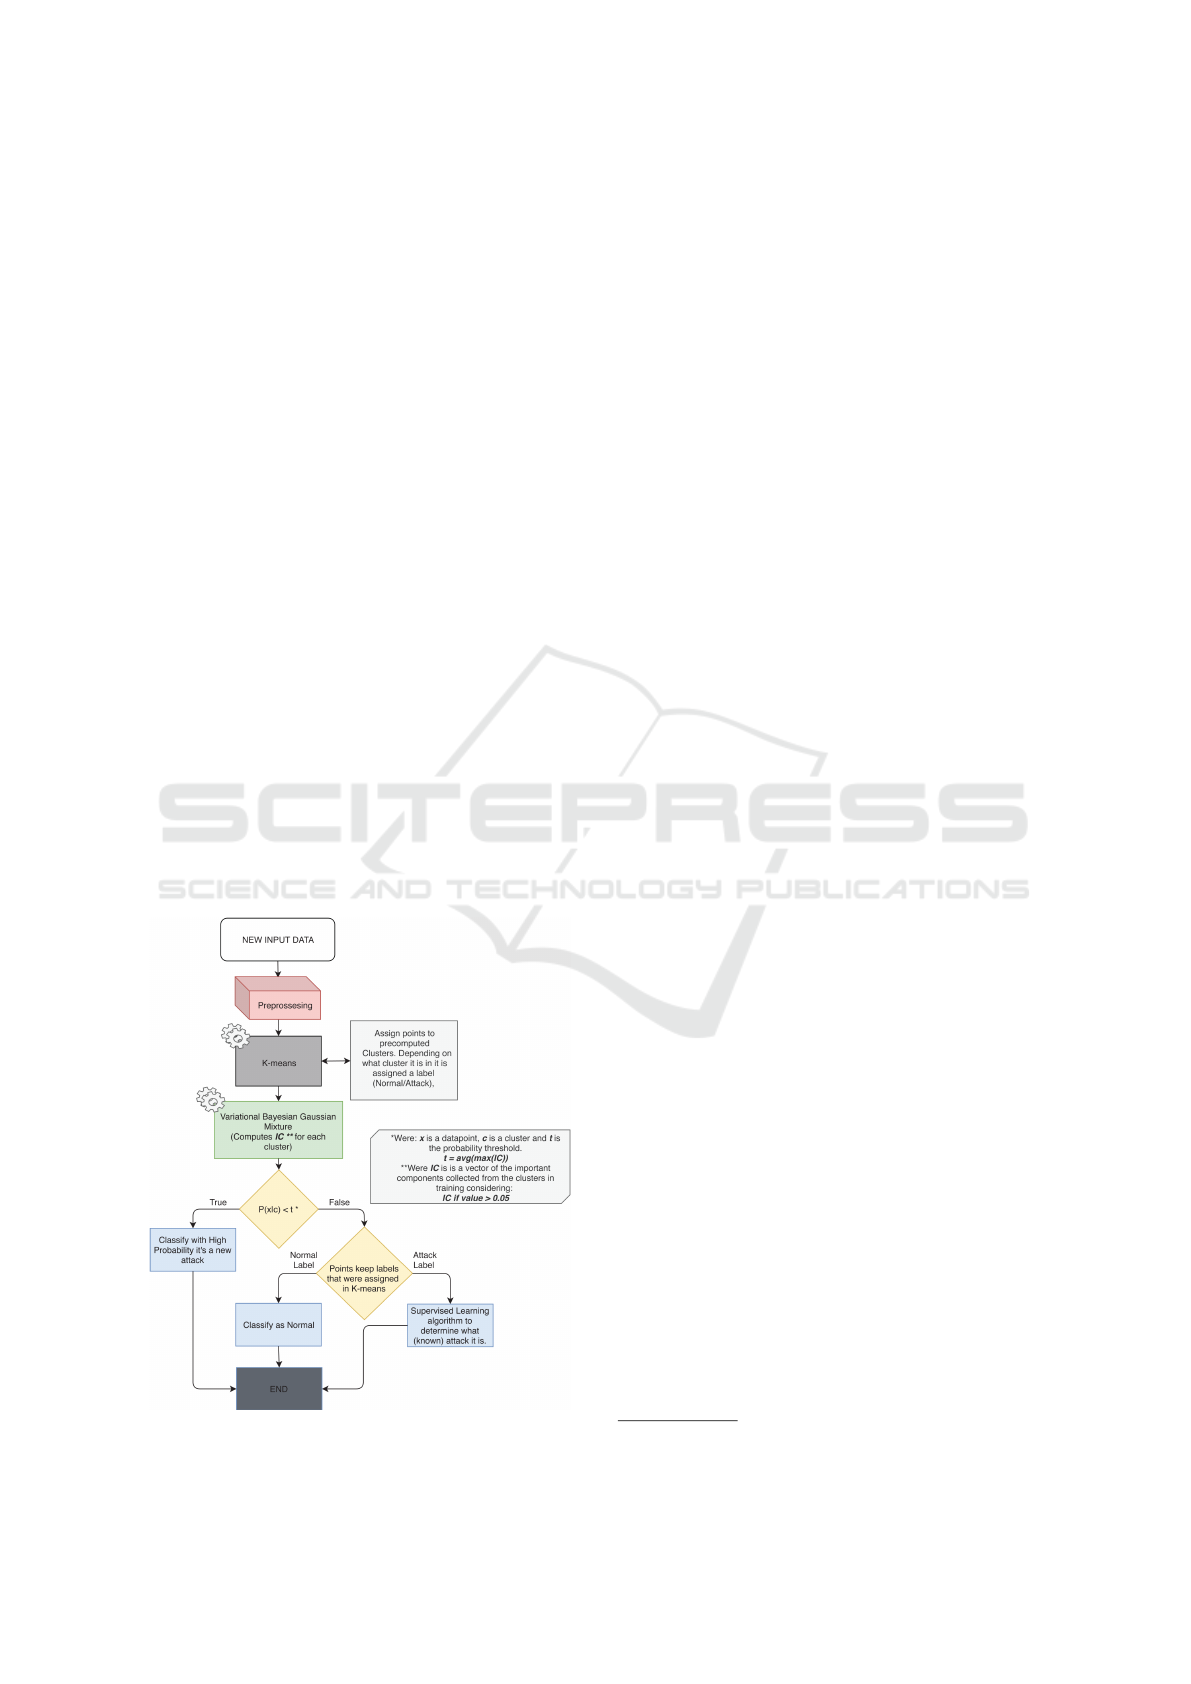
The proposed solution introduces a novel ML based
IDS model that relies on a combination between su-
pervised and unsupervised learning in order to effi-
ciently detect complex and sophisticated attacks, as
depicted in Figure 1. Indeed, an unsupervised clus-
tering algorithm, i.e., K-means, will first separate
into clusters normal and abnormal behaviours. K-
means is chosen because it ensures a low computa-
tion overhead. Second, the identified clusters will
be labelled, by considering the location of the major-
ity of the points in each cluster. Then, the bound-
ary’s/thresholds for each of those datasets will be
set using the Variational Bayesian Gaussian Mixture
model. All of the points that have a probability of
belonging to a cluster smaller than the threshold will
be classified as potential new and unknown attacks.
Finally,all the points clustered as attacks by K-means
will be processed using a supervised algorithm to be
classified into different attacks. data that are classified
as normal by K-Means will keep this classification.
Figure 1: High Level Description of Proposed Method.
2.1 Training
After the preprocessing, the data goes through the K-
Means algorithm which separates all the data points
into clusters. Then, these clusters are labelled with
respect to the majority of the classes they are com-
promised from (i.e., Normal or Attack). Next, the
Variational Bayesian Gaussian Mixture method, as
depicted in Figure 1, disregards non-important clus-
ters by giving them a weight close to zero and so not
all clusters will be considered. Note that a threshold
can be set to select only significant clusters. Given
that the limit is set, a vector will be returned by the
model containing all the important components IC for
each point in a cluster. Lastly for each of the clusters a
threshold is computed as t = avg(max(IC), where IC
is the important components vector and the resulting t
is the probability threshold for one cluster. Once these
thresholds for all clusters are set the training phase is
over.
2.2 Prediction
After preprocessing, the prediction data are given as
inputs to the K-Means algorithm. As such, the data
points will be assigned to their respected clusters. Just
like in training, these clusters will be passed on to the
Variational Bayesian Gaussian Mixture which will re-
turn the important components of each point. Then
the max(IC) for each point of the cluster will be calcu-
lated. It corresponds to the probability that the point
belongs really to the cluster assigned by the K-Means.
This probability is formulated as P(x|c) = max(IC),
where x is a data point, c is a cluster and IC is the im-
portant components vector of that datapoint. Lastly,
once this is calculated the following expression will
be executed to see if the point belongs to the cluster,
P(x|c) < t. That is, if the probability that the point
belongs to the given cluster assigned by K-means is
lower than the threshold for that cluster which was
set in the training phase, then it will be classified as
new/unknown attack.
3 VALIDATION METHODOLOGY
3.1 Selected Datasets
Two publicly available datasets for intrusion detection
systems have been studied and compared: (i) NSL-
KDD
1
thanks to its large use in previous works for
1
https://www.unb.ca/cic/datasets/nsl.html
Efficient Hybrid Model for Intrusion Detection Systems
695

fair comparison with other works; and (ii) CICIDS-
2017
2
one of the newest publicly available datasets.
CICIDS is more interesting than NSL-KDD as it con-
tains samples inspired from real world examples, and
it covers all criteria for building a reliable benchmark
dataset as described by Gharib et al. (Gharib et al.,
2016).
The NSL-KDD dataset is a modified version of
the KDD CUP 99 dataset. It claims to solve some
of the core problems of the of the previously widely
used KDD CUP 99 dataset by removing the redundant
records. As such, the classifiers will not be biased to-
wards more frequent records. Attacks in this dataset
fall into 4 distinct categories: Denial of Service At-
tack (DoS), User to Root Attack (U2R), Remote to
Local Attack (R2L), and Probing Attack (Probe).
The CICIDS-2017 consists of 14 different attacks
grouped into 9 categories: Brute Force FTP, Brute
Force SSH, DoS, Heartbleed, Web Attack, Infiltra-
tion, PortScan, Botnet and DDoS. All of which are
realistic and very common attacks. In addition it con-
sists of 80 features, extracted using the CICFlowMe-
ter
3
. Moreover, this dataset was built with the top
priority of generating realistic background traffic.
This was achieved using a proposed B-Profile system
(Sharafaldin et al., 2018) profiling human interaction
abstract behaviour and generating naturalistic, benign
background traffic.
3.2 Imbalanced Datasets
The NSL-KDD dataset is class balanced with 52 per-
cent of normal labels and 48 percent of attack labels.
However, the distribution of attacks in the 4 categories
is uneven, with DoS attacks having the biggest weight
in the dataset and the U2R attack count being very
small. This can potentially bias the model. To fix
this issue, it is recommended to add new attack labels
in the dataset to balance it better, since a resampling
technique would result in redundant records.
The distribution of the normal and attack labels in
the CICIDS-2017 dataset is uneven with 80 percent
of normal labels vs 20 percent of attack labels. Even
though the dataset is imbalanced, it is more realistic,
since in the real world, we do not get as many in-
stances of attacks as we get of normal network traffic.
For these experiments, we used a random undersam-
pling technique to balance this large dataset.
2
https://www.unb.ca/cic/datasets/ids-2017.html
3
https://pypi.org/project/cicflowmeter/
3.3 Classification Algorithms
The first algorithm of our proposed approach deals
with unsupervised learning problem. In this case,
K-means seems to be the best fit thanks to its sim-
plicity and speed at which the predictions are gener-
ated. It is crucial to have a fast prediction time when
implementing intrusion detection systems. Further-
more, algorithms like Density-Based Spatial Cluster-
ing of Applications with Noise (DBSCAN) tend to
leave outliers out of the clusters and this is not op-
timal for these kind of systems since those outliers
could be a minority of attacks. The second algorithm
of our proposed approach is used to detect anoma-
lies in clusters. The Variational Bayesian Gaussian
Mixture is the selected algorithm because there is a
smaller chance to end up in a local minimum con-
sidering that we only need to specify the maximum
number of clusters to build the model, the algorithm
will then find the actual number of clusters and set
the weight of non-relevant clusters very close to zero
(Nasios and Bors, 2006).
3.4 Performance Metrics
This section describes our evaluation metrics:
• Accuracy: It refers to the ratio of correctly pre-
dicted observations divided by the number of all
observations, as Accuracy =
T P+T N
T P+T N+FP+FN
• Precision: It refers to the ratio of positively
predicted observations divided by the total posi-
tive observations predicted as Precision =
T P
T P+FP
.
High precision refers to the small false positive
rate.
• Recall: It refers to the proportion of correctly
predicted positive observations divided by all ob-
servations in a positive class, as Recall =
T P
T P+FN
.
• F1 Score: It refers to the weighted average of
Precision and Recall, as F1 =
2·precision·recall
precision+recall
. This
rating brings into consideration both false posi-
tives and false negatives. F1 Score is the most
suitable metric to find an equilibrium between
Precision and Recall in a problem with irregular
distribution.
3.5 Implementation
The proposed model is implemented using Python.
The main libraries used for this model includes
pandas
4
, and Scikit-Learn
5
. As depicted in Fig-
ure 2, the initial step in the implementation process
4
https://pandas.pydata.org/
5
https://scikit-learn.org/stable/
SECRYPT 2022 - 19th International Conference on Security and Cryptography
696
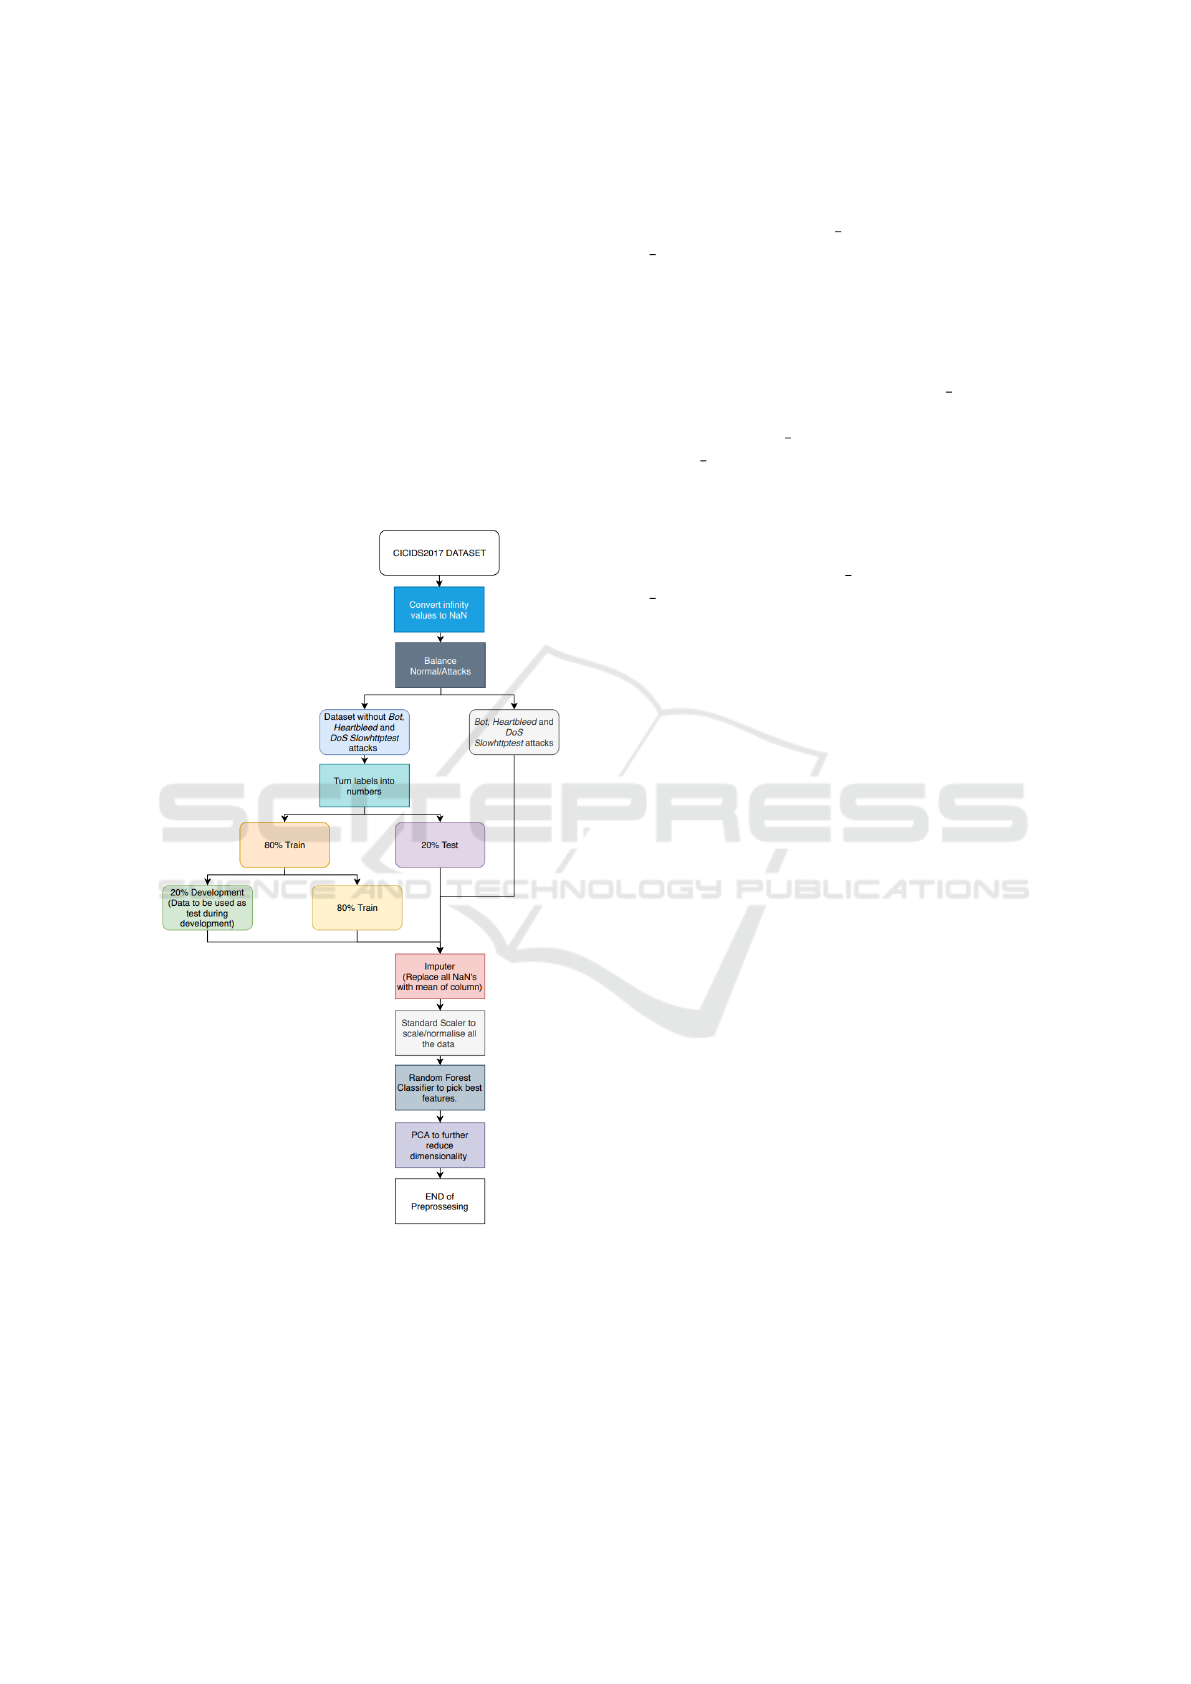
is to import the data. For this implementation, we
have selected the CICIDS 2017 dataset, which has
been preprocessed, cleaned and balanced before split-
ting it in two main groups: (i) instances containing
only normal activities, and instances containing at-
tacks (e.g., Bot, Heartnleed, DoS Slowhttptest). 80%
of the dataset has been used for training and the re-
mainging 20% were used for testing. The training
dataset is further split into two subsets: (i) the train-
ing subset, containing 80% of the selected training in-
stances, (ii) the validation subset, containing 20% of
the selected training instances. The validation serves
to evaluate the model with different configurations
during pre-production.
Figure 2: Preprocessing flowchart.
Once the dataset is split, all NaN values were re-
placed by the mean values of each column. Af-
ter this process, data standardisation was performed
by using the StandardScaler process from the
Scikit-Learn library. Next step is feature selec-
tion. To carry out this task, the random forest
classifier from the Scikit-Learn library was
used. It was trained with the train dataset and with
the hyperparameters of n estimators = 100 and
max depth = 2 all the others were set to default. For
the test set, only 49 out of the total of 78 features
are considered as important. Therefore, all the fea-
tures were chosen to build the models. As a fea-
ture extraction method, Principal Component Anal-
ysis (PCA) was used to fit the training data to avoid
bias. The hyperparameters used were: n componets
= number of features (49 as taken from the fea-
ture selection), svd solver = ’randomized’ and
iterated power = 30. The last step in the prepross-
esing is to decide how many of PCA components are
kept by computing and plotting the PCA variances for
all clusters. Considering that after 28 features, the
variances do not change, the hyperparameters chosen
for the PCA algorithm are n components = 28, and
max iter = 200.
The implementation of our proposed model con-
siders implementing K-Means and the Variational
Bayesian Gaussian Mixture algorithms.
3.5.1 K-Means
During K-Means implementation for clustering data,
we tried two methods for fixing the cluster numbers
(i) the elbow method and (ii) the cross validation with
PCA using the development dataset so that the inertia
converges. Inertia is the sum of squared distances of
samples to their closest cluster centre. Unfortunately,
when testing with the development set none of them
yielded high accuracy results. Therefore, we tested all
the accuracy’s on the training and development tests
starting with 2 clusters until reaching 50 clusters. We
then picked the number of clusters with the highest
accuracy. As shown in Figure 3, 46 clusters provide
the highest accuracy level (i.e., 91% of accuracy). All
the tests are done in 200 iterations. It is worth not-
ing that both development and train sets have almost
equal accuracy levels.
To calculate the accuracy of the model, the num-
ber of points belonging to each label (Normal or At-
tack), was measured and the cluster was assigned the
label of the class it had the majority of samples in,
since we actually had labelled data.
3.5.2 Variational Bayesian Gaussian Mixture
Bayesian Gaussian Mixture models were used to cal-
culate the probability of a point belonging to the clus-
ter. As stated in the aforementioned sections, the al-
gorithm returns the probability of a point belonging to
any of the clusters, these numbers are called compo-
nents. Since they are probabilities, their sum is one,
this means for this approach to work we must take
Efficient Hybrid Model for Intrusion Detection Systems
697

Figure 3: K-Means accuracy plot.
a look at only the important components. We set a
threshold to 0.05 after testing with the train and vali-
dation sets. The algorithm takes only the components
that are equal to or bigger than the threshold for each
of the training clusters. Then, the validation set is
used to predict the probability of the points belong-
ing to each of those clusters. Once done, only the
biggest of those components is taken for each point
in the cluster and as a last step they are averaged (as
discussed in section 2.1).
4 IMPLEMENTATION RESULTS
4.1 Clusters’ Visualization
Figure 4(a) depicts the actual clusters with the real
labels of the test data that are used for evaluation pro-
poses. Let us recall that a model is considered as per-
fect if it is able to predict exact same clusters. Fig-
ure 4(b) shows the clusters that are predicted through
the different conducted experiments. We note that the
test set does not contain any new attacks. If we look
closely at Figure 4, we notice that there exist some
minor points which are wrongly classified.
In order to evaluate the classification capabilities
of the proposed methodology, we considered a single
set composed by the concatenation of the test set and
the set of new attacks, as shown in Figure 4(c). The
resulting clusters belong to both known and unknown
attacks. We note that in Figure 4(c), there is a whole
new ”line” in purple. The data points in this line be-
long to the new attacks that were not present during
the training of the model. These are the data points
that our solution aims at detecting and classifying.
4.2 Evaluation Results
This section details the evaluation results of the pro-
posed model with different configurations and dis-
cusses the computation overheads.
(a) Real Clusters (b) Predicted Clusters
(c) Predicted Clusters with New At-
tacks
Figure 4: Real vs Predicted Clusters.
Table 1: Normal / Attack Detection with 45 and 46 Clusters
Evaluation Results.
No of Clusters 45 46
F1 score 89% 91%
Recall 94% 95%
Precision 85% 88%
Accuracy 89% 91%
4.2.1 Evaluation with 46 Clusters
The first configuration considers 46 clusters. It was
evaluated with respect to the selected metrics, as de-
tailed in section 3.4. For the K-Means algorithm, we
used the test set, to estimate the number of both at-
tacks and normal data points that are correctly pre-
dicted. The F1 score was 0.91% while the Recall
score 0.95%. Furthermore, the precision score was
0.88% and the accuracy score was 0.91% as shown in
Table 1.
To evaluate the capacity of the Variational
Bayesian Gaussian Mixture for efficiently detecting
new attacks, we first implemented the prediction
pipeline with the test set. Then, we assessed the
pipeline algorithms using the attacks’ dataset. Af-
terwards, both predictions are concatenated into one
data-frame and evaluated. This concatenation permits
to identify the real labels and evaluate the results ac-
cordingly, since all of the datapoints in the unknown
attacks should be set to unknown and all the data-
points in the test set to known. The results of this
evaluation are depicted in 5(a). The results are shown
in a normalised confusion matrix in order to provide
human-centric accurate results. From Figure 5(a), we
deduce that the results of our evaluation with 46 clus-
ters are fairly good, 62% of the unknown labels are
correctly predicted.
SECRYPT 2022 - 19th International Conference on Security and Cryptography
698

(a) Confusion matrix (46 clusters) (b) Confusion matrix (45 clusters)
Figure 5: Comparison of Confusion Matrix results obtained
for the different clusters.
4.2.2 Evaluation with 45 Clusters
As detailed in section 4.2.1, we conduct the same
evaluation pipeline while considering 45 clusters, in
order to assess their impacts on the prediction ac-
curacy. In fact, we assumed that the obtained re-
sults with 46, even though considered as good, may
be improved. For this purpose, we conduced a trial
with less clusters and evaluated the different metrics.
This second configuration, i.e., 45 clusters resulted
in an improved accuracy in predicting unknown at-
tacks compared to the first setting. However, it neg-
atively impacted the evaluation of K-Means. The F1
score dropped down to 0.89% and the Recall score
to 0.94%. Furthermore, the Precision score stepped
down to 0.85% and the total accuracy score to 0.89%.
4.3 Discussion
Figure 4(a) presents a common illustration of the real
attack and normal clusters. It is difficult to distinguish
one cluster from the other one since they are merged.
This is mainly due to the close behaviour between a
normal and an attack event. In our conducted experi-
ments, two configurations are evaluated, one using 45
and another using 46 clusters. This latter showed bet-
ter results using the validation dataset, thanks to the
similar behaviour of normal and attack events. Given
that, the selected criteria to identify if a cluster is nor-
mal or malicious is the class of the majority of events,
a higher number of clusters broke down the events in
a way that could improve the classification accuracy
of the clusters.
The number of clusters to use resolves the trade-
off between the accuracy to detect normal/attack
events and the good performance of the model to
classify known/unknown ones. Thus, based on
each setting’s requirements, i.e., to classify or detect
known/unknown attacks, our results showed that it is
more convenient to use the model with 45 clusters for
classification and 46 clusters for detection. Moreover,
in both cases, the accuracy to classify normal/attack
events is still high (at least 89%).
The precision and recall scores for the model us-
ing 45 clusters are fairly high. The precision met-
ric indicates that 85% of the events classified by the
model as attacks, are correct, meaning that the model
has a small false positive rate. The recall metric indi-
cates that 94% of the real attacks are correctly pre-
dicted. The F1 score (or the weighted average of
precision and recall) was equal to 89%. This metric
shows that the general detection rate of the combined
models is good. The confusion matrix is helpful to
analyse the known/unknown predictions of the mod-
els. The model using 45 clusters was the best model
since only 0.1% percent of the known events were
misclassified as unknown, and only 0.14% of the un-
known events were misclassified as known.
The model using 46 clusters obtained the same re-
sults as the model using 45 clusters when predicting
the known events. This shows that the difficulty in the
model lies in detecting the unknown attacks. Using 46
clusters, the model misclassified 38% of the unknown
events, which are 24% more than the model using 45
clusters.
5 CONCLUSION
This paper presented a hybrid approach to tackle the
problem of implementing intrusion detection systems
using machine learning models. The CICIDS 2017
dataset has been chosen, since it contains new relevant
attacks and realistic normal traffic, with a reasonable
size. The normal and attack data points were unbal-
anced, to balance the data undersampling technique
was used.
The highest performance for the K-Means clus-
tering was obtained with 46 clusters. The F1 score
was 0.91% while the Recall score 0.95% the Precision
score was 0.88% and the Accuracy score was 0.91%.
The highest performance for the Variational Bayesian
Gaussian Mixture model was obtained with 45 clus-
ters at 90% of the known attacks predicted as known
and 86% of the unknown predicted as unknown.
Future work will concentrate on evaluating other
ML models and integrating the proposed solution
into a SIEM system in a dynamic setting. This will
demonstrate the versatility of the proposed method-
ology in ever-evolving environments. In addition,
we will investigate the use of fully homomorphic
encryption as discussed by (Sgaglione et al., 2019;
Boudguiga et al., 2020) to make the intrusion detec-
tion more privacy-preserving. However, using homo-
morphic encryption will require the adaptation of the
used models and may result in a loss of accuracy.
Efficient Hybrid Model for Intrusion Detection Systems
699

ACKNOWLEDGEMENTS
We acknowledge the financial support from the Euro-
pean Commission (H2020 IMPETUS project, under
grant agreement 883286 ), and the SAMOVAR labo-
ratory of T
´
el
´
ecom SudParis.
REFERENCES
Boudguiga, A., Stan, O., Sedjelmaci, H., and Carpov, S.
(2020). Homomorphic encryption at work for pri-
vate analysis of security logs. In Furnell, S., Mori,
P., Weippl, E. R., and Camp, O., editors, Proceed-
ings of the 6th International Conference on Informa-
tion Systems Security and Privacy, ICISSP 2020, Val-
letta, Malta, February 25-27, 2020, pages 515–523.
SCITEPRESS.
Feng, W., Zhang, Q., Hu, G., and Huang, J. X. (2014). Min-
ing network data for intrusion detection through com-
bining svms with ant colony networks. Future Gener-
ation Computer Systems, 37:127–140.
Gharib, A., Sharafaldin, I., Lashkari, A. H., and Ghorbani,
A. A. (2016). An evaluation framework for intrusion
detection dataset. In 2016 International Conference
on Information Science and Security (ICISS), pages
1–6. IEEE.
Gonzalez-Granadillo, G., Diaz, R., Medeiros, I., Gonzalez-
Zarzosa, S., and Machnicki, D. (2019). Lads: A live
anomaly detection system based on machine learning
methods. In Conferene on Security and Cryptography.
Nasios, N. and Bors, A. G. (2006). Variational learning
for gaussian mixture models. IEEE Transactions on
Systems, Man, and Cybernetics, Part B (Cybernetics),
36(4):849–862.
Sgaglione, L., Coppolino, L., D’Antonio, S., Mazzeo, G.,
Romano, L., Cotroneo, D., and Scognamiglio, A.
(2019). Privacy preserving intrusion detection via
homomorphic encryption. In 2019 IEEE 28th Inter-
national Conference on Enabling Technologies: In-
frastructure for Collaborative Enterprises (WETICE),
pages 321–326.
Sharafaldin, I., Lashkari, A. H., and Ghorbani, A. A.
(2018). Toward generating a new intrusion detec-
tion dataset and intrusion traffic characterization. In
ICISSP, pages 108–116.
Singh, R., Kumar, H., and Singla, R. (2015). An intrusion
detection system using network traffic profiling and
online sequential extreme learning machine. Expert
Systems with Applications, 42(22):8609–8624.
Zhavoronkov, A., Mamoshina, P., Vanhaelen, Q., Scheibye-
Knudsen, M., Moskalev, A., and Aliper, A. (2018).
Artificial intelligence for aging and longevity re-
search: Recent advances and perspectives. Ageing re-
search reviews.
SECRYPT 2022 - 19th International Conference on Security and Cryptography
700
