
Monte Carlo Simulation of Pathogen Reduced Platelet Production
John T. Blake
1,2 a
and Ken McTaggart
2
1
Department of Industrial Engineering, Dalhousie University, Halifax, Nova Scotia, Canada
2
Centre for Innovation, Canadian Blood Services, Ottawa, Ontario, Canada
Keywords: Monte Carlo Simulation, Platelet Production, Pathogen Reduction Technology, Integer Programming.
Abstract: All blood products in Canada undergo testing for transmissible diseases and bacterial contamination. As a
result, the risk of a transfusion related infection is estimated at less than 1 in 47,000. Nevertheless, there are
infectious agents that are not screened for, as well as the potential for infection from emerging pathogens that
are either unknown, or for which screening tests have not been developed. Thus, Canadian Blood Services is
introducing pathogen reduction (PR) technologies to further increase the safety of the blood supply.
The focus of this study is to identify key input parameters for the PR process and to estimate output dose
parameters for the units produced. The unit volume and platelet yield from combining buffy coat platelets
into a pool are estimated via Monte Carlo simulation. The value of sorting input buffy coat units according to
estimated platelet yield, prior to illumination, is determined. Finally, the model estimates the effects of two
different sorting algorithms on output quality control metrics.
The results of the study found that no process changes were required to ensure input units meet input PR
process guidelines. However, sorting input units according to platelet yield could significantly improve the
proportion of units meeting quality control metrics.
1
INTRODUCTION
Before a blood product can be transfused, numerous
safety checks must be completed. All blood products
in Canada undergo testing for transmissible diseases
and bacterial contamination before being made
available to patients. As a result, the risk of a
transfusion related infection is estimated at less than
1 in 47,000 transfusions, with most risk being due to
bacterial infection, rather than viral agents.
Nevertheless, there are infectious agents that are not
screened for, as well as the potential for infection
from emerging pathogens that are either unknown, or
for which screening tests have not been developed
(MacDonald & Delage, 2012). Canadian Blood
Services (CBS) is introducing pathogen reduction
technologies (PR) in Canada (Walsh, 2019). PR
works by introducing a compound into a blood
product, in this case platelets, and exposing the
resulting mixture to ultraviolet light. The compound
targets protein strands in DNA and RNA;
illumination with UV light causes mis-links to form
a
https://orcid.org/0000-0003-0617-8996
in the genetic materials of pathogens. The pathogen
then becomes unable to replicate.
The product considered in this study is a pool of
buffy coat platelets. Buffy coat is the name given to a
method of separating whole blood into components of
red cells, plasma, and an intermediate layer of
material (“a buffy coat”) that contains platelets and
white blood cells. (Levin, et al., 2008).
During the PR process, some number of buffy
coat units (7 in this study) are combined into an
illumination container, amotosalen is added, and the
resulting unit is exposed to UV light. Upon
completion of the exposure cycle, the platelets are
split into two separate bags, each representing an
adult dose.
What constitutes an adult “dose” of platelets for
transfusion is well defined, but there is latitude in the
input units that can be used to form a double dose for
the PR process.
386
Blake, J. and McTaggart, K.
Monte Carlo Simulation of Pathogen Reduced Platelet Production.
DOI: 10.5220/0011328200003274
In Proceedings of the 12th International Conference on Simulation and Modeling Methodologies, Technologies and Applications (SIMULTECH 2022), pages 386-394
ISBN: 978-989-758-578-4; ISSN: 2184-2841
Copyright
c
2022 by SCITEPRESS – Science and Technology Publications, Lda. All rights reserved
2
PROBLEM STATEMENT
The focus of this study is to estimate the key input
product parameters (volume and platelet yield) to
support the implementation of the PR process, to
estimate product output metrics, and to evaluate
changes to the manufacturing process to achieve a
consistent product.
A Monte-Carlo simulation method is employed to
estimate the unit volume and platelet yield resulting
from combining buffy coat platelets into a platelet
pool that subsequently undergoes pathogen reduction.
Additionally, the value of sorting input buffy coat
units according to estimated platelet yield prior to
illumination is determined.
3
LITERATURE
First introduced in Europe in the 2000’s, PR is
employed in at least 31 countries (AABB, 2015).
Despite its clinical advantages, cost has limited a
more widespread application. (Gorria, et al., 2019).
The expense of PR treatment can be offset by a
reduction in wastage when platelet shelf life is
extended. Thus, platelet inventory management has
been a focus of the literature in this area (Gorria, et al.,
2019). Blake and Reid (2017) use simulation to
estimate wastage rates when platelet shelf life is
extended in Canada after the introduction of enhanced
pathogen detection systems. Gorria et al. (2019)
employ a similar methodology to evaluate reductions
in waste due to implementation of PR technology in the
Basque Region. Blake, McTaggart, and Couture
(2021) in a later paper on PR technology, note that a
reduction in shelf life from 7 days to 5 accompanied
the original implementation of PR in Canada. They
employ simulation to estimate the interaction between
PR reduced platelets with a shelf life of five days and
apheresis platelets with a shelf life of seven days.
When implemented in North America, PR
platelets are often introduced into the formulary of a
blood supply chain along side conventional platelets,
which may have a different shelf life than treated
units (Rebulla & Prati, 2022). The issues of
maintaining a dual inventory have inspired a literature
on PR implementation.
For instance, Allen et al.
(2019) discuss the benefits of phased implementation
to maintain product availability while scaling up PR
platelet production. Nguyen et al. (Nguyen, Rioveros,
Ziman, McGonigle, & Ward, 2021) also describe the
implementation of PR technology in a dual inventory
environment, focusing on issues of technology
acquisition and commissioning. An economic
evaluation of PR technologies is provided in (Prioli,
Katz Karp, Lyons, Herman, & Pizzi, 2018), including
an estimate of change in wastage due to an increase
in shelf-life of from five to seven days.
Outside of inventory management, there is a
wealth of studies on the composition and behaviour
of PR treated platelets. See (Prioli, Katz Karp, Lyons,
Herman, & Pizzi, 2018) for a detailed review. There
are, however, few studies in the literature that focus
on analysis and optimization of the processes that
create the platelets, be they PR treated or not. Our
study is the first that we are aware of to use Monte
Carlo methods to evaluate platelet production
processes and to estimate unit metrics during and
post-production.
Nevertheless, Monte Carlo simulation techniques
(problems where the passage of can be ignored) are
common in health care settings. For example, there is
an entire genre of literature employing Monte Carlo
methods to optimize the treatment path for
individuals hospitalized for ischemic strokes. See
Zhou & Kansagra (2021) for an example.
4
METHOD
The PR process begins when seven buffy coat units,
with volume of ~47.5 ml [Normal (47.5, 1.002)] and
platelet yield of ~98.2x10
7
platelets [Johnson
distributed, with mean 98.2 x10
7
and standard
deviation of 22.1 x10
7
], are grouped. The group has a
resulting volume of ~332.5 ml [Normal (332.5, 2.66)]
and a combined platelet yield of ~687x10
7
platelets.
The platelets are extracted from each of the buffy coat
units using a press and collected into double input
platelet bag. The extraction process causes a
reduction in both the volume of product available and
the total number of platelets in the combined unit bag.
Volume losses are counterbalanced by the inclusion
of 280 ml of platelet additive solution (PAS) in the
platelet pool; the volume of the resulting platelet pool
is 99% [Normal (0.991, 0.034)] the original input
group volume after PAS is added. However, platelet
yield is approximately 86% of the input group yield
[Normal (0.8642, 0.41)]. See Figure 1.
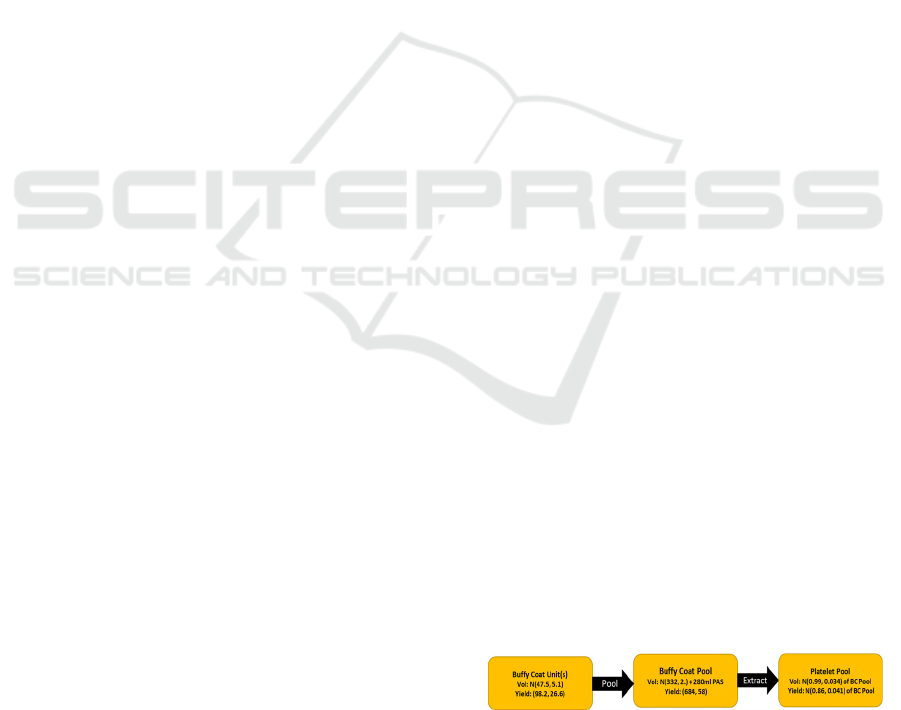
Figure 1: Schematic of unit flow. Each block describes the
process step, the expected volume (Vol) and the number of
platelets expected to be retained (Yield). Note that BC Pool
refers to a Buffy Coat Pool.
Monte Carlo Simulation of Pathogen Reduced Platelet Production
387

Because PRT has been certified in Canada for a
specific range of input volume (300 – 375 ml) and
platelet yield (250 – 700 x10
7
), our analysis focuses
on estimating, via simulation, these parameters for
input pools. In addition, because platelet yield with
buffy coats varies between donors, the study includes
an evaluation of sorting algorithms to ensure
consistent product input when combined into a buffy
coat pool and thus a more consistent output product.
4.1 Sorting Algorithm
The expected platelet yield for a pool of seven buffy
coats, after extraction, has a non-standard distribution
(𝑥̅ = 573.33, σ = 75.6) that is somewhat close to the
lower bound for the Canadian Standards Association
(CSA) efficacy requirement for pooled platelets,
which states that there must be 240x10
7
platelets in
75% of units sampled in a single unit, or 521x10
7
platelets in a double unit after losses for splitting the
unit are accounted for. Thus, it is expected that some
portion of the units produced by the PR process with
randomly selected buffy coat units would fail to meet
this standard. If, however, the variability of the input
unit could be reduced, fewer pools would fall outside
of the standards. The standard deviation of a pool of
seven randomly selected buffy coats can be estimated
from pilot studies as 57.8 x10
7
. However, a sorting
algorithm could be used to reduce variance of the
group of buffy coats used to form the platelet pool.
This would result in an input unit that would still meet
production bounds for the PR process and would be
less likely to result in completed units that would fail
to meet the minimum CSA standard.
A sorting algorithm is a process where some
number of buffy coat units are gathered, prior to
platelet pooling, based on actual or estimated platelet
yield, to achieve more consistent input pools for the
PR process. Theory indicates that the larger the
number of buffy coats to select from when building a
pool, the more consistent the resulting pooled platelet
yield should be. However, there are practical limits to
how much work in process (WIP) inventory can be
held immediately prior to the buffy coat pooling
process. Thus, the amount of WIP stored for a sorting
algorithm must balance needs for smooth product
flow against the value of better information for
assembling a pool; only a finite amount of inventory
can be held, and pooling decisions must be made in
real time, rather than at the end of a production run.
In this study, three different sorting algorithms are
tested under varying levels of work in process
inventory. The sorting algorithms are:
Random Sort: A random sort corresponds to a null
sort. A group of seven buffy coats is assembled by
selecting each unit in sequence as it becomes
available at the end of the production line. A random
sort is fast and easy to implement in the operational
environment but has no impact on the variability of
the platelet pools created. A random sort, however,
serves as a benchmark for comparison of other sorting
algorithms.
Bin Sort: A bin sort is a simple heuristic algorithm to
reduce platelet pool variability in a set of buffy coat
pools. Some number (N) of bins is created into which
inventory could be placed as it arrives at the pooling
station at the end of the production line. The bins
would be designated with ranges for platelet yield
(i.e., a bin might be designated for units with a platelet
yield of between 77x10
7
and 88x10
7
platelets).
Periodically, a pool is assembled by selecting units
from within the bins. Each unit from a particular bin
would have an integer “score” (c
n
) ranging from -
⌊
𝑁/2
⌋
to +
⌊
𝑁/2
⌋
. If we assume x
n
to be the number
of buffy coats selected from bin n, then the bin sort
can be defined as:
𝑀𝑖𝑛: 𝑧 = 𝑑
+ 𝑑
𝑆𝑢𝑏𝑗𝑒𝑐𝑡 𝑡𝑜:
𝑐
𝑥
+𝑑
− 𝑑
=0
𝑥
≤𝑖
𝑥
∈
0,1,…
𝑑
,𝑑
≥0
Model 1: Bin Sort.
Where:
c
n
is the score assigned to buffy coats drawn from
bin n
x
n
is the number of buffy coat units drawn from
bin n
d
-
is a slack variable representing pools below
the target score of 0
d
+
is a surplus variable represent pools above the
target score of 0
i
n
is the number of buffy coat units in bin n
The bin sort is defined above as a mixed integer
programming (MIP) problem that can be solved with
an IP solver (see for example, https://opensolver.org/)
or approximated manually by assembling a batch with
a penalty score (
∑
𝑐
𝑥
) as close to 0 as possible.
SIMULTECH 2022 - 12th International Conference on Simulation and Modeling Methodologies, Technologies and Applications
388

Optimal Sort: It is also possible to formulate the pool
sort as a mixed integer programming problem with an
objective of achieving a specified target yield. Instead
of selecting from a set of bins, all units would be
considered individually for inclusion into a pool. The
problem can be formulated as:
𝑀𝑖𝑛: 𝑧 = 𝑑
+ 𝑑
𝑆𝑢𝑏𝑗𝑒𝑐𝑡 𝑡𝑜:
𝑦
𝑥
+𝑑
− 𝑑
=𝑌
𝑥
=𝐵
𝑥
∈(0,1)
𝑑
,𝑑
≥0
Model 2: Optimal Sort.
Where:
y
i
is the estimated platelet yield in buffy coat i
x
i
is a (0,1) variable equalling 1 if buffy coat i is
included in the pool
d- is a slack variable representing pools below
the target yield
d+ is a surplus variable represent pools above the
target yield
Y is the target yield for the pool
I is total number of buffy coats available in for
pooling (i.e., WIP)
B is the number of buffy coats required in a pool
The sort algorithm above, defined as a mixed integer
programming (IP) problem, cannot be (easily)
approximated with manual methods. Due to the
requirement for an optimization engine and
individual identification of units, an optimal sort
would be more complex to implement in a production
environment, however.
4.2 Simulation
A Monte Carlo methodology was adopted to simulate
buffy coat pooling prior to irradiation in the PR
process and to evaluate the impact of a pooling
algorithm on the ability to meet input process
guidelines while creating output that meets CSA
standards.
A custom simulation model was constructed in
Visual Basic for Applications (VBA) using MS-Excel
as the user interface. The simulation employs an
object-oriented framework to represent buffy coat
units, the pooling process, sorting bins, and the
sorting algorithms themselves. A summary of the
class objects in the simulation is given below:
clsUnit is a class object that represents a buffy coat
unit. Buffy coat units have attributes of volume,
platelet yield, and ID number.
clsBin is a class object that represents a bin used in a
bin sort algorithm. It has properties of bin ID number,
capacity, and score. Methods include a mechanism to
store individual buffy coat units, a routine to identify
a specific buffy coat within the bin and a routine to
remove a unit from the bin.
clsBinSet represents a collection of bins used in a bin
sort algorithm. It has properties of capacity (i.e., the
maximum amount of end of process inventory or WIP
that can be in all bins), bin (a reference to a bin within
the bin set), items (the number of units in all bins),
unit (a reference to a specific buffy coat within a
specific bin in the bin set) and target yield. Methods
include routines to add a unit to a bin or to remove a
unit from a bin within the bin set.
clsSolver is an object that encapsulates an interface to
the OpenSolver add-in for Excel. The object has
methods that build both the bin sort and optimal sort
models, methods for solving the models, once
defined, and methods for returning a solution to the
calling program.
4.3 Simulation Flow
The buffy coat pooling simulation generates buffy
coat units. Each unit is given a simulated platelet
yield and volume. The buffy coat is then added to a
bin, based on the unit’s platelet yield. When the total
number of buffy coats in inventory (WIP) equals the
bin set capacity, a platelet pool is formed. In
experiments run with the model, WIP limits were set
at some integer number of buffy coat pools; this
restriction is in place to reduce the number of
“orphaned” units that cannot be made into a pool at
the end of the simulation run. The simulation then
calls the IP solver to build and execute a model to
create a platelet pool from a set of input buffy coats.
The list of input buffy coat units is returned to the
simulation object. The simulation removes the units
from the bins. The pool volume is calculated using a
random distribution of changes to the input volume.
In this study, buffy coat pool volume is N(0.991,
0.037) times the sum of the input buffy coat volumes.
In a similar way, the buffy coat pool yield is estimated
from the sum of the input buffy coat yields; the
Monte Carlo Simulation of Pathogen Reduced Platelet Production
389
distribution of buffy coat yields is 86.4% of the sum
of the input buffy coat yields [Normal (0.864, 0.041)].
The process of creating buffy coats and
assembling them into pools continues for some
number of trials. Each time a pool is created, its
volume and yield are compared against an acceptable
input target range for the PR process: 300-375 ml for
volume; 250-700x10
7
for platelet yield. If a pool falls
outside of this range, a violation is noted by the
simulation. Further, if a group of units results in a
platelet pool yield below 521x10
7
, a potential
violation of CSA standards is noted. At the end of the
simulation run, the proportion of pools failing to meet
input or CSA targets is returned, as is the overall
average pool volume and platelet yield.
5 DATA USED IN THE STUDY
Data for this study was obtained from a sample
(n=84) of test buffy coat pools assembled at Canadian
Blood Service’s research collection and production
facility (netCAD) between 05 Sep 2019 and 17 Oct
2019 as part of a pilot project.
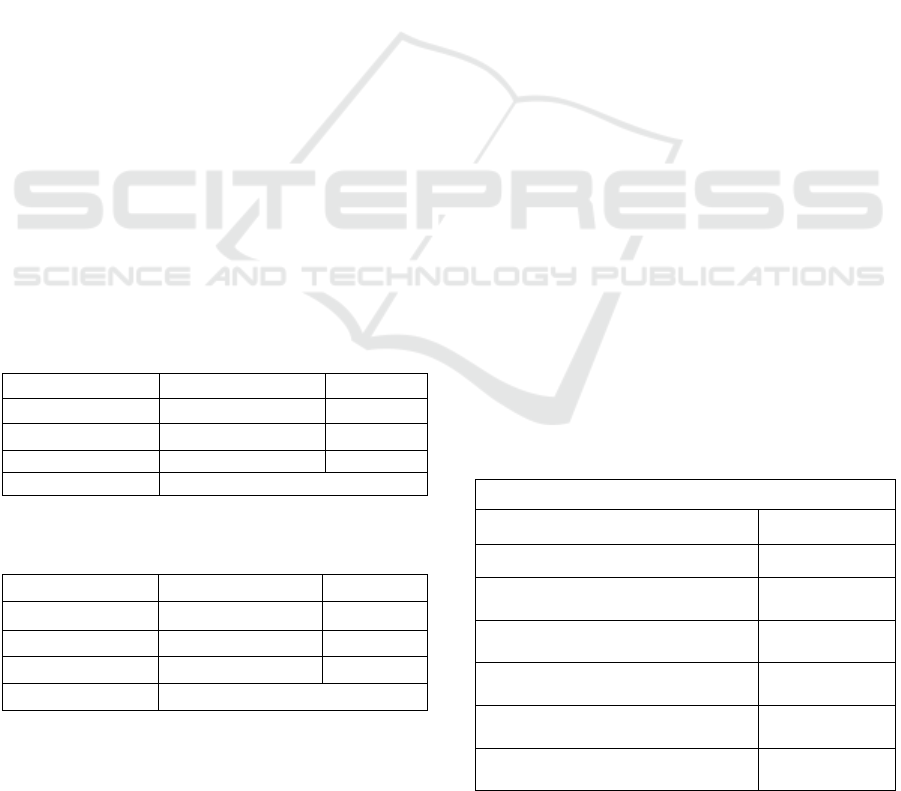
Summary statistics and a box plot for buffy coat
platelet yield appear below.
Table 1: Summary statistics for platelet yield based on N =
84 buffy coat units. Note that yield statistics are reported as
platelet count x 10
7
.
N Mean St Dev Median Min Max
84 96.95 21.85 93.31 56.21 179.35
Figure 2: Boxplot of platelet yield for n=84 buffy coat units.
Summary statistics for buffy coat unit volume
appear below.
Table 2: Summary statistics for buffy coat unit volume (ml).
N Mean St Dev Median Min Max
84 47.738 1.223 48.0 44.0 50.0
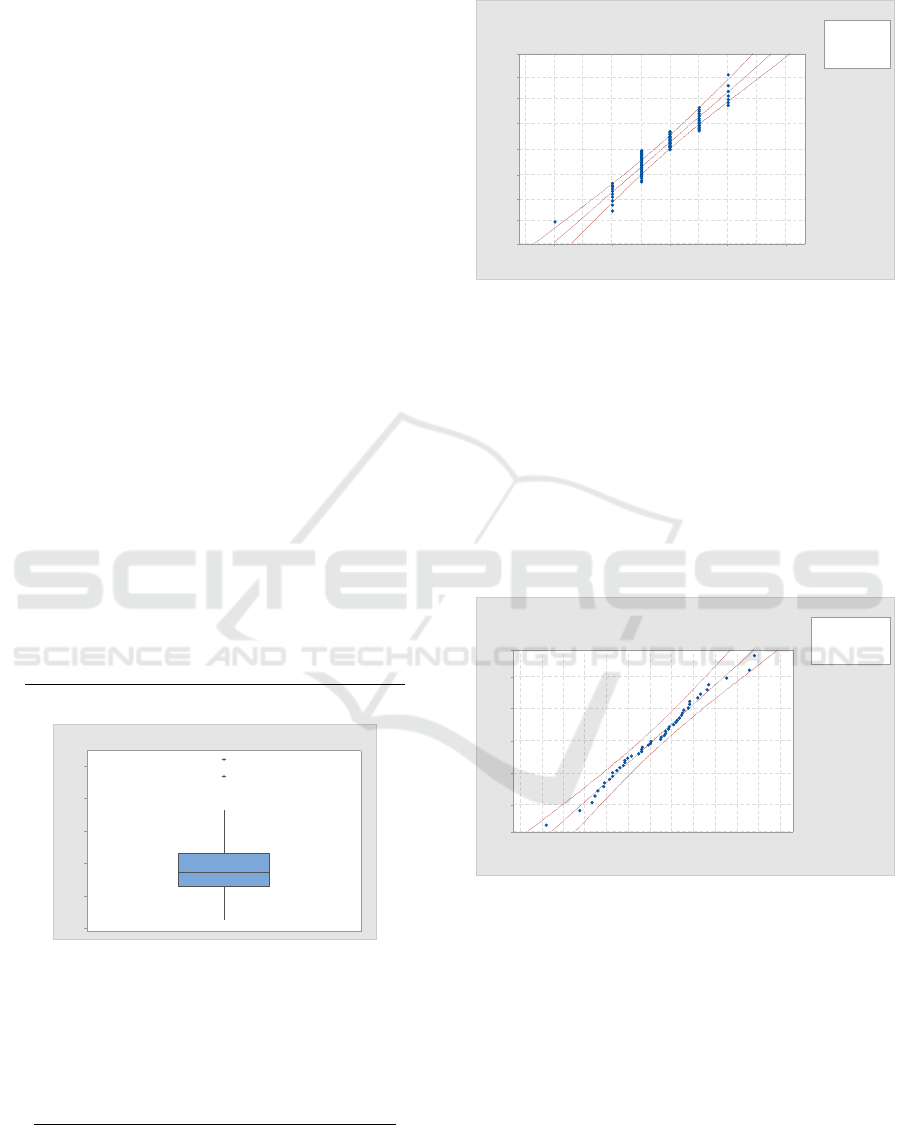
Distributions were fit to both buffy coat unit
volume and buffy coat unit platelet yield. A normal
distribution [Normal (47.7, 1.223)], was fit to the
buffy coat unit volume sample. See Figure 3.
Figure 3: Probability plot for sampled buffy coat (BC)
volumes (in ml) compared to a normal probability
distribution.
A Johnson transform was found to provide the
best fit for the buffy coat unit platelet yield data. In
the simulation, therefore, an N(0,1) distribution is
used to generate buffy coat platelet yield and the
inverse of the Johnson transform is used to return a
value in the original data space. See (Law, 2006) for
more detail. For the data appearing in
Figure
4, the Johnson transform parameters are A
= -1.201, B = 1.593, C = 73.874, and D = 21.989.
Figure 4: Johnson transformed buffy coat platelet yield
plotted against an N(0,1) distribution.
Once buffy coat units are pooled and platelets are
extracted, a platelet additive solution is added to the
pool. The process causes both the volume of the
pooled platelet unit and its platelet count to vary from
the sum of the input buffy coat units. A
Normal(0.991, 0.037) distribution was found to
represent adequately the scale change in volume of
the output unit from the sum of input buffy coat pools;
a Normal(0.864, 0.041) was found to represent the
scale change in platelet yield in the pooled unit as
measured from the sum of the input unit yields.
175
150
125
100
75
50
BC Yield
Boxplot of BC Yield
5250484644
99.9
99
95
80
50
20
5
1
0.1
BC Volume
Percent
Goodness of Fit Test
Normal
AD = 2.817
P-Value < 0.005
Probability Plot for BC Volume
Normal - 95% CI
3210-1-2-3
99
95
80
50
20
5
1
Adjusted Yield
Percent
Goodness of Fit Test
Johnson T ransformation
AD = 0.191
P-Value = 0.893
After John son transform ation
Probability Plot for Adjusted Yield
Normal - 95% CI
SIMULTECH 2022 - 12th International Conference on Simulation and Modeling Methodologies, Technologies and Applications
390
6 ANALYSIS
6.1 Overview
Experiments were conducted using both a bin sort and
an optimal sort algorithm with different levels of WIP
at the end of the production line available to build a
pool. The experiments estimate the volume and yield
of input buffy coat pools and determine the impact, in
terms of output product metrics, including post-
illumination quality control, of implementing a sort
algorithm for input units.
6.2 Model Verification
To verify the simulation, tests were conducted with
the model and the results were compared to the
historical dataset used to build the input distributions
listed in § Data. The purpose of the verification was
to ensure that the model returns values matching input
pilot project data.
In Table 3 the pooled platelet volume (ml), after
buffy coat units are pooled identified during the pilot
project, is compared to simulation output using a t-test;
Table 4 compares the pooled platelet yield from the
data set to simulation output using a Mann-Whitney
test, since the underlying data is not normally
distributed. As may be seen from the simulation, there
is no data to disprove the null hypothesis that the
mean/median of the simulation output is the same as
mean/median of the data used to build the model.
Table 3: T-test comparison of pooled platelet volume in the
pilot project dataset and the simulation results.
Pilot Project Data Simulation
Mean 331.2 331.1
Standard Deviation 12.5 12.1
n 7 300
p-value 0.99
Table 4: Mann-Whitney comparison of pooled platelet
yield in the pilot project dataset and the simulation results.
Pilot Project Data Simulation
Mean 573.3 580.0
Median 592.06 573.88
n 7 300
p-value 0.978
6.3 Sorting Experiments
Experiments were conducted with the simulation to
evaluate the ability of the process to meet input
processing requirements as well as CSA standards for
completed units. The simulation model was run under
the assumption of no sorting for buffy coat units prior
to forming a pool; employing a bin sort algorithm
having 3, 5, or 7 bins prior to forming a pool; and
employing an optimal sort prior to forming a pool.
For both sort algorithms, differing amounts of WIP
(7, 14, 21, or 28 units) were tested. In each instance,
the simulation was run for 5 replications of 1000
batches of 7 buffy coats. The results of the
experiments appear below.
In Table 5, the results from a run without any
sorting algorithm in place are presented. From the
table it may be seen that the pooled platelet volume is
expected to meet acceptable PR input volume (300-
375 ml) and input platelet yield (250x10
7
– 700x10
7
platelets) restrictions without a sorting algorithm and
only marginal losses in production; approximately
0.4% of batches would exceed input volume
restrictions and 2.13% of batches would exceed input
platelet yield limits.
However, without a sort in place, some pooled
units would have a platelet count below 480x10
7
, the
CSA dictated minimum number of platelets that must
appear in 75% of the units sampled for quality control
(QC) purposes, if applied to double pools (2 units at
240x10
7
apiece). Note: In our analysis, we add 41x10
7
platelets to the minimum pool requirement to account
for losses in lines when a double unit is split into two
single units. Since quality control samples typically
consist of ten units of randomly sampled platelets, it
can be calculated, via the binomial distribution, that
33.43% of sampled batches would be fall below
minimum CSA efficacy standards if 19.6% of pooled
units have a platelet yield of 521x10
7
or less, as
reported by the simulation.
Table 5: Expected process metrics if no sorting algorithm is
used.
No Sort
% pools with volume below 300 ml 0.4%
% pools with volume above 375 ml 0.00%
% pools with platelet yield below
521x10
7
19.6%
% pools with platelet yield below
250x10
7
0.00%
% pools with platelet yield above
700x10
7
2.1%
Simulated pool volume
(
Mean, St Dev
)
in ml
(331.59, 3.24)
Simulated pool yield
(
Mean, St Dev
)
*10
7
(568.81, 54.12)
Monte Carlo Simulation of Pathogen Reduced Platelet Production
391
6.3.1 Bin
Sort
Experiments were conducted with a bin sort
algorithm, using 3, 5, or 7 bins and WIP inventory
available for sorting set at 7,14, 21, and 28 units (or
1, 2, 3, or 4) pools. Several output metrics were
recorded in the simulation, but this report focuses on
the proportion of pools expected to have yield below
521x10
7
and the number of quality control batches, of
size 10 units, expected to fall below minimum CSA
standards.
Table 6: Simulated results showing the number of pools
with a platelet yield below 521x10
7
as bin size and WIP is
varied assuming a bin sort algorithm.
% pools
below
521x10
7
WIP
7 14 21 28
# of Bins
3 19.6% 12.5% 11.4% 10.8%
5 20.3% 8.6% 8.2% 7.7%
7 19.5% 8.3% 9.0% 6.6%
Table 7: Simulated results showing the number of the
proportion of quality control batches of size 10 expected to
be blow CSA standards as bin size and WIP is varied
assuming a bin sort algorithm.
% pools not
meeting
CSA
standards
WIP
7 14 21 28
# of Bins
3 31.1% 12.1% 9.5% 8.5%
5 33.2% 4.8% 4.3% 3.7%
7 30.8% 4.5% 5.5% 2.5%
As may be seen in Table 6, the proportion of pools
below a platelet count of 521x10
7
per unit decreases
at the number of designated bins increases. The
impact of WIP available to build a batch, beyond 14
units, on the proportion of batches not meeting the
521x10
7
platelets per unit standard is modest, but
statistically significant across the set of experiments.
It is particularly evident that the impact of WIP on
batch yields is quite modest if the number of bins used
in the sort is greater than three. An analysis of
variance (ANOVA) conducted on the experimental
results for platelet yield under the assumption of a
bin-sort algorithm, show that the number of bins is
significant (DOF = (2,30), F
Crtical
= 3.15, p = 0.005),
as is the WIP level for the entire experiment set.
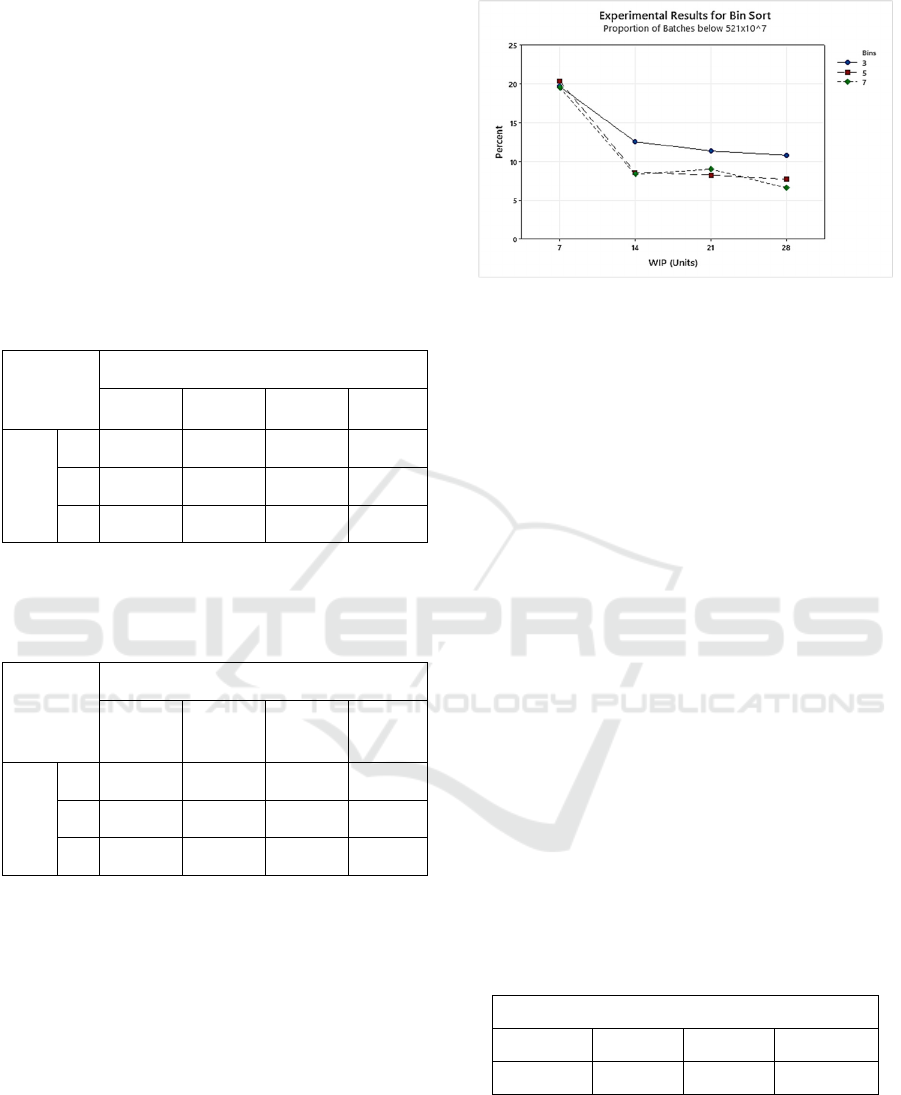
Figure 5: Interaction plot illustrating the results from the bin
sort experiments. Plot shows the proportion of units
expected to have a platelet yield below 521x10
7
.
Figure 5 illustrates the results for the bin sort
experiments. It shows that an inventory of 7, equating
to a random sort, is inferior to a sort with any number
of bins. Figure 5 also shows that any bin sort with
more than three bins will produce similar results for
platelet yield, all of which are superior to a 3-bin sort.
Finally, it was found that if the 3-bin sort and all
experiments with 7 units of WIP (i.e., a random sort)
are eliminated from the comparison, there is no
statistical significance, for either the number of bins
or the amount of WIP available to assemble a batch,
on platelet yield.
6.3.2 Optimal Sorting
Experiments were also conducted using an optimal
sort algorithm. In this set of experiments, only one
algorithm is employed (the optimal sort algorithm),
while the amount of WIP available to build a pool is
varied between 7, 14, 21, and 28 units. The simulation
was run for 5 replications of 1000 batches of size 7 to
get a measure of variability. Results appear below.
Table 8: Simulated results showing the number of pools
with a platelet yield below 521x10
7
as WIP is varied
assuming an optimal sort algorithm. Note that there are no
bins in the optimal sorting algorithm.
WIP
7 14 21 28
29.6% 7.2% 5.7% 6.2%
Experimental results, confirmed by an ANOVA
(DOF = (2,8), F
Crtical
= 4.45, p = 0.63), show that
inventory has no effect on the proportion of pools not
meeting CSA standards, so long as at least 14 units
are available to build batches. See Table 9. Similarly,
it is evident from Table 8 and Figure 6 that larger WIP
SIMULTECH 2022 - 12th International Conference on Simulation and Modeling Methodologies, Technologies and Applications
392
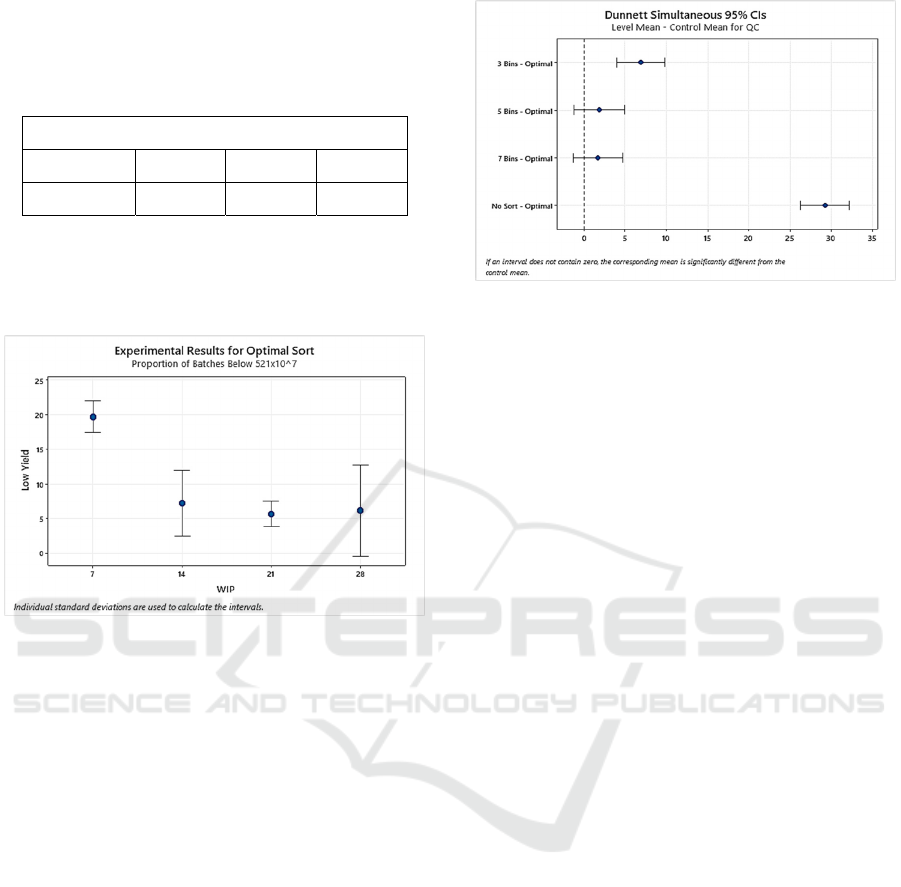
Table 9: Simulated results showing the number of the
proportion of quality control batches of size 10 expected to
be blow CSA standards as WIP is varied assuming an
optimal sort algorithm. Note that there are no bins in the
optimal sorting algorithm.
WIP
7 14 21 28
31.1% 3.1% 1.6% 2.0%
inventory does not lead to reductions in the
proportion of buffy coat pools with less than 521x10
7
platelets, if at least 14 units are available to build
batches.
Figure 6: Interaction plot illustrating the results from the
optimal sort experiments. The plot shows the proportion of
units expected to have a platelet yield below 521x10
7
.
6.3.3 Sort vs. No Sort
A comparison of the simulation results with sort
algorithms in place vs. no sort was conducted using
an analysis of variance. The ANOVA indicated a
statistically significant difference between the sort
and no-sort scenarios. A Dunnett’s test and analysis
of means, indicates that the no-sort algorithm
produces a statistically larger fraction of QC batches
not meeting CSA standards. The bin sort algorithms
produce fewer non-conforming QC batches than not
sorting, but there were no statistically different results
with increasing number of sort bins. The ANOVA
(DOF = (2,45), F
Crtical
= 3.20, p = 0.335) showed,
however, that an optimal sort algorithm outperforms
both the 3 and 5 bin sort scenarios and the no-sort
scenario, with respect to the proportion of non-
conforming batches. Finally, the analysis suggests
that, if a bin sort algorithm is used, the impact of the
number of bins on the proportion of QC batches of
size 10 that do not meet 521x10
7
in 75% of units, is
unaffected by the actual number of bins. See Figure
7.
Figure 7: Comparisons fraction of pooled units not meeting
minimum CSA standards by sorting algorithm.
7
CONCLUSION
This study estimated the impact of the process used
to assemble input buffy coat units into buffy coat
pools prior to illumination in a pathogen reduction
system. The benefit that could be achieved by sorting
input buffy coat units to ensure consistent input pools
for the PR process was evaluated.
A Monte-Carlo simulation model was built,
populated with experimental data from a pilot project,
and verified. Experiments were conducted using
different sorting algorithms (no sort, bin sort, and
optimal sort) and differing levels of WIP used to build
pools (7, 14, 21, 28 units).
The simulation shows that, even without a sort
algorithm in place, more than 97.5% of pooled
platelet units would be expected to meet input
restrictions for both volume (300-375 ml) and platelet
yield (200 – 700x10
7
). However, approximately
20.4% of all pools would have a platelet yield below
521x10
7
and that 31.1% of quality control batches of
size 10 assembled from such units would fail to meet
a minimum efficacy standard of 521x10
7
platelets in
75% of the units sampled.
Implementing any sort of sorting algorithm with a
minimum of 14 units of WIP will result in a
statistically significant reduction in low yield units
and will improve the acceptance rate for quality
control batches. A simple bin sort using, 3, 5, or 7 bins
will produce a more consistent input platelet pool for
the PRT system. However, the simulation results
were not statistically different between the bin sorts
employing different numbers of sorting bins. Thus,
should a bin sort be implemented, a 3 or 5 bin sort
might well be as effective as a 7-bin sort.
The simulation shows, as is expected, that the
most consistent input pools are provided by an
Monte Carlo Simulation of Pathogen Reduced Platelet Production
393

optimal sort algorithm. Furthermore, the results
suggest that an optimal sort algorithm, using a WIP
of at least 14 units, results in the most consistent input
pools. An optimal sort algorithm using a WIP of at
least 14 units would result in less than 3% of all
quality control samples falling below the CSA
minimum. The simulation shows that an optimal sort
is statistically similar to a 7-bin sort, but superior to a
3 or 5-bin sort, when compared over all WIP levels
and measured in terms of meeting minimum CSA
standards.
Thus, it may be concluded that a sort algorithm,
of any kind, will improve the acceptance rate of
platelet pools coming from the PR process described
in this paper. Optimal sort algorithms, clearly,
provide the best result, but would be complex to
implement in a production environment. A simpler
bin-sort algorithm was found to perform similarly to
an optimal sort, if the number of bins was greater than
or equal to 5. The impact of increasing WIP on QC
acceptance rates was found to be modest, so long as
14 units were available. Thus, it is practical to suggest
that a simple 5 bin sort algorithm could be used to
ensure the most efficacious units are delivered by the
PR process.
REFERENCES
AABB. (2015). Listing of countries in which pathogen
reduction technology systems and products are in use.
Retrieved May 24, 2022, from AABB: www.aabb.org
Allen, E., Vincent, C., Reeve, D., & Kopko, P. (2019).
Phased implementation of pathogen‐reduced platelets
in a health system facilitates increased manufacturing at
the blood center. Transfusion, 59(10), 3120-3127.
Blake, J., & Reid, K. (2017). Determining the impact of
extended shelf life platelets with a nework simulation
model. Transfusion, 57(12), 3001-3008.
Blake, J., McTaggart, K., & Couture, C. (2021). Estimating
the impact on inventory of implementing pathogen
reduced platelets in Canada. Transfusion, 61(11), 2150-
3160.
Gorria, C., Labata, G., Lezaun, M., Javier Lopez, F., Perez
Aliaga, A., & Perez, M. (2019). Impact of
implementing pathogen reduction technologies for
platelets on reducing outdates. Vox Sanguinis, 115(2),
167-173.
Law, A. (2006). Simulation modeling and analysis, 4th Ed.
New York: McGraw-Hill.
Levin, E., Culibrk, B., Gyonyossy-Issa, M., Weiss, S.,
Sammel, K., LeFresne, W., Devine, D. (2008).
Implementation of buffy coat platelet component
production: comparison to platelet-rich plasma platelet
production. Transfusion, 48(11), 2331-2337.
MacDonald, N. O., & Delage, G. (2012). Transfusion and
risk of infection in Canada: Update 2012. Paediatrics
& Child Health, 17(10), e102-e111.
Nguyen, J., Rioveros, J., Ziman, A., McGonigle, A., &
Ward, D. (2021). How do we implement pathogen
reduction technology,while maintaining an adequate
platelet inventory for our patients? Transfusion, 61(4).
Prioli, K., Katz Karp, J., Lyons, N. C., Herman, J., & Pizzi,
L. (2018). Economic Implications of Pathogen Reduced
and Bacterially Tested Platelet Components: A US
Hospital Budget Impact Model. 16, 889-899.
Rebulla, P., & Prati, D. (2022). Pathogen Reduction for
Platelets—A Review of Recent Implementation
Strategies. Pathogens, 11(2), 142.
Walsh. (2019, Mar 08). Pathogen Inactivation – A Primer.
Retrieved from www.blood.ca: https://www.blood.ca/
en/research/our-research-stories/research-education-
discovery/pathogen-inactivation-primer
Zhou, M., & Kansagra, A. (2021). Population health impact
of extended window thrombectomy in acute ischemic
stroke. Interventional Neuroradiology, 27(4), 516-522.
SIMULTECH 2022 - 12th International Conference on Simulation and Modeling Methodologies, Technologies and Applications
394
