
Effects of the Coronavirus Pandemic on Youth Mobility: A Case
Study Analysis through Floating Car Data
Simone Porru
a
, Francesco Edoardo Misso
b
, Silvia Manca and Cino Repetto
T Bridge S.p.A., Via Garibaldi 7/10, Genova, Italy
Keywords: Floating Car Data, GPS Data Analysis, Youth Mobility.
Abstract: Among mobility data sources, Floating Car Data plays a very, and increasingly, significant role, and has been
extensively used to obtain traffic information. In this study, FCD has been used to shed light upon the youth
mobility changes occurred during the first two years of the coronavirus pandemic by focusing on five selected
high schools in Modena Municipality (Italy). Mobility indicators computed within the areas under
investigation show that two out of the three schools’ areas are not associated to a significant variation in the
number of detected distinct private probe vehicles from November 2019 to November 2021 (-3% and +1%),
whereas within the Modena Municipality results show a 8% decrease. However, one out of the three schools’
areas shows a significant decrease in 2021 when compared to 2019 (-11%), suggesting a noticeable decrease
in private vehicles traffic density that could be due to an increased use of personal mobility vehicles, such as
bikes. Moreover, results within the Modena Municipality suggest that in 2021, even if the number of detected
vehicles was lower than in 2019, each vehicle not only covered a longer distance on average, but also the total
distance covered by all the vehicles together was longer (14% increase).
1 INTRODUCTION
Floating Car Data (FCD) refers to data collected
directly by a vehicle as it is in motion, typically
covering its location and speed (ECOSOC, 2021;
Zannat, 2019). FCD has been used for a variety of
purposes, including estimating the level of service on
traffic networks (Dailey, 2002), investigating traffic
safety (Axer, 2013; Biral, 2021; Guido, 2012; Kerner,
2005; Vaiana, 2014), and regulating traffic signals
(Astarita, 2017). Connected vehicles providing FCD
are to be considered as moving sensors, and as such
they are extremely different from other data sources
traditionally used for traffic prediction such as fixed
traffic detectors (e.g., induction loops and traffic
cameras) (Altintasi, 2017). The latter, contrary to
FCD data sources, provide information about the total
traffic, even if only relevant to the road section where
the detectors are deployed. In general, however, it is
yet unclear how much FCD is necessary for traffic
estimations and predictions, considering that not all
the vehicles can be equipped with FCD devices such
as GPS, smartphones, V2X onboard units, and also
a
https://orcid.org/ 0000-0002-8448-9282
b
https://orcid.org/ 0000-0002-6660-3360
considering that these devices may not always
actively transmit traffic data (Mena-Oreja, 2021).
Apart from traffic density, by leveraging the
information provided by connected vehicles via FCD
it is possible to calculate a range of mobility
indicators relevant to selected areas and time frames.
This study, based on work undertaken for the project
YOUMOBIL (T Bridge, 2022)—a project aimed at
enhancing the passenger transport system for young
people that live in rural areas and at improving their
access to the European and national transport
networks—attempts to analyse FCD to shed light
upon the youth mobility changes occurred during the
first two years of the coronavirus pandemic. In
particular, since areas and time frames that are mostly
related to youth activities—such as schools’
neighbouring areas around start times—may be
further investigated to find potential clues on how
youth mobility has changed between 2019 and 2021,
the FCD analysis reported in this article attempts to
evaluate the youth mobility changes during the first
two years of the coronavirus pandemic by focusing
on five selected high schools in the Modena
144
Porru, S., Misso, F., Manca, S. and Repetto, C.
Effects of the Coronavirus Pandemic on Youth Mobility: A Case Study Analysis through Floating Car Data.
DOI: 10.5220/0011318900003280
In Proceedings of the 19th International Conference on Smart Business Technologies (ICSBT 2022), pages 144-151
ISBN: 978-989-758-587-6; ISSN: 2184-772X
Copyright
c
2022 by SCITEPRESS – Science and Technology Publications, Lda. All rights reserved
Municipality, located in the territory of Emilia-
Romagna, a region of northern Italy.
To this purpose, we pursue the following research
questions:
RQ1: Does traffic near selected high schools in
2021 significantly differ from 2019? We want to
shed light on how youth mobility changed during the
coronavirus pandemic. Consequently, we decided to
focus on mobility indicators related to areas relevant
to youth education, namely, schools’ neighbouring
areas, in 2019 and 2021.
RQ2: How do the traffic changes near high
schools compare to traffic changes in the whole
Municipality of Modena in 2019 and in 2021? To
better evaluate the traffic changes within areas linked
to youth activities, we should compare them to an
appropriate baseline. As a consequence, we also
evaluated the mobility changes in the whole
Municipality of Modena, where the schools’ areas are
located.
The rest of the paper is organized as follows:
Section 2 presents the methodology, starting from the
territorial context under investigation and the
reference time frames, and then introducing the FCD
dataset and the mobility indicators; Section 3 reports
the results of the analysis, focusing on the Modena
Municipality, the schools’ areas, and the FCD
penetration rate; Section 4 addresses the research
questions and, finally, Section 5 draws the
conclusions.
2 METHODOLOGY
2.1 Territorial Context
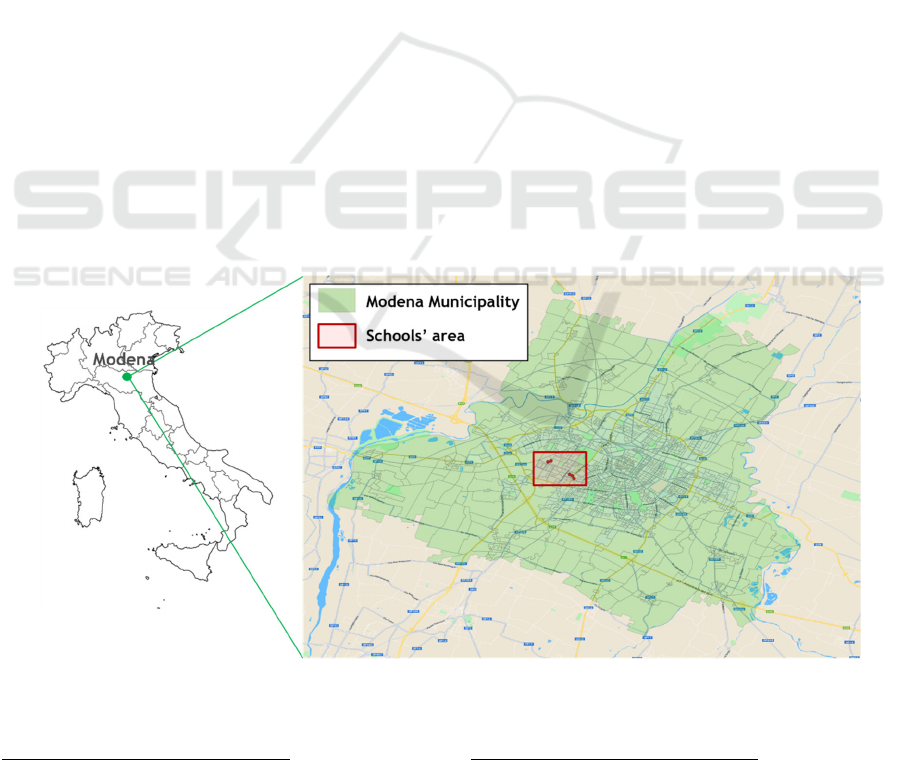
The FCD analysis focuses primarily on the traffic
density around five selected high schools in the
Modena Municipality, on the south side of the Po
Valley, in the Province of Modena in the territory of
Emilia-Romagna, a region of northern Italy (Figure
1). The schools, all located to the west of the old city
centre, are the following:
• F. Selmi Institute of Higher Education, located
at Via Leonardo da Vinci 300, in Villaggio
Artigiano district
1
;
• F. Corni Institute of Higher Education, located
at Via Leonardo da Vinci 300, next to the F.
Selmi institute, in Villaggio Artigiano
district
2
;
• Wiligelmo High School, located at Viale
Corassori 101, in San Faustino district
3
;
• G. Guarini Institute of Higher Education. The
school is located at Via Corassori 95, very
close to Wiligelmo High School, in San
Faustino district
4
;
• Cattaneo-Deledda Professional Institute. The
school is located at Strada degli Schiocchi
110, in San Faustino district, close to G.
Guarini Institute of Higher Education
5
.
Figure 1: Location of Modena within Italy (left) and location of the five selected schools (red dots, right) within the
Municipality of Modena (green shaded area, right).
1
www.istitutoselmi.edu.it
2
https://www.istitutocorni.edu.it/
3
https://www.liceowiligelmo.edu.it/
4
https://www.istitutoguarini.edu.it/
5
https://www.cattaneodeledda.edu.it/
Effects of the Coronavirus Pandemic on Youth Mobility: A Case Study Analysis through Floating Car Data
145
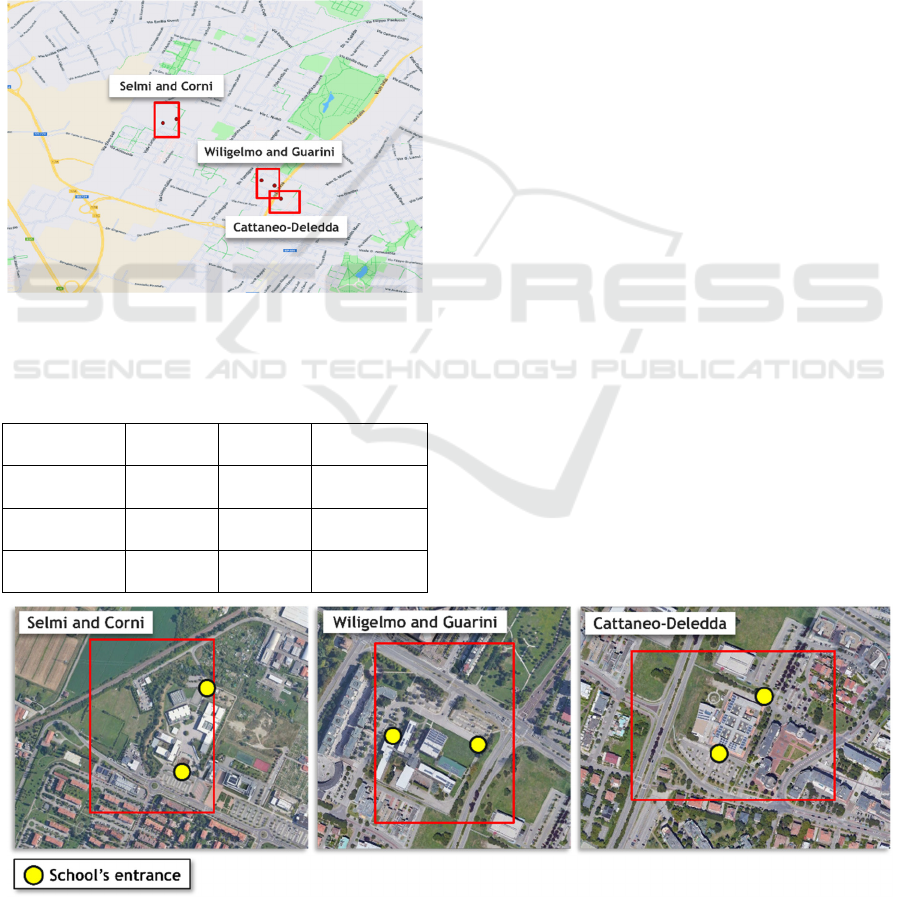
Since two or more schools located next to each
other share their surroundings, to the purpose of the
mobility analysis the five schools can be grouped in
three main areas (Selmi and Corni, Wiligelmo and
Guarini, and Cattaneo-Deledda) according to the
schools’ proximity to each other. To allow for a better
detection of the impact of the traffic flow generated by
the schools, such areas can be made large enough to
include the main parking areas and roads where
students can get out of a private vehicle after taking a
ride to school at start times, leading to the identification
of the areas shown in Figure 2 and Figure 3.
Table 1 reports the total number of enrolled
students for each area in school year 2021/2022.
Figure 2: The 3 schools’ areas under study (Selmi and
Corni, Wiligelmo and Guarini, Cattaneo-Deledda).
Table 1: Enrolled students by area in school year
2021/2022.
Area District Schools Students
(2021-2022)
Selmi and
Corni
Villaggio
Artigiano
2 3,033
Wiligelmo
and Guarini
San
Faustino
2 1,587
Cattaneo-
Deledda
San
Faustino
1 1,281
2.2 Reference Periods for Comparison
To allow for an effective comparison on mobility
changes between the period before the coronavirus
pandemic and the most recent times, we first
identified a recent time period in which tough
coronavirus restrictions affecting mobility (and
especially youth mobility) were not in place (e.g., no
lockdowns, limited distance learning), so that the
impact of the coronavirus pandemic on mobility
patterns could possibly be observed devoid of the
temporary effects of harsh COVID-19 measures.
To this purpose, we selected November 2021 as a
suitable candidate time frame for the study
(Lombardi, 2021). This choice also led to select
November 2019 as the corresponding counterpart in
the period before the coronavirus pandemic, since the
two time frames correspond to the same period of the
year and consequently allow for a meaningful
comparison between 2019 and 2021.
More specifically, we focused on the periods 9-29
November 2019 and 8-28 November 2021, because
the two time frames:
1. Are the same length (21 days);
2. Cover the same period of the year almost
exactly (1-day difference);
3. Each features exactly 3 occurrences of each
day of the week;
4. Do not include public holidays (1 November),
only regular weekends.
In addition, to specifically address the impact of
schools’ activity on mobility, we also focused on the
hours 7:00-9:00 a.m., since the start time of the
schools under study is 8:00 a.m.
Figure 3: Schools' areas under study and main entrances.
ICSBT 2022 - 19th International Conference on Smart Business Technologies
146

2.3 The FCD Dataset
To the purpose of the study, an appropriate FCD
dataset was queried in order to extract meaningful
information on mobility changes.
Such dataset, acquired from a third-party provider
and constituted by FCD collected by private and
commercial vehicles equipped with an onboard GPS
device, comprises of two tables. The most significant
table is a collection of GPS records, each
corresponding to a specific probe vehicle’s position.
Each record contains a trip identifier, and all the
records with the same trip identifier are part of the
same trip. A trip is defined as a collection of GPS
records between two points where the vehicle
remained stationary for at least 5 minutes. The other
table of the dataset is constituted by records each
containing the start and end GPS position of each
identified trip, with additional information on the
distance covered during the trip as provided by the
vehicle’s odometer.
Each record of the main table of the dataset also
includes additional data other than the GPS position
(latitude and longitude) and the trip identifier; among
these additional data is the vehicle identifier, the
corresponding timestamp, the vehicles’ direction (0-
360), the vehicle type (private/commercial), and other
data related to the vehicle’s position, including the
address and the municipality.
To focus on the Modena case study, the dataset
only comprises the trips which have at least one GPS
record within the Modena Municipality in November
2019 and November 2021.
2.4 Mobility Indicators
To perform the FCD analysis, different queries were
devised to allow for the extraction of meaningful
mobility indicators relevant to the context (e.g.,
number of distinct vehicles, average distance per
trip), both on the whole of the Modena Municipality,
as it constitutes the baseline against which schools’
areas were compared, and the schools’ areas
themselves, as such areas constitute the main subject
of the analysis. In particular, we focused on the
number of distinct probe vehicles identified in each
area, as this is an indicator which might reflect traffic
density.
For each of the areas considered, all the queries
were executed separately for each time frame of
interest—namely, 9-29 November 2019 and 8-28
November 2021—averaging the results per each day
of the week and per the five-day school week
(Monday through Saturday). Since the FCD dataset
allows for a separate analysis of private and
commercial vehicles, we specifically focused on
private vehicles, due to the fact that hardly any
commercial vehicle may be associated to students’
home-to-school trips.
After extracting the data for the selected time
frames in 2019 and 2021, relative deltas were
calculated to compare the difference between the
most meaningful indicators in each area. As a result,
the deltas relevant to the schools’ areas could also be
compared to the deltas relevant to the Modena
Municipality.
Finally, we estimated the FCD penetration rate
both in 2019 and 2021 to evaluate its impact on the
resulting key mobility indicators.
3 RESULTS
3.1 Modena Municipality
To the purpose of focalising on the changes directly
related to schools’ activities, mobility changes around
schools were compared to the changes in the whole of
the Modena Municipality, whose FCD were analysed
specifically to build a baseline for comparison. As
previously stated, the municipality’s FCD were
analysed focusing between 7 and 9 am, as such time
slot is the most relevant to schools-related mobility,
being 8:00 am the start time for lessons for all the 3
selected schools.
Table 2 reports the number of distinct private
probe vehicles detected within the municipality of
Modena between 7 and 9 am, averaged from Monday
to Saturday over the time frames 9-29 November
2019 and 8-28 November 2021, and the resulting
delta between 2019 and 2021.
Table 2: Average daily distinct private probe vehicles
(Monday to Saturday, 7-9 am) within Modena
Municipality.
Area
Daily
average
2019
Daily
average
2021
Delta
2021/2019
Modena
Municipality
685.8 632.9 -8%
Results show that, within the Modena
Municipality, the number of distinct private probe
vehicles detected in 2021 is 8% lower than in 2019.
In addition, we also calculated the variation of the
total distance covered by all the private probe
vehicles in the same time frame, and also the average
Effects of the Coronavirus Pandemic on Youth Mobility: A Case Study Analysis through Floating Car Data
147

distance covered per vehicle, to the purpose of
detecting if such variations reflected that of the
number of distinct vehicles (Table 3).
Table 3: Deltas 2021/2019 of the average of total distance
covered and distance per vehicle relative to private probe
vehicles (Monday to Saturday, 7-9 am) within Modena
Municipality.
Area Total distance
(delta
2021/2019)
Distance per
vehicle (delta
2021/2019)
Modena
Municipalit
y
+14% +22%
The results show that the total distance travelled
by private probe vehicles in 2021 increased by 14%
on an average day between Monday to Saturday
between 7 and 9 am, and that the average travelled
distance per vehicle increased by 22%. Thus, in 2021
were detected 8% fewer private probe vehicles than
in 2019, but the total distance travelled by the
detected vehicles increased by 14%.
3.2 Schools’ Areas
The FCD detected within the 3 identified schools’
areas were analysed focusing between 7 and 9 am, as
such time slot is the most relevant to schools-related
mobility, being 8:00 am the start time for lessons for
all the 3 selected schools.
Table 4 reports the number of distinct private
probe vehicles detected within each of the 3 schools’
areas between 7 and 9 am, averaged from Monday to
Saturday over the time frames 9-29 November 2019
and 8-28 November 2021, and the resulting delta
between 2019 and 2021.
Table 4: Average daily distinct private probe vehicles
(Monday to Saturday, 7-9 am) within the schools’ areas.
Area Daily
average
2019
Daily
average
2021
Delta
2021/2019
Selmi and
Corni
10.3 9.2 -11%
Wiligelmo
and Guarini
19.7 19.0 -3%
Cattaneo-
Deledda
8.6 8.7 +1%
Results show that in 1 of the 3 schools’ areas the
number of distinct private probe vehicles detected in
2021 is around 1% higher than in 2019, whereas in
the other 2 schools’ areas the number decreased.
Within the area where the number decreased, only
that of Selmi and Corni (-11%) decreased more (and
only slightly so) than that of the whole Modena
Municipality (-8%), whereas in the Wiligelmo and
Guarini’s area the extent of the decrease is
considerably less noticeable (-3%) when compared to
the whole Modena Municipality (-8%).
3.3 FCD Penetration Rate
As previously mentioned, the FCD analysed in this
study might be used as a basis to estimate traffic
within the case study areas, which means we have to
first determine how many vehicles the employed FCD
actually represent. To this purpose, assuming that the
probe vehicles are uniformly distributed across the
network—even if this is not realistic in many cases—
we calculated the ratio of the probe vehicles (FCD
penetration rate), as suggested by Nagle and Gayah
(Nagle, 2014). More specifically, Nagle and Gayah
suggested to use such ratio to estimate network-wide
variables from FCD, also proposing to acquire the
ratio by dividing the number of vehicles tracked by
GPS in the analysis area for a specific time period to
the number of vehicles that crossed the fixed traffic
detectors in the same area and period. Traffic density
can be then estimated by multiplying the number of
vehicles detected with FCD in a specific area by the
reciprocal of the penetration rate of the FCD devices.
Although the FCD penetration rate can vary in
space and time, it must be noted that the mobility
indicators calculated in the previous sections were
averaged over a period of three weeks both in 2019
and 2021, thus limiting the impact of temporary
variations in the FCD penetration rate and, especially
regarding the indicators calculated for the Modena
Municipality, rate variation in space were smoothed
out by the considerable extension of the area of the
analysis.
Given the previous considerations, we estimated
the 2019 and 2021 FCD penetration rate related to the
area under study on the basis of the number of
vehicles that crossed the fixed traffic detector with
identification number 328, located around 3.5 km
south-west of the 5 schools under investigation on
SP486 road (Figure 4), on the peak day of November
2019 and November 2021 (13/11/2019 and
11/11/2021) .
To determine the FCD penetration rate we
identified all the trips that crossed the fixed traffic
detector on the monitored road section by analysing
on map the private probe vehicles’ GPS positions in
chronological order. We then divided the number of
identified trips by the traffic detected by the fixed
traffic detector, thus estimating the FCD penetration
rate both in 2019 and 2021 (Table 5).
ICSBT 2022 - 19th International Conference on Smart Business Technologies
148
Figure 4: Location of the fixed traffic detectors on road
SP486 with respect to the schools' area.
Table 5: Estimation of the 2019 and 2021 FCD penetration
rate for private vehicles on the monitored SP486 road
section.
Year Detected
traffic
FCD
traffic
FCD penetration rate
2019 26,294 195 0.85%
2021 25,389 184 0.82%
The difference between the estimated FCD
penetration rates in 2019 and 2021 does not appear to
be significant. This suggests that the deltas calculated
in the previous sections between the number of
detected private probe vehicles in the 3 schools’ areas
and the Modena Municipality in 2019 and 2021 could
effectively reflect the deltas between the real traffic
densities in the same areas, even if it is not possible
to draw such a conclusion from the sole comparison
of the estimates in one road section.
4 DISCUSSION
In this section, we discuss the results of the FCD
analysis and investigate the possible reasons behind
the difference between the mobility indicators
calculated within the Modena Municipality and the 3
selected schools’ areas, thus trying to answer the
research questions introduced at the beginning of this
chapter. We first address RQ1, and then RQ2.
RQ1. Does traffic near selected high schools in
2021 significantly differ from 2019?
As reported in Table 6, two out of the three
schools’ areas under investigation, namely Wiligelmo
and Guarini’s and Cattaneo-Deledda’s areas, do not
show a significant variation in the number of detected
distinct private probe vehicles from November 2019
to November 2021 (-3% and +1% respectively). This
would suggest that the traffic density around schools
in November 2021 grew back to the traffic density
characterizing the period before the COVID-19
pandemic. However, one out of the three schools’
areas, namely Selmi and Corni’s area, shows a
significant decrease in the number of detected private
probe vehicles in 2021 when compared to 2019 (-
11%), suggesting a noticeable decrease in private
vehicles traffic density within such area. As a
consequence, these results are further investigated
and discussed at the end of this section, so as to first
provide additional insights on the local context
through addressing the second research question.
Table 6: Average daily distinct private probe vehicles
(Monday to Saturday, 7-9 am) within the 3 selected
schools’ areas and Modena Municipality.
Area Daily
average
2019
Daily
average
2021
Delta
2021/2019
Wiligelmo
and Guarini
19.7 19.0 -3%
Cattaneo-
Deledda
8.6 8.7 +1%
Selmi and
Corni
10.3 9.2 -11%
Modena
Munici
p
alit
y
685.8 632.9 -8%
RQ2. How do the traffic changes near high
schools compare to traffic changes in the whole
Municipality of Modena in 2019 and in 2021?
As reported on Table 6, in the Municipality of
Modena the decrease in the number of detected
distinct private probe vehicles from November 2019
to November 2021 is around 8% and, therefore,
noticeably different from the results obtained within
Wiligelmo and Guarini’s and Cattaneo-Deledda’s
areas. Nevertheless, as previously mentioned, the
results from Selmi and Corni’s areas differ
considerably from those obtained around the other
schools’ areas, suggesting an even higher decrease in
traffic density than that detected in the whole
Municipality of Modena. This prompted a more in-
depth investigation into the local context to find
possible reasons that could explain such difference,
as Selmi and Corni’s 11% decrease in distinct private
(probe) vehicles could actually be due to many
factors, or a combination of them. Among the various
possible reasons, one could be that of an increased use
of personal mobility vehicles, such as e-scooters and
bikes/e-bikes, also considering that a nearby brand-
new bicycle route was inaugurated at the beginning
of October 2021—just one month before the time
frame investigated in 2021— which effectively
Effects of the Coronavirus Pandemic on Youth Mobility: A Case Study Analysis through Floating Car Data
149

connect Selmi and Corni schools to the Central
Station in a very convenient way. Such infrastructure
could have led many citizens that regularly move to
or from the areas crossed by the cycling route—thus
including the Selmi and Corni’s students—to rely on
personal mobility vehicles instead of private ICE
vehicles.
With regard to the RQ2, we must also highlight
the results concerning the total distance travelled by
private probe vehicles in 2019 and 2021 within the
Municipality of Modena (Table 7).
Table 7: Deltas 2021/2019 of the average of total distance
travelled and distance per vehicle relative to private probe
vehicles (Monday to Saturday, 7-9 am) within Modena
Municipality.
Area Total distance
(delta
2021/2019)
Distance per
vehicle (delta
2021/2019)
Modena
Municipalit
y
+14% +22%
As previously reported, the total distance
travelled by the detected vehicles increased by 14%,
with a 22% increase in the average travelled distance
per vehicle, but in 2021 8% fewer private probe
vehicles were detected than in 2019. These results
suggest that in 2021, even if the number of private
vehicles was lower than in 2019, not only each of
these vehicles covered a longer distance, but they all
together also travelled a longer distance (14%
variation). This might have led to a higher traffic
density within the Municipality of Modena on the
whole.
We must also remark that hypothesis such as the
one reported previously are based on the results from
the FCD Analysis, and thus should be further verified
with real traffic density data since, as previously
stated, the FCD penetration rate relative to the
analysed dataset is slightly lower than 1% and could
also vary considerably in space and time.
Nevertheless, the FCD analysis provides interesting
information which can be leveraged to further
investigate the local context and the related changes
in traffic density.
5 CONCLUSIONS
Floating Car Data refers to data collected directly by
a vehicle, typically covering its location and speed
(ECOSOC, 2021; Zannat, 2019). FCD has been used,
among others, to estimate the level of service on
traffic networks (Dailey, 2002), to investigate traffic
safety (Axer, 2013; Biral, 2021; Guido, 2012; Kerner,
2005; Vaiana, 2014), and to regulate traffic signals
(Astarita, 2017).
In this study, FCD has been used to attempt to
investigate the effects of the coronavirus pandemic on
mobility within the areas around five selected high
schools in the Italian Municipality of Modena and the
wider Municipality area. The mobility indicators
computed through the FCD analysis show that, from
November 2019 to November 2021, two out of the
three schools’ areas under investigation are not
associated to a significant variation in the number of
detected distinct private probe vehicles (-3% and
+1%), while in the Modena Municipality results show
a 8% decrease. Nevertheless, one out of the three
schools’ areas shows a significant decrease in 2021
(-11%), suggesting a noticeable decrease in private
vehicles traffic density which can be attributed to an
increased use of personal mobility vehicles, such as
e-scooters and bikes/e-bikes, also considering the
recent inauguration of a nearby brand-new bicycle at
the beginning of October 2021.
In addition, the number of detected vehicles in the
Municipality of Modena was lower in 2021 than in
2019, but the average distance covered by each
vehicle was longer (22% increase), as well as the total
distance covered by all the vehicles together (14%
increase). Even if further validation with real traffic
density data is needed to draw more detailed
conclusions, FCD proved to be able to provide
interesting information which can be leveraged to
investigate the mobility changes within specific
regions.
ACKNOWLEDGEMENTS
This article is based on work undertaken for the
project YOUMOBIL (CE1307), co-funded by the
European Regional Development Fund under
Interreg CENTRAL EUROPE.
REFERENCES
Altintasi, O., Tuydes-Yaman, H., & Tuncay, K. (2017).
Detection of urban traffic patterns from Floating Car
Data (FCD). Transportation research procedia, 22, 382-
391.
Astarita, V., Giofrè, V. P., Guido, G., & Vitale, A. (2017).
The use of adaptive traffic signal systems based on
floating car data. Wireless Communications and Mobile
Computing, 2017.
ICSBT 2022 - 19th International Conference on Smart Business Technologies
150

Axer, S., & Friedrich, B. (2013). Optimization of traffic
safety on rural roads by traffic data based strategies.
Proceedings of 13thWCTR.
Biral, F., Da Lio, M., & Bertolazzi, E. (2005). Combining
safety margins and user preferences into a driving
criterion for optimal control-based computation of
reference manoeuvres for an ADAS of the next
generation. In IEEE Proceedings. Intelligent Vehicles
Symposium, 2005. (pp. 36-41). IEEE.
Dailey, D. J., & Cathey, F. W. (2002). Virtual speed sensors
using transit vehicles as traffic probes. In Proceedings.
The IEEE 5th International Conference on Intelligent
Transportation Systems (pp. 560-565). IEEE.
Guido, G., Vitale, A., Astarita, V., Saccomanno, F., Giofré,
V. P., & Gallelli, V. (2012). Estimation of safety
performance measures from smartphone sensors.
Procedia-Social and Behavioral Sciences, 54, 1095-
1103.
Kerner, B. S., Demir, C., Herrtwich, R. G., Klenov, S. L.,
Rehborn, H., Aleksic, M., & Haug, A. (2005). Traffic
state detection with floating car data in road networks.
In Proceedings. 2005 IEEE Intelligent Transportation
Systems, 2005. (pp. 44-49). IEEE.
Lombardi, F. (2021). Covid, scuola, dad, quarantena: nuovo
protocollo. Classi a casa solo se ci sono 3 positivi. Il
Giorno. https://www.ilgiorno.it/cronaca/scuola-nuovo-
protocollo-covid-dad-quarantene-1.6985457" \l
"Elementari,%20medie%20e%20superiori:%20regole
%20diverse
Mena-Oreja, J., & Gozalvez, J. (2021). On the Impact of
Floating Car Data and Data Fusion on the Prediction of
the Traffic Density, Flow and Speed Using an Error
Recurrent Convolutional Neural Network. IEEE
Access, 9, 133710-133724.
Nagle, A. S., & Gayah, V. V. (2014). Accuracy of
networkwide traffic states estimated from mobile probe
data. Transportation Research Record, 2421(1), 1-11.
T Bridge S.p.A. (2022). Guidelines for the PT Decision
Makers on Smart Rural Transport Tools. Output o
project YOUMOBIL (CE1307), Activity T1.6
“Development of a toolbox for youth-oriented smart
rural transport solutions”.
United Nations Economic and Social Council (ECOSOC)
(2010). Monitoring the transport-related Sustainable
Development Goal indicators in the Economic
Commission for Europe region. (WP.6) Working Party
on Transport Statistics (72nd session).
Vaiana, R., Iuele, T., Astarita, V., Caruso, M. V., Tassitani,
A., Zaffino, C., & Giofrè, V. P. (2014). Driving
behavior and traffic safety: an acceleration-based safety
evaluation procedure for smartphones. Modern Applied
Science, 8(1), 88.
Zannat, K. E., & Choudhury, C. F. (2019). Emerging big
data sources for public transport planning: A systematic
review on current state of art and future research
directions. Journal of the Indian Institute of Science,
99(4), 601-619.
Effects of the Coronavirus Pandemic on Youth Mobility: A Case Study Analysis through Floating Car Data
151
