
Auctions and Estimates: Evidence from Indian Art Market
Shailendra Gurjar and Usha Ananthakumar
Shailesh J. Mehta School of Management, Indian Institute of Technology Bombay, India
Keywords: Presale Estimates, Art Auction, Indian Art Market, Incidental Truncation.
Abstract: We examine whether presale estimates of paintings by Indian artists are unbiased predictors of the hammer
price. Our analysis includes both sold and unsold artworks. Unbiasedness of estimates is tested by performing
a two-stage Heckit model on 5,077 artworks auctioned between 2000 and 2018. The results of our study show
that presale estimates are upward biased for expensive artworks and downward biased for others. In addition,
we also find that in the market for Indian paintings, characteristics of auction, artist, and artwork determine
the biasedness of estimates.
1 INTRODUCTION
On May 5, 2004, Picasso’s “Boy with a Pipe” created
the history by fetching US$ 104 million at Sotheby’s
auction in New Yok. Charles Moffet, then co-director
of Impressionist and modern art at Sotheby's,
described the painting as a masterpiece (“Picasso
painting sells for $104m,” 2004). On the other hand,
famed art critic Robert Hughes called “huge sums
paid to immature Rose Period Picasso a cultural
obscenity”(Kennedy, 2004). Such divergent views
about artworks and artists are not a recent phenomenon.
Back in 1863, the Paris Salon jury rejected The
Luncheon on the Grass, which is now one of the well-
known works of Edouard Manet (Spolsky, 1996). The
differences in opinions are caused due to subjectivities
involved in valuing a product for which the criteria of
valuation are not well defined (Beckert & Rossel,
2013; Velthuis, 2003). The complexities in valuation
accentuate since the quality of artworks is defined not
only by monetary value but also by cultural, aesthetic,
and social values (Klamer, 2004; Throsby & Zednik,
2014). The problems involved in determining the
quality of artworks have inspired a large body of
research from multiple disciplines, such as art history,
sociology, and economics. The economics of the art
market has witnessed a growing interest in the last two
decades. The interest is fuelled primarily due to the
availability of auction data and, to some extent, due to
the rapid growth in the art market and the appeal of art
as an alternative investment.
The extant research on the economics of art has
generally focused on three issues- determinants of
price (Galenson & Weinberg, 2000; Garay, 2020;
Renneboog & Spaenjers, 2013); returns on
investment in art (Baumol, 1986; Buelens &
Ginsburgh, 1993; Mei & Moses, 2002); and the
relationship between the auction price and presale
estimates (Ashenfelter & Graddy, 2003; Beggs &
Graddy, 1997; Ekelund, Jackson, & Tollison, 2013;
Mei & Moses, 2005). The focal point of this paper is
the last of the three issues, specifically whether
presale estimates are unbiased predictors of auction
price. While the literature on the first two issues has
found some uniform patterns, the debate on presale
estimates is far from settled. Milgrom & Weber
(1982) and Ashenfelter (1989) suggest that it is best
for auction houses to be honest and provide truthful
information to customers; therefore, presale estimates
are unbiased and reflect the true price of an artwork.
However, the later studies by Beggs and Graddy
(1997), Ekelund, Ressler, and Watson (1998),
Bauwens and Ginsburgh (2000), Mei and Moses
(2002), and Ashenfelter and Graddy (2003) provide
evidence for systematic under or overvaluation of
artworks by auction houses.
Rejecting the claims of biased estimates,
McAndrew, Smith, & Thompson (2012) argue that
since the previous studies do not take into account the
artworks that were unsold at auctions, the sample
used is not a random sample. Using both sold and
unsold artworks, they conclude that the estimation
bias observed in the previous studies can be attributed
to the sample selection bias. To verify the claims of
McAndrew, Smith, & Thompson (2012), Ekelund,
Jackson, & Tollison (2013) perform a two-stage
Heckit regression (Heckman, 1979) on artworks by
504
Gurjar, S. and Ananthakumar, U.
Auctions and Estimates: Evidence from Indian Art Market.
DOI: 10.5220/0011317200003269
In Proceedings of the 11th International Conference on Data Science, Technology and Applications (DATA 2022), pages 504-511
ISBN: 978-989-758-583-8; ISSN: 2184-285X
Copyright
c
2022 by SCITEPRESS – Science and Technology Publications, Lda. All rights reserved

American artists. They find that the presale estimates
are downward biased even after adjusting for the
sample selection, i.e., presale estimates
systematically underestimate the realized price.
In this study, we first test the biasedness of presale
estimates in the Indian art market by employing the
model specification suggested by Ekelund, Jackson, &
Tollison (2013). Next, we extend the model by
incorporating information about artists, artworks, and
auctions. Our research contributes to the literature in
the following ways- first, revisiting Ekelund, Jackson,
& Tollison (2013), we examine the findings of the
study, and second, by investigating the behaviour of
presale estimates in the Indian market, we provide a
much-needed perspective from a developing art market.
The rest of the paper is organized as follows. In
section 2, we provide a summary of prices in the
auction market. The data and methodology employed
by us are discussed in Section 3. In Section 4, we
present the results of this study. Finally, we discuss
our findings and conclude in Section 5.
2 AUCTION BACKGROUND
There are multiple prices in the auction market for
artworks – reserve price, hammer price, and purchase
price. The reserve price is the lowest price the owner
of artwork is willing to sell it for. The hammer price
is the final price fetched by the artwork at auction, and
the purchase price is the price a buyer finally pays to
the auction house. The purchase price includes the
hammer price plus taxes and commission paid by the
buyer. Before an auction, auction houses publish a
catalogue containing information about the artwork
and artist as well as presale low and high estimates.
These estimates provide a band around which the
auction house experts believe an artwork will be sold
for. However, these estimates are neither ceiling nor
floor price. It is possible that the realized price
(hammer price) is higher or lower than presale
estimates.
3 DATA AND METHODOLOGY
3.1 The Data
Our estimates are based on 5,077 paintings by 307
Indian artists for the period January 2000 and June
2018. The data is collected from Blouin Artinfo
(Blouin Artinfo), an online database of auction
records for fine art, design, decorative objects, etc.
The dataset contains the following information:
• Artist related characteristics: artist name.
• Artwork related characteristics: medium of
painting; dimensions of artworks; painting title.
• Auction related characteristics: name of the
auction house; year of auction; whether an
artwork was sold or not; the hammer price if sold;
presale estimates (low and high) of artworks.
In addition to the information provided in the dataset,
we have added the gender of artists, size of artwork
(height*width), living status at the time of the auction
(dead or alive), the reputation of an artist (computed as
per methodology suggested by Kraeussl & van
Elsland, 2008). In order to estimate the influence of
movement affiliation on price and estimates, we have
created a categorical variable "movement affiliation",
which is equal to 1 (yes) if an artist has been a part of
a well-known artistic movement; otherwise, 0 (no).
The prominent art movements in India and artist
association are selected from art history literature
(Brown, 2009; Kapur, 2000; Mitter, 2001). All prices
in the dataset- the hammer price, low estimate, high
estimate- are in USD and adjusted using US CPI 2018.
Out of 5,077 paintings, 3,139 were sold at auctions,
while 1,938 were "bought in", i.e., they were not sold.
3.2 Methodology
Let P
i
denote the hammer price of i
th
painting and
(P
Li
, P
Ui
) be its low and high presale estimates.
The presale estimates are unbiased if the
expected value of P
i
is equal to the mean of
estimates (P
AV
)
𝐸
𝑃
=𝑃
(1)
where,
𝑃
=
𝑃
+ 𝑃
2
(2)
However, the hammer price can be available for
the artworks that are sold; for those that are not sold,
we cannot witness the hammer price. By excluding
the artworks that were not sold from the analysis, we
may commit sample selection bias due to incidental
truncation (Wooldridge, 2013). Therefore, to account
for artworks that came to auctions but were not sold,
we use a two-stage Heckit model (Heckman, 1979).
In the first stage (selection equation), we fit a
probit model on the entire data, with sales status
(sold/unsold) as a dependent variable and average
estimates (P
AV
), painting title, gender of artists,
natural log of reputation score, natural log of artwork
area, medium of artwork, auction house name,
Auctions and Estimates: Evidence from Indian Art Market
505

movement affiliation, living status, and year of the
auction as independent variables. The categorical
variables in the model have the following categories
as reference: unsold for sales status, female for
gender, yes for painting title, oil on canvas for
medium, no for movement affiliation, Saffronart for
auction house name, and 2000 for the year of auction.
We use the Inverse Mills Ratio (IMR)- computed
from the first stage, in the second stage of the Heckit
model (output equation). The second stage is a
hedonistic OLS regression with natural log of
hammer price as a dependent variable and IMR as one
of the independent variables. However, in the second
stage, we use only those observations for which the
sales status is sold, i.e., only those artworks that were
sold at auction. For Heckit model to perform, the
independent variables used in the second stage must
be a subset of those in the first stage (except for IMR).
In the second stage, we specify two models. In the
first model, we use the average of estimates (P
AV
) and
IMR as independent variables. This model
corresponds to the model specified by Ekelund,
Jackson, & Tollison (2013). We think the hammer
price depends not only on the average price but also
on other characteristics variables. Therefore, in the
second model, we use all the characteristics variables
from stage 1, and IMR and P
AV
. The specifications
of the two models are as follows:
Model 1:
𝑙𝑛
𝑃
= 𝛽
+𝛽
𝑙𝑛
𝑃
,
+ 𝛽
(
𝐼𝑀𝑅
)
+𝜀
(3)
where, 𝛽
,𝛽
,𝑎𝑛𝑑 𝛽
are intercept, coefficient of the
natural log of P
AV
, coefficient of IMR respectively,
and 𝜀
is the error term. Eq. 3 can also be written as
𝑃
= exp (𝛽
)∗(𝑃
,
)
∗ exp ( 𝛽
∗
(
𝐼𝑀𝑅
)
+ 𝜀
)
(4)
Eq. 4 implies that P
AV
is an unbiased estimator of the
hammer price when β
0
= 0 and β
1
= 1. Furthermore,
when both β
0
and β
1
are greater than 1, P
AV
underestimate the hammer price. The joint test of
unbiasedness (β
0
= 0 and β
1
= 1) is measured by the F-
statistic. Ekelund, Jackson, & Tollison (2013) calls
the effect of β
0
a “multiplicative bias”, while β
1
is
designated as “proportional bias”.
Model 2:
𝑙𝑛
𝑃
= 𝛽
+𝛽
𝑙𝑛𝑃
,
+ 𝛽
(
𝐼𝑀𝑅
)
+
𝛽
,
𝑋
,
+ 𝛾
(5)
where, 𝛽
,𝛽
,𝑎𝑛𝑑 𝛽
are similar to model 1. X
i,j
is the
j
th
characteristic of painting i and 𝛽
,
is the
coefficient of X
i,j
;
𝛾
is the error term.
4 EMPIRICAL RESULTS
In this section, we present the findings of our study.
First, we present the result of the selection equation
(Table 1), and subsequently, we present findings of
model 1 and model 2 (Table 2 & 3). Since time effect
is found to be insignificant in Table 2, we have not
included in the table to keep tables concise. The
diagnostic plots for model 1 and 2 are shown in Figure
1 and 2. From plots it follows that models satisfy
assumptions of ordinary least square regression.
Table 1 indicates that the chances of artworks
getting sold at an auction increase by nearly 36%
when artists are affiliated with recognized art
movements. The chances of sell also increase with an
increase in the artist’s reputation as well as with an
increase in the area of artworks. On the other hand, an
increase in the average value of presale estimates and
artworks with certain mediums (Acrylic on Canvas
and Watercolour) decreases the probability of
artworks being sold. Other characteristics such as
auction house name, painting title, gender and living
status of artist do not have any impact on sales status.
Table 2 shows the result of model 1, i.e., replication
of the model by Ekelund, Jackson, & Tollison (2013).
Consistent with the authors, we also find that the joint
test of unbiasedness (β
0
= 0 and β
1
= 1) can be rejected
(F-statistic = 1.013e+04). The coefficient of intercept
is 0.87, which implies that auction houses
systematically underestimate by a multiplicative effect
of 138% (𝑒
.
−1). In agreement with Ekelund et al.
(2013), we also observe that the multiplicative bias is
greater than 1. However, our results indicate that the
proportional bias is less than 1 (0.95), while Ekelund et
al. (2013) found it to be greater than unity. It should be
noted that the inverse mill’s ratio (IMR) is statistically
significant at 0.001 level (Table 2). A significant IMR
suggests that errors in the selection and outcome
models are correlated. In other words, fitting a
regression model with only sold works will cause
sample selection bias. The results of model 2 are shown
in Table 3. This model includes variables from model
1, along with additional control variables. Similar to
model 1, we can reject rejected (F-statistic = 513 on 57
and 3081 DF) the joint test of unbiasedness (β
0
= 0 and
β
1
= 1). An important difference between model 1 and
model 2 is that the Inverse Mills Ratio (IMR) is
insignificant in model 2. This finding suggests that
when full information is used, the errors are not
correlated, and therefore, model 2 can very well be
estimated by OLS without correcting for sample
selection bias. The multiplicative and proportional
biases show similar behaviour as in model 1. In
addition, we observe that the characteristics of artists,
DATA 2022 - 11th International Conference on Data Science, Technology and Applications
506

artworks, auctions, and time effect also influence the
predictive power of estimates. For artist related
characteristics, the hammer price is generally greater
than the average estimates when the reputation score is
high. In other words, the artworks by highly reputed
artists on an average command a higher price than the
mean of estimates. We also witness gender differences.
Compared to female artists, the works of male artists
are underestimated. It suggests that buyers generally
pay higher than average estimates when the artist is a
male. Further, Artworks of artists who have not been
part of an art movement are overestimated. For artwork
related characteristics, our results show that the prices
are underestimated for paintings with a large area, and
for paintings that have titles. The medium of artwork
also determines the biasedness. In general, compared
to oil on canvas, acrylic leads to overestimation, but
tempera on card underestimates. While analyzing
auction related variables, we find that in comparison to
Saffronart, all other auction houses except Pundole’s
overestimate. Underestimation or overestimation is
also a function of time. Paintings sold during 2004-
2008 and 2010-2012 are underestimated compared to
paintings sold in the year 2000.
Table 1: Stage 1 of the Heckit model: Sample Selection Equation.
Variable estimates std erro
r
p
-value
(Intercept) 9.193 991.468 0.993
Painting Title: Yes 0.026 0.102 0.798
Gender: Male 0.077 0.153 0.615
Living Status: Alive -0.063 0.090 0.480
Movement Affiliation: No -0.438 0.102 0***
log(Artwork Area) 0.154 0.050 0.002**
log(Reputation) 0.416 0.073 0***
log(Average Estimate) -0.378 0.051 0***
Auction House
Artcurial -5.529 1721.708 0.997
Bonhams -4.952 1721.708 0.998
Christie's -4.912 1721.708 0.998
Osian's -3.713 200.468 0.985
Othe
r
-3.448 1721.708 0.998
Pundole's 4.211 0.218 0***
Sotheby's -4.047 1721.708 0.998
Artwork Mediu
m
Acrylic on Boar
d
-0.222 0.587 0.705
Acrylic on Canvas -0.374 0.120 0.001**
Acrylic on Pape
r
-0.438 0.323 0.174
Acrylic on Tarpaulin -4.866 1138.869 0.997
Mixe
d
Media o
n
Boar
d
-0.414 0.677 0.541
Mixe
d
Media o
n
Canvas -0.269 0.255 0.291
Oil an
d
Acrylic on Canvas -0.137 0.451 0.761
Oil o
n
Boar
d
0.267 0.186 0.151
Oil o
n
Line
n
-0.006 0.913 0.995
Oil o
n
Masonite 0.256 0.468 0.585
Oil o
n
Masonite Boar
d
-0.277 0.930 0.766
Oil o
n
Panel -0.197 0.443 0.657
Oil o
n
Pape
r
-0.575 0.546 0.292
Tempera o
n
Boar
d
-4.917 166.213 0.976
Tempera o
n
Canvas 0.812 0.467 0.082
Tempera o
n
Car
d
0.230 0.332 0.490
Tempera o
n
Pape
r
0.084 0.391 0.829
Watercolo
r
-1.291 0.600 0.031*
Othe
r
-Acrylic -0.971 0.215 0***
Othe
r
-Gouache -0.508 0.552 0.357
Othe
r
-Mixe
d
0.260 0.350 0.457
Othe
r
-Oil -0.216 0.187 0.246
Othe
r
-Tempera 0.529 0.336 0.116
All othe
r
-0.581 0.219 0.007**
Null deviance 6751.4
Residual deviance 1294.9
AIC 1420.9
Note:
∗
p < 0.05;
∗∗
p < 0.01;
∗∗∗
p
<
0.001
Auctions and Estimates: Evidence from Indian Art Market
507
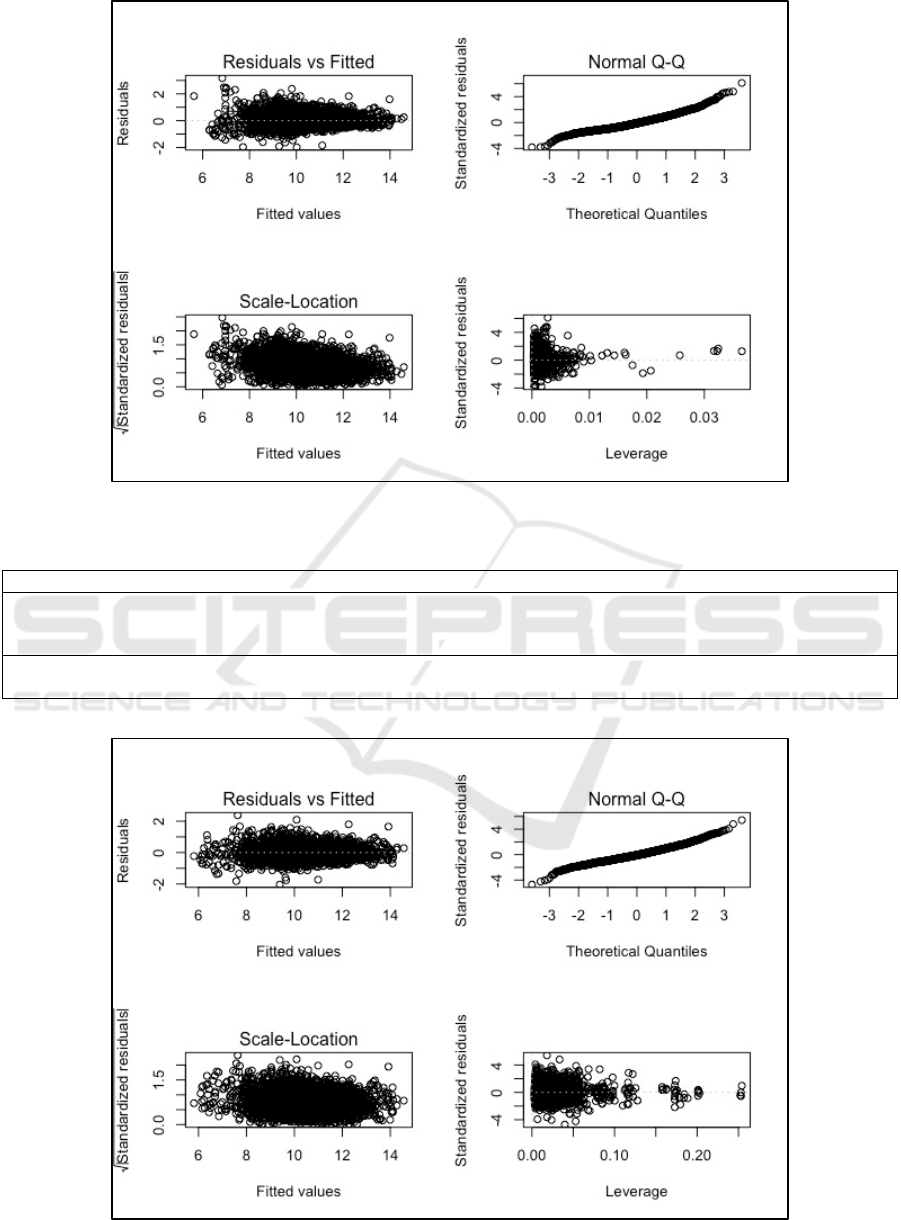
Figure 1: Regression diagnostic plots for model 1.
Table 2: Stage 2 of the Heckit model for model 1 (Eq. 3).
Variable estimates std erro
r
p
-value
(
Interce
p
t
)
0.870 0.068 2E-14***
log(Average Estimate) 0.947 0.006 2E-14***
Inverse Mills Ratio
(
IMR
)
-0.349 0.030 2E-14***
Ad
j
usted R-s
q
uare
d
0.865
F-statistic 1.013e+04
Note:
∗
p < 0.05;
∗∗
p < 0.01;
∗∗∗
p
<
0.001
Figure 2: Regression diagnostic plots for model 2.
DATA 2022 - 11th International Conference on Data Science, Technology and Applications
508

Table 3: Stage 2 of the Heckit model for model 2 (Eq. 5).
Variable estimates std erro
r
p-value
(Intercept) 1.161 0.103 0***
log(Average Estimate) 0.740 0.011 0***
IMR -0.071 0.062 0.249
Painting Title: Yes 0.055 0.019 0.003**
Gender Male 0.092 0.030 0.002**
Living Status: Alive -0.028 0.019 0.147
Movement Affiliation: No -0.325 0.022 0***
log(Artwork Area) 0.114 0.010 0***
log(Reputation) 0.296 0.015 0***
Auction House
Artcurial -0.214 0.066 0.001**
Bonhams -0.187 0.038 0***
Christie's -0.115 0.027 0***
Osian's -0.394 0.033 0***
Pundole's 0.629 0.094 0***
Sotheby's -0.186 0.025 0***
Othe
r
-0.067 0.043 0.115
Artwork Medium
Acrylic on Board -0.293 0.094 0.001**
Acrylic on Canvas -0.110 0.025 0***
Acrylic on Pape
r
-0.314 0.061 0***
Acrylic on Tarpaulin -0.013 0.199 0.946
Mixed Media on Board -0.179 0.129 0.166
Mixed Media on Canvas 0.020 0.072 0.784
Oil and Acrylic on Canvas -0.098 0.088 0.266
Oil on Board 0.125 0.032 0.***
Oil on Linen -0.196 0.222 0.376
Oil on Masonite 0.078 0.077 0.313
Oil on Masonite Board 0.107 0.183 0.560
Oil on Panel -0.104 0.120 0.389
Oil on Pape
r
-0.175 0.083 0.035*
All othe
r
-0.125 0.052 0.015*
Othe
r
-Acrylic -0.200 0.052 0**
Othe
r
-Gouache -0.170 0.135 0.211
Othe
r
-Mixed -0.067 0.102 0.509
Othe
r
-Oil -0.023 0.040 0.558
Othe
r
-Tempera -0.095 0.081 0.242
Watercolo
r
0.022 0.148 0.881
Tempera on Board -0.133 0.182 0.466
Tempera on Canvas 0.084 0.070 0.233
Tempera on Card 0.224 0.064 0***
Tempera on Pape
r
0.124 0.069 0.074
Year of Auction
2001 0.144 0.094 0.126
2002 0.080 0.079 0.314
2003 0.044 0.068 0.514
2004 0.444 0.058 0***
2005 0.826 0.057 0***
2006 0.949 0.059 0***
2007 0.810 0.062 0***
2008 0.391 0.164 0.017*
2009 0.346 0.229 0.130
2010 0.449 0.130 0***
2011 0.763 0.184 0***
2012 0.671 0.127 0***
2013 0.067 0.115 0.560
2014 0.130 0.109 0.233
2015 0.146 0.107 0.172
2016 -0.035 0.114 0.761
2017 0.069 0.116 0.554
2018 0.178 0.140 0.204
Adjusted R-squared 0.903
F-statistic 513
Note:
∗
p < 0.05;
∗∗
p < 0.01;
∗∗∗
p
<
0.001
Auctions and Estimates: Evidence from Indian Art Market
509

5 CONCLUSIONS
This study investigates whether presale estimates are
a good predictor of hammer price in the Indian art
market. We use the methodology employed by
Ekelund, Jackson, & Tollison (2013). In their study,
Ekelund, Jackson, & Tollison (2013) argue that
presale estimates consistently underestimate the
hammer price due to both multiplicative and
proportional bias. However, at least in the Indian
market, while multiplicative bias underestimates, the
proportional bias seem to overestimate very
expensive paintings. The joint effect of both the bias
shows that the underestimation happens till the
hammer price is below or equal to US$ 14,357,640;
beyond US$ 14,357,640, the price is overestimated.
This finding is consistent with results of Mei & Moses
(2005), who showed that auction houses
overestimates expensive artworks.
We also find that the characteristics of artwork,
artist, and auction determine the biasedness of
estimates. In agreement with Ashenfelter & Graddy
(2003), our findings also suggest that paintings with
a large area are underestimated. One of the significant
findings of our research is that auction houses do not
follow the same strategy for estimation. Two auction
houses in our study – Saffronart and Pundole's seem
to be more inclined to overestimate, but the rest often
underestimate. In their study, Bauwens & Ginsburgh
(2000) have also noted that the Christie's and
Sotheby's follow different approaches to
under/overestimate.
A systematic underestimation for artists with
higher reputation indicates that buyers are willing to
pay higher than estimates for famous and well-
established artists; however, it is surprising to note
that buyers are more willing to pay higher than
estimates for male artists but not for female artists.
We are curious to know whether the gender-based
differentiation is peculiar to India or prevalent
universally. We have not answered many other
questions in this research, e.g., the biasedness of
estimates in physical vs. online auctions. We hope
future researchers will address these questions.
REFERENCES
Ashenfelter, O. (1989). How auctions work for wine and
art. Journal of Economic Perspectives, 3, 23–36.
Ashenfelter, O., & Graddy, K. (2003). Auctions and the
Price of Art. Journal of Economic Literature,
XLI(September), 763–786.
Baumol, W. (1986). Unnatural Value: Or Art Investment as
Floating Crap Game. American Economic Review,
76(2), 10–14.
Bauwens, L., & Ginsburgh, V. A. (2000). Art experts and
auctions: Are pre-sale estimates unbiased and fully
informative? Louvain Economic Review, 66(2), 131–
144.
Beckert, J., & Rossel, J. (2013). The Price of Art. European
Societies, 15(2), 178–195.
Beggs, A., & Graddy, K. (1997). Declining Values and the
Afternoon Effect : Evidence from Art Auctions. The
RAND Journal of Economics, 28(3), 544–565.
Retrieved from https://www.jstor.org/stable/2556028
Blouin Artinfo. (n.d.).
Brown, R. M. (2009). Art for a Modern India, 1947-1980.
Durham: Duke University Press.
Buelens, N., & Ginsburgh, V. (1993). Revisiting Baumol’s
“art as floating crap game.” European Economic
Review, 37(7), 1351–1371. https://doi.org/10.1016/
0014-2921(93)90060-N
Ekelund, R. B., Jackson, J. D., & Tollison, R. D. (2013).
Are Art Auction Estimates Biased? Southern Economic
Journal, 80(2), 454–465. https://doi.org/10.4284/0038-
4038-2012.087
Ekelund, R. B., Ressler, R. W., & Watson, J. K. (1998).
Estimates, bias and “no sales” in Latin-American art
auctions 1977–1996. Journal of Cultural Economics,
22, 33–42.
Galenson, D. W., & Weinberg, B. A. (2000). Age and
Quality of Work: The Case of Modern American
Painters. Journal of Political Economy, 108(4), 761–
777.
Garay, U. (2020). Determinants of art prices and
performance by movements : Long-run evidence from
an emerging market. Journal of Business Research.
https://doi.org/10.1016/j.jbusres.2019.03.057
Heckman, J. J. (1979). Sample Selection Bias as a
Specification Error. Econometrica, 47, 153–161.
Kapur, G. (2000). When Was Modernism: Essays on
Contemporary Cultural Practice in India. New Delhi:
Tulika.
Kennedy, M. (2004). Art market “a cultural obscenity.”
Retrieved April 21, 2022, from https://www.the
guardian.com/uk/2004/jun/03/arts.artsnews
Klamer, A. (2004). Cultural Goods Are Good for More than
Their Economic Value. In V. Rao & M. Walton (Eds.),
Culture and Public Action (pp. 138–162). Stanford:
Stanford University Press.
Kraeussl, R., & van Elsland, N. (2008). Constructing the
True Art Market Index - A Novel 2-Step Hedonic
Approach and its Application to the German Art Market
(CFS Working Paper Series.). Retrieved from
http://ssrn.com/abstract=1104667
McAndrew, C., Smith, J. L., & Thompson, R. (2012). The
Impact of Reserve Prices on the Perceived Bias of
Expert Appraisals of Fine Art. Journal of Applied
Econometrics, 27, 235–252. https://doi.org/10.1002/jae
Mei, J., & Moses, M. (2002). Art as an investment and the
underperformance of masterpieces. American
DATA 2022 - 11th International Conference on Data Science, Technology and Applications
510

Economic Review, 92(5), 1656–1668. https://doi.org/
10.1257/000282802762024719
Mei, J., & Moses, M. (2005). Vested Interest and Biased
Price Estimates: Evidence from an Auction Market. The
Journal of Finance, 60(5), 2409–2435.
Milgrom, P., & Weber, R. (1982). A theory of auctions and
competitive bidding. Econometrica, 50, 1089–1122.
Mitter, P. (2001). Indian Art. Oxford: Oxford University
Press.
Picasso painting sells for $104m. (2004). Retrieved April
21, 2022, from http://news.bbc.co.uk/2/hi/entertain
ment/3682127.stm
Renneboog, L., & Spaenjers, C. (2013). Buying Beauty :
On Prices and Returns in the Art Market. Management
Science, 59(1), 36–53.
Spolsky, E. (1996). Elaborated Knowledge: Reading
Kinesis in Pictures. Poetics Today, 17(2), 157–180.
Throsby, D., & Zednik, A. (2014). The Economic and
Cultural Value of Paintings: Some Empirical Evidence.
In V. A. Ginsburgh & D. Throsby (Eds.), Handbook of
the Economics and Culture (pp. 81–99). Elsevier.
Velthuis, O. (2003). Symbolic Meanings of Prices:
Constructing the Value of Contemporary Art in
Amsterdam and New York Galleries. Theory and
Society, 32(2), 181–215.
Wooldridge, J. M. (2013). Introductory Econometrics: A
Modern Approach (5th ed.). Mason, OH: South-
Western, Cengage Learning.
Auctions and Estimates: Evidence from Indian Art Market
511
