
Automatic UML Defects Detection based on Image of Diagram
Murielle Souvenir Lokonon
1
and Vinasetan Ratheil Houndji
2 a
1
Ecole Polytechnique d’Abomey Calavi (EPAC), University of Abomey Calavi (UAC), Abomey-calavi, Benin
2
Institut de Formation et de Recherche en Informatique (IFRI), University of Abomey Calavi (UAC), Abomey-calavi, Benin
Keywords:
UML, Use Case Diagram, Machine Learning, Computer Vision.
Abstract:
Unified Modeling Language (UML) is a standardized modeling language used to design software systems.
However, software engineering learners often have difficulties understanding UML and often repeat the same
mistakes. Several solutions automatically correct UML diagrams. These solutions are generally restricted
to the modeling tool used or need teachers’ intervention for providing exercises, answers, and other rules to
consider for diagrams corrections. This paper proposes a tool that allows the automatic correction of UML
diagrams by taking an image as input. The aim is to help UML practicers get automatic feedback on their
diagrams regardless of how they have represented them. We have conducted our experiments on the use case
diagrams. We have first built a dataset of images of the most elements encountered in the use case diagrams.
Then, based on this dataset, we have trained some machine learning models using the Detectron2 library
developed by Facebook AI Research (FAIR). Finally, we have used the model with the best performances and
a predefined list of errors to set up a tool that can syntactically correct any use case diagram with relatively
good precision. Thanks to its genericity, the use of this tool is easier and more practical than the state-of-the-art
UML diagrams correction systems.
1 INTRODUCTION
The Unified Modeling Language (UML), standard-
ized by the Object Management Group (OMG) in
1996, aims to integrate the concepts and notations
used in the most important software engineering mod-
eling language. UML is today widely used by the
software development community at large(Wegmann
and Genilloud, 2000). It has thus become part of most
software engineering curricula at universities world-
wide. Its learning is rather difficult for beginners.
There are solutions that automatically correct
learners’ UML diagrams, syntactically as well as se-
mantically. Syntactically, some solutions correct dia-
grams based on predefined solutions with a reference
diagram elements comparison to learner’s elements
diagrams (Hoggarth and Lockyer, 1998; Thomas,
2013; Soler et al., 2010; Haji Ali et al., 2007) or
again by label matching or structure matching (Vach-
harajani and Pareek, 2014; Vachharajani et al., 2012).
Others make corrections based on predefined crite-
ria (Hasker and Rowe, 2011; ONDIK, 2016; Striewe
and Goedicke, 2011; Thomas et al., 2008) or by us-
ing both methods (Correia et al., 2017; Hasker, 2011).
a
https://orcid.org/0000-0002-5467-9448
For semantics correction, one can mention (Dolques
et al., 2012) which uses Formal Concept Analysis and
Relational Concept Analysis to correct diagrams. Un-
fortunately, these solutions are limited to the model-
ing tool used (their own or IBM’s tools, used in enter-
prise but less common in the academic environment)
or require teacher intervention to provide exercises,
solutions, and other rules to consider when correcting
diagrams.
In this paper, we propose a generic UML diagrams
syntax correction system based on an image of the
diagram. To show the effectiveness of our approach,
we consider the use case diagrams that represent the
functional requirements of a system.
In the remainder of this paper, section 2 discusses
the related works on automatic UML diagrams mod-
eling correction, section 3 talks about our approach
and presents our system architecture, section 4 pro-
vides the obtained results, and the section (section 5)
concludes.
Lokonon, M. and Houndji, V.
Automatic UML Defects Detection based on Image of Diagram.
DOI: 10.5220/0011316900003277
In Proceedings of the 3rd International Conference on Deep Learning Theory and Applications (DeLTA 2022), pages 193-198
ISBN: 978-989-758-584-5; ISSN: 2184-9277
Copyright
c
2022 by SCITEPRESS – Science and Technology Publications, Lda. All rights reserved
193
2 STATE-OF-THE-ART
Several works exist to ease UML modeling learning.
For example, (Hasker and Rowe, 2011) has imple-
mented the tool U mlInt that syntactically corrects use
case and class diagrams of learners to provide them
feedback on their modeling so they can avoid some
common errors. Learners submit a generated model
with IBM’s Rational Rose modeling tool via a web
platform. UmlInt then analyzes it to check some
predefined errors. Another example is (Striewe and
Goedicke, 2011), which integrates a modeling soft-
ware and uses teachers’ defined rules for each exer-
cise to correct learners’ class diagrams. We have also
(ONDIK, 2016) that allows for correcting previously
fixed errors in some UML diagrams. For each error
to correct, rules have to be set up. The rules contain
a verification expression, which checks the validity of
the specified element attribute and the error message
to be displayed. The solution was implemented as an
extension of the modeling tool named Sparx Enter-
prise Architect.
The tool Kora proposed in (Correia et al., 2017)
allows students to correct any UML diagram mod-
eling exercise based on a predefined basic solution.
It corrects syntactically and semantically UML dia-
grams. Indeed it works on a graph comparison sys-
tem. Once the student has finished and submitted
his modeling at the interface level, Kora transforms
it into a graph and syntactically corrects it based on a
set of rules. Kora semantically corrects the diagram
by comparison to a basic solution (also under a graph
form) and then returns a set of differences. Other
works like (Hoggarth and Lockyer, 1998), (Hasker,
2011), (Vesin et al., 2018), (Vachharajani and Pareek,
2014), (Thomas, 2013), and (Thomas et al., 2008)
perform UML diagrams syntax correction based on
predefined errors or rules. On the other hand, the tool
presented in (Soler et al., 2010) is an online class di-
agrams modeling learning platform. For each exer-
cise, the teacher provides an attributes list and a set of
possible correct solutions. The teacher defines all the
classes, attributes, associations, relations, multiplic-
ities, and directions of the arrows (unidirectional or
bidirectional). Correction is based on these elements
checking by using attribute names.
To the best of our knowledge, state-of-the-art tools
ask for some restrictions. Some require teachers to fill
out answers to the exercises or rules. Others require
some programming knowledge to provide the rules.
This paper proposes a solution based on the image of
the diagram that is more accessible to learners.
3 OUR APPROACH
We propose a generic tool to syntactically correct
UML use case diagrams only based on their images.
Our process has three main steps: 1) use case di-
agrams elements detection, 2) connected elements
identification, and 3) diagrams correction based on
UML rules. We explain each step in the rest of this
section.
3.1 Use Case Diagrams Elements
Detection
We have established a list of main elements encoun-
tered in use case diagrams:
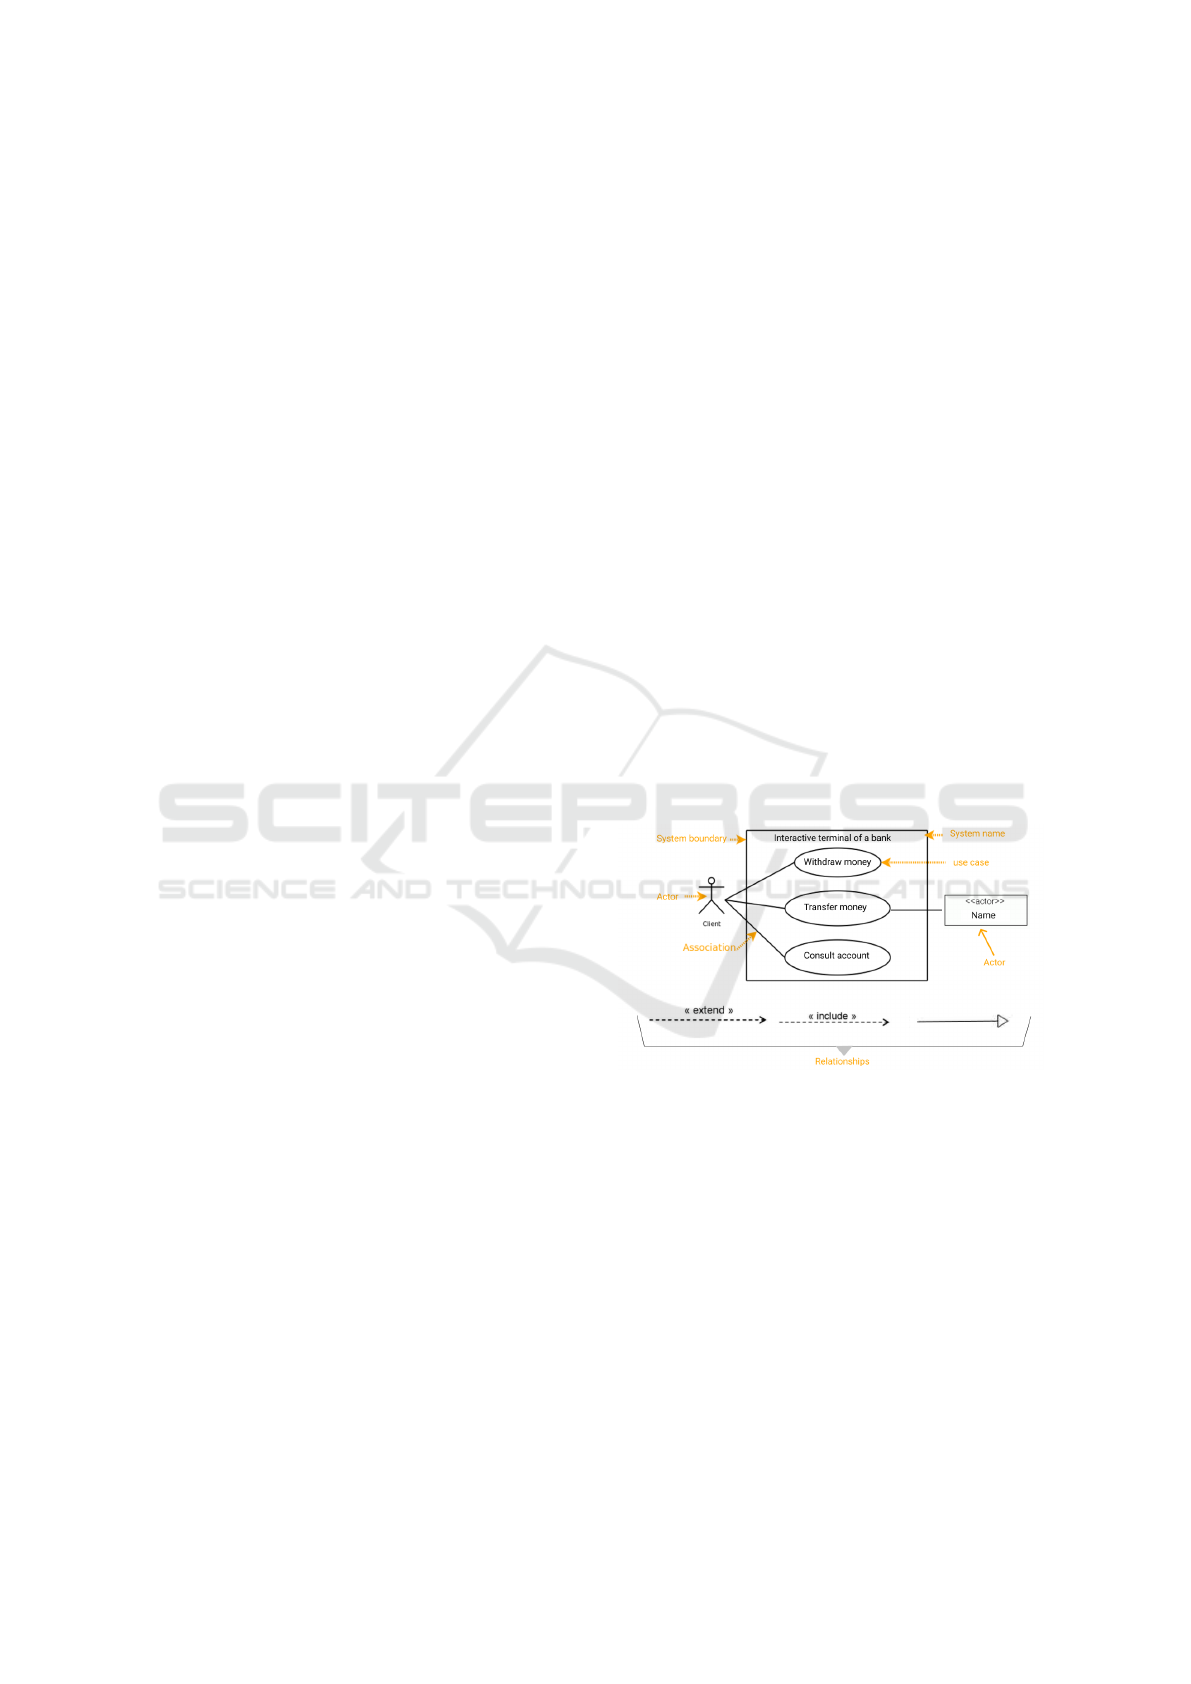
• use cases, represented by ellipses,
• actors, represented by stick figures and rectangles
with actor stereotype,
• system, represented by a large rectangle,
• associations, represented by simples lines, and
• relationships, represented by dotted arrows (in-
clude and exclude relationships) and solid lines
arrows (generalization relationships).
Figure 1 illustrates these elements.
Figure 1: Use case diagrams elements.
Firstly, we detect some of these elements (actors,
use cases, and arrows) by completing a data collec-
tion campaign and collecting images on the internet
to generate a dataset and build a detection model. We
had 699 images of use case diagrams and their el-
ements at the end of this collection. After annota-
tion, preprocessing (gray levels, automatic contrast
adjustment, resizing 416 x 416, and automatic im-
age orientation), and augmentation (rotation, varia-
tion of the brightness between -25% and +25%, blur-
ring and noise introduction) of these images with the
Roboflow platform, we obtained 1691 images for our
dataset, We then divided 70% of the images in the
training set, 20% of the images in the validation set
DeLTA 2022 - 3rd International Conference on Deep Learning Theory and Applications
194
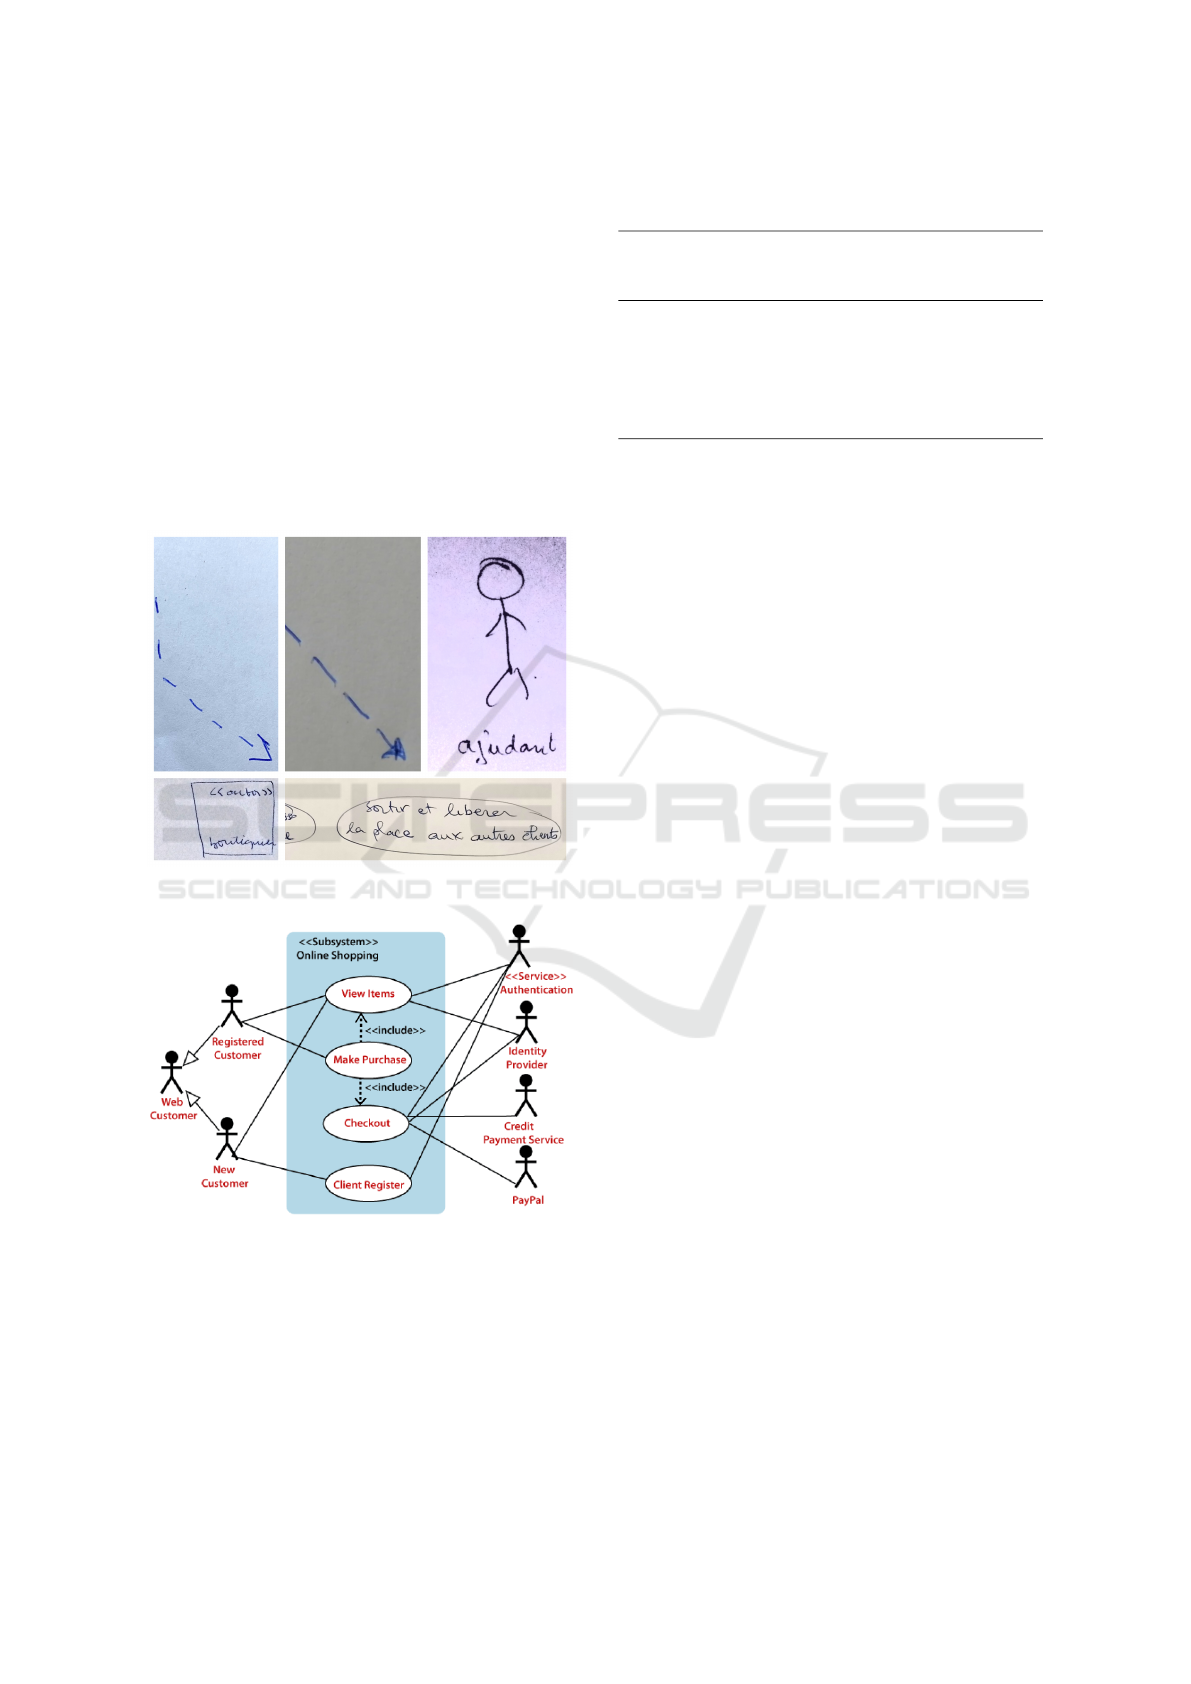
and the 10% remaining images in the test set. Using
computer vision detection models of Detectron2 (Wu
et al., 2019), a Facebook AI Research (FAIR) library,
we performed training on the dataset and selected the
best model. With this model, we are able to correctly
detect use cases and the two different types of actors.
To detect arrowheads, we have used the same way
as stated previously (data collection, annotation, pre-
processing , augmentation and dispatching in train-
ing, test and validation sets) to set up a second dataset
(constitued of open and closed arrowheads presented
on Figure 1) and to build another model. Figures 2
and 3 show some collected images samples and table
1 shows data distribution in our different datasets.
Figure 2: Data collection campaign images samples.
Figure 3: Internet collected image sample.
We have used the OpenCV function HoughLinesP
for the lines detection. It returns the coordinates of
the two extreme points of each line detected as a list.
Note that we have performed some preprocesses on
our images to improve line detection. To avoid con-
sidering lines contained in actors, use cases, and text
representations, we hide these elements on the image
Table 1: Datasets constitution.
Datasets Training
set
Validation
set
Test set
Components 1488 im-
ages
138 im-
ages
65
images
Arrowheads 603 im-
ages
50 images 27
images
sent to the function. We have found that, in general,
the function detects one line in several (they are all
overlapped, just the lengths differ). We have merged
the overlapped lines by using reduced equations of de-
tected lines notion to solve this problem.
With arrowheads and lines detected, the next step
is to determine which are linked and formed arrows.
We have calculated the euclidean distance between ar-
rowhead centers and endpoints of each line. An ar-
rowhead is linked to the line which has a point with
the smallest euclidean distance. Lines that are not
linked to any arrowhead are considered simple lines
except the four that form the system and are identi-
fied by checking line intersections angles.
3.2 Connected Elements Identification
We have determined a list of connected elements by
arrows and connected elements by lines. Knowing
use case diagrams elements (use cases and actors)
and arrowhead boundaries, we have calculated the eu-
clidean distance between the arrowhead center and
each element center to find out which element is con-
nected to an arrowhead. An element is connected
to an arrowhead if the euclidean distance calculated
from its center is the smallest. An arrowhead and a
line represent an arrow. Moreover, knowing the inter-
section point between an arrowhead and a line, we can
deduce the arrow tail point. To identify the connected
element to that point, we also proceed by euclidean
distance calculations. Here, it is calculated between
the arrow tail point and each point representing ele-
ments centers. The selection principle is the same as
before. We use the same method to detect connected
elements to two extreme points of simple lines. We
calculate the euclidean distances between them and
each element’s center for each of these points.
3.3 Diagrams Correction
We make syntax corrections of use case diagrams
based on predefined rules. Predefined rules on which
Automatic UML Defects Detection based on Image of Diagram
195

our correction is based are taken from (AUDIBERT,
2006; Hasker and Rowe, 2011):
1. Actors’ names must start with a capital letter, be
unique, and be a name.
2. Actors must be outside the system.
3. Always put the system name and not let default
names proposed by the modeling tools.
4. Actors must be linked to at least one use case and
vice versa.
5. Association between actor and use case is repre-
sented by a simple line.
6. Association between two actors is represented by
a generalization arrow.
7. Association between two use cases is represented
by either a generalization arrow, an include rela-
tion or an exclude relation.
8. Generalization relation must be well used. For ex-
ample, if there is a generalization relation between
two actors and we see that they are still linked to
the same use cases, there is an error.
Figure 4 summarizes the different steps followed
by our system to correct the use case diagrams.
Figure 4: The correction process.
4 RESULTS
4.1 Use Case Diagram Elements
Detection
To perform training on our first dataset, we have used
four models: Faster R-CNN X101-FPN, Faster R-
CNN R101-FPN, Faster R-CNN R101-C4, and Reti-
naNet R101-FPN of Detectron2 library. Moreover, to
evaluate our models, we have used three (03) metrics
of Microsoft Common Objects in Context: the aver-
age precision (AP), the average precision for an IoU
of 0.50 (AP
50
), the average precision for an IoU of
0.75 (AP
75
), and the respective average precision of
each class. Intersection over union (IoU) is known
to be a good metric for measuring overlap between
two bounding boxes or masks. Based on the results
of the training presented in Table 2, we choose Faster
R-CNN R101-FPN model for use cases and actors de-
tection. As mentioned above, we go through arrow-
heads and line detection to detect arrows. To perform
training on our arrowheads dataset, we used the same
metrics and four models used on our first dataset.
Based on the results of this training presented in Table
3, we choose the Faster R-CNN X101-FPN model for
arrowheads detection.
Table 2: Results obtained on test set of first dataset.
Used
models
AP AP
50
AP
75
AP
use
cases
AP
ac-
tors
AP
dot-
ted
ar-
rows
Faster
R-CNN
X101-
FPN
0.592 0.915 0.693 0.763 0.650 0.362
Faster
R-CNN
R101-
FPN
0.641 0.944 0.749 0.771 0.697 0.456
Faster
R-CNN
R101-C4
0.577 0.892 0.697 0.680 0.684 0.366
RetinaNet
R101-
FPN
0.601 0.916 0.695 0.744 0.677 0.382
Table 3: Results obtained on test set of second dataset.
Used
models
AP AP
50
AP
75
AP
closed
ar-
row-
head
AP
open
ar-
row-
head
Faster
R-CNN
X101-
FPN
0.354 0.762 0.255 0.427 0.281
Faster
R-CNN
R101-
FPN
0.311 0.718 0.182 0.398 0.224
Faster
R-CNN
R101-C4
0.261 0.664 0.130 0.360 0.162
RetinaNet
R101-
FPN
0.325 0.684 0.260 0.420 0.230
DeLTA 2022 - 3rd International Conference on Deep Learning Theory and Applications
196
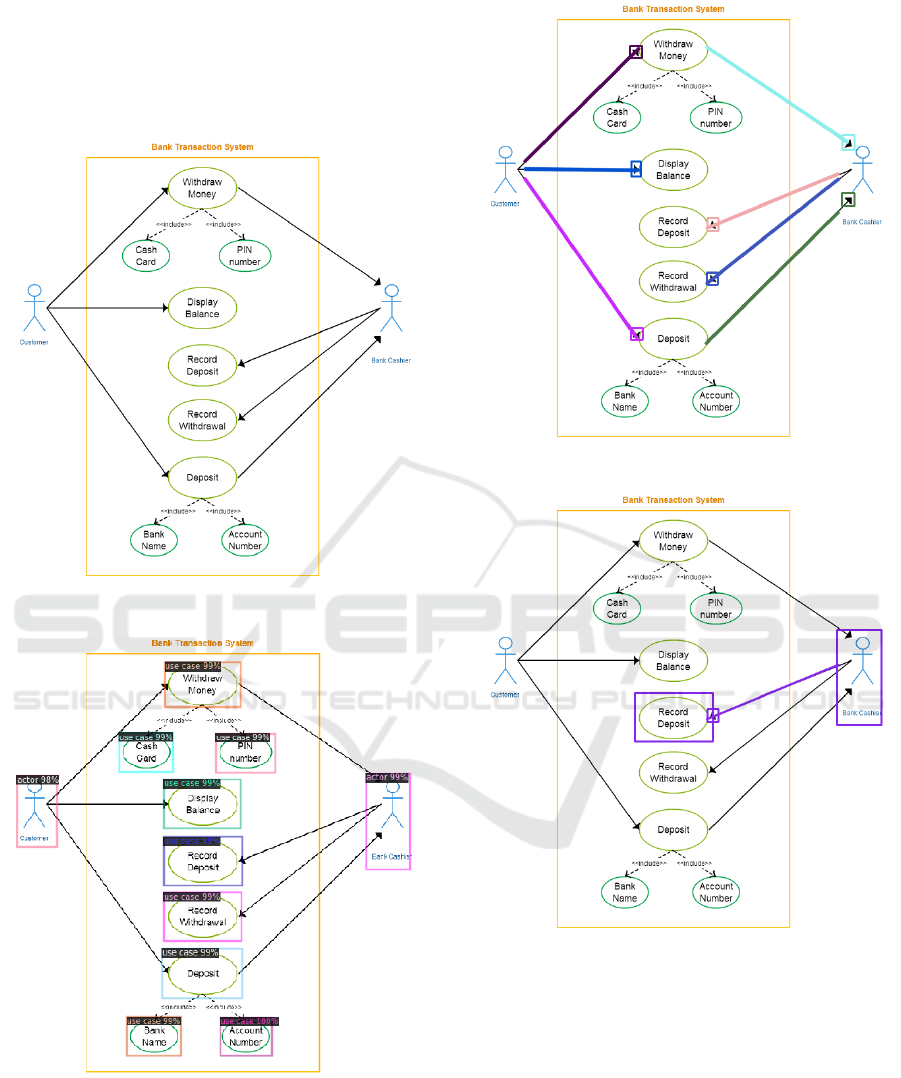
Figure 6 shows an example of use cases and ac-
tors detection, and Figure 7 illustrates results of our
arrows identification process on a test use case dia-
gram (Figure 5) obtained through Google Image and
used to present our results.
Figure 5: Use case diagram used for test.
Figure 6: Use cases and actors detection.
4.2 Connected Elements Identification
With our connected elements identification process
(explained previously), Figure 8 shows an example of
this identification after implementation.
Figure 7: Arrows identification example.
Figure 8: Connected elements identification example.
4.3 Correction
Among rules mentioned previously, we are now able
to check those concerning different associations be-
tween elements (rules 5, 6, and 7). Figure 10 shows
the result of our correction based on use cases and ac-
tors annotation of test use case diagram presented in
Figure 9.
Automatic UML Defects Detection based on Image of Diagram
197
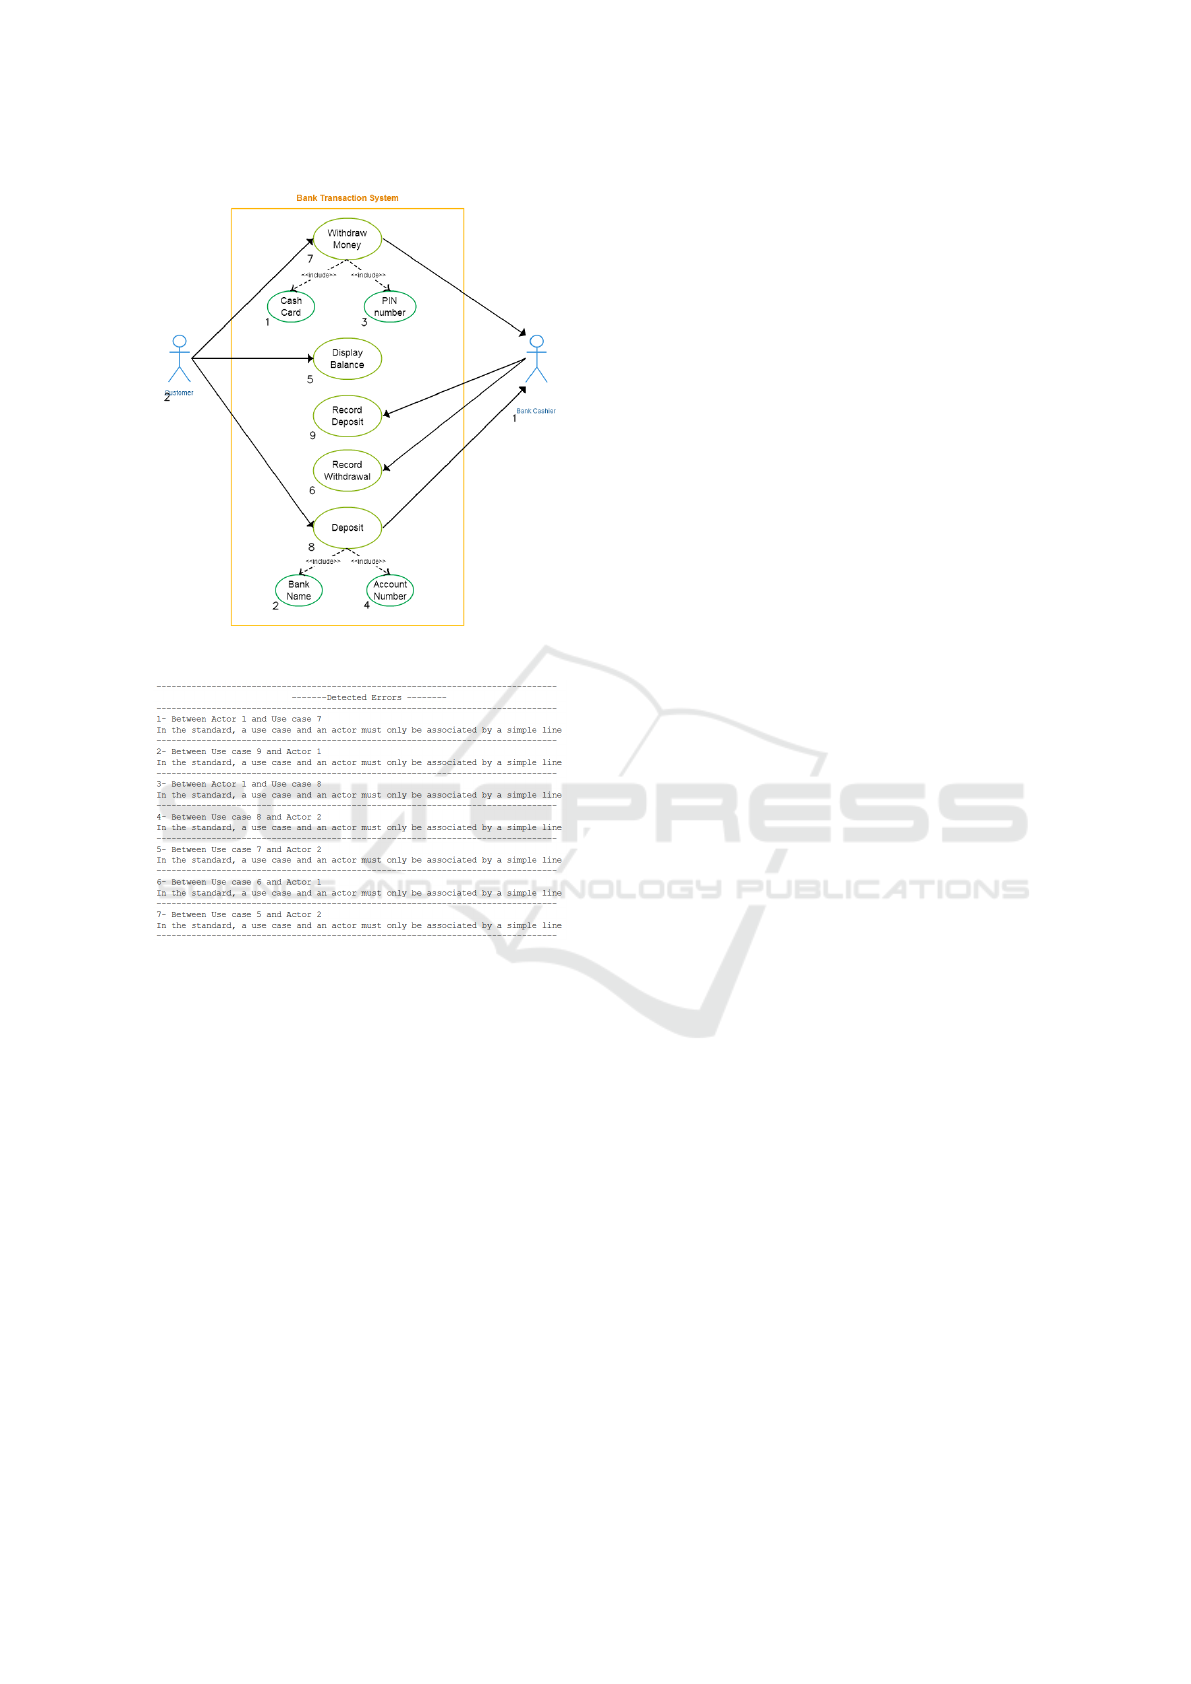
Figure 9: Annotated use case diagram by our system.
Figure 10: Use case diagram correction example.
5 CONCLUSION
In this paper, we have described the architecture of a
generic system of UML syntax correction, with ap-
plication on use case diagram. Our approach does
not require any third-person intervention for correc-
tion and does not impose any modeling software. It is
easy to use since a simple diagram image is enough
for correction.
The results presented in this paper are the basis
of work to obtain a much more thorough syntactic
correction of use case diagrams and other UML di-
agrams. Thus we intend to improve our arrow de-
tection pipeline. This involves improving our arrow-
head detection model through additional data collec-
tion and our lines detection algorithm. We plan to
check the remaining rules and then move on to syntax
correction of other UML diagrams.
REFERENCES
AUDIBERT, L. (2006). UML 2 De l’apprentissage
`
a la
pratique. Consult
´
e le 17/09/20.
Correia, H., Leal, J. P., and Paiva, J. C. (2017). Enhancing
Feedback to Students in Automated Diagram Assess-
ment.
Dolques, X., Huchard, M., Nebut, C., and Reitz, P. (2012).
Fixing generalization defects in uml use case dia-
grams. CLA’10: 7th International Conference on
Concept Lattices and Their Applications, 115.
Haji Ali, N., Shukur, Z., and Idris, S. (2007). A design of
an assessment system for uml class diagram. Proceed-
ings - The 2007 International Conference on Com-
putational Science and its Applications, ICCSA 2007,
pages 539–546.
Hasker, R. (2011). Umlgrader: an automated class diagram
grader. Journal of Computing Sciences in Colleges,
27.
Hasker, R. and Rowe, M. (2011). Umlint: Identifying de-
fects in uml diagrams. ASEE Annual Conference and
Exposition, Conference Proceedings.
Hoggarth, G. and Lockyer, M. (1998). An automated stu-
dent diagram assessment system. ACM Sigcse Bul-
letin, 30:122–124.
ONDIK, J. (2016). Software modelling support for small
teams.
Soler, J., Boada, I., Prados, F., Poch, J., and Fabregat, R.
(2010). A web-based e-learning tool for uml class di-
agrams.
Striewe, M. and Goedicke, M. (2011). Automated checks
on uml diagrams. pages 38–42.
Thomas, P. (2013). Online automatic marking of diagrams.
Systemic Practice and Action Research, 26.
Thomas, P., Smith, N., and Waugh, K. (2008). Automatic
assessment of sequence diagrams. In 12th Interna-
tional CAA Conference: Research into e-Assessment.
Vachharajani, V. and Pareek, J. (2014). A proposed ar-
chitecture for automated assessment of use case dia-
grams. International Journal of Computer Applica-
tions, 108:35–40.
Vachharajani, V., Pareek, J., and Gulabani, S. (2012). Ef-
fective label matching for automatic evaluation of use
case diagrams. pages 172–175.
Vesin, B., Milicevic, A., Mangaroska, K., Ivanovic, M., Jo-
lak, R., Stikkolorum, D., and Chaudron, M. (2018).
Web-based educational ecosystem for automatization
of teaching process and assessment of students.
Wegmann, A. and Genilloud, G. (2000). The role of ”roles”
in use case diagrams. volume 1939, pages 210–224.
Wu, Y., Kirillov, A., Massa, F., Lo, W.-Y.,
and Girshick, R. (2019). Detectron2.
https://github.com/facebookresearch/detectron2.
DeLTA 2022 - 3rd International Conference on Deep Learning Theory and Applications
198
