
Analysis of Ensemble of Neural Networks and Fuzzy Logic
Classification in Process of Semantic Segmentation of Martian
Geomorphological Settings
Kamil Choromański
1a
, Joanna Kozakiewicz
2b
, Mateusz Sobucki
3c
,
Magdalena Pilarska-Mazurek
1d
and Robert Olszewski
1e
1
Faculty of Geodesy and Cartography, Warsaw University of Technology, Plac Politechniki 1, 00-665 Warsaw, Poland
2
Faculty of Physics, Astronomy and Applied Computer Science, Jagiellonian University, prof. Stanisława Łojasiewicza 11,
30-348 Krakow, Poland
3
Faculty of Geography and Geology, Jagiellonian University, Gronostajowa 7, 30-387 Krakow, Poland
robert.olszewski@pw.edu.pl
Keywords: Deep Learning, Semantic Segmentation, Mars, CNNs, FIS, Aeolian Landscape.
Abstract: Deep learning analysis of multisource Martian data (both from orbiter and rover) allows for the separation
and classification of different geomorphological settings. However, it is difficult to determine the optimal
neural network model for unambiguous semantic segmentation due to the specificity of Martian data and
blurring of the boundary of individual settings (which is its immanent property). In this paper, the authors
describe several variants of multisource deep learning processing system for Martian data and develop a
methodology for semantic segmentation of geomorphological settings for this planet based on the
combination of selected solutions output. Network ensemble with use of the weighted averaging method
improved results comparing to single network. The paper also discusses the decision rule extraction method
of individual Martian geomorphological landforms using fuzzy inference systems. The results obtained using
FIS tools allow for the extraction of single geomorphological forms, such as ripples.
1 INTRODUCTION
Mapping of landforms on Mars using remote sensing
data has become one of the most important issues in
space exploration in recent years. The further
development in Mars exploration requires
preparation of detailed geomorphological maps. The
amount of high-resolution data acquired by Martian
orbiters and rovers increases very quickly, covering
vast regions of the planetary surface. Mapping of
these areas in a short period of time can be done only
using automatic methods. In this work, we present a
novel approach to map aeolian landscape on Mars
using deep learning analysis. We focused on
combining multiple models trained on multisource
a
https://orcid.org/0000-0002-2047-7434
b
https://orcid.org/0000-0002-9264-8298
c
https://orcid.org/0000-0002-2958-8966
d
https://orcid.org/0000-0001-9494-9863
e
https://orcid.org/0000-0003-1697-9367
data (namely orbital imagery, derivatives of elevation
models and in situ data from rover camera), taking
advantage of ensemble methods. We also analysed
use of fuzzy inference systems in the process of
decision rule extraction and individual landforms’
classification.
2 RELATED WORKS
2.1 Martian Geomorphological
Landforms
Mars is a desert planet covered by many aeolian
(wind related) landforms, such as dunes or ripples. In
184
Choroma
´
nski, K., Kozakiewicz, J., Sobucki, M., Pilarska-Mazurek, M. and Olszewski, R.
Analysis of Ensemble of Neural Networks and Fuzzy Logic Classification in Process of Semantic Segmentation of Martian Geomorphological Settings.
DOI: 10.5220/0011315200003277
In Proceedings of the 3rd International Conference on Deep Learning Theory and Applications (DeLTA 2022), pages 184-192
ISBN: 978-989-758-584-5; ISSN: 2184-9277
Copyright
c
2022 by SCITEPRESS – Science and Technology Publications, Lda. All rights reserved

this work, we will focus on ripples as they are the
most common features in the Martian landscape.
Ripples are sand ridges ranging from centimetres to
meters and formed by wind perpendicular to their
crests. Automatic detection of areas covered by large
(> 20 cm in height) ripples are particularly important
for Martian investigation, as ripples often become
traps for wheeled vehicles (e.g., Squyres et al. 2006).
We will focus on the area of Meridiani Planum
(Hynek et al., 2002), which is one of the best-known
regions on Mars due to extensive in situ and orbital
investigations. This is a flat region covered by impact
craters and ripples (see e.g. Fenton et al., 2015). In
this area there are three distinct geomorphological
settings: (i) ripple fields – ripples on sand covers, (ii)
ripples on bedrock - areas where extensive erosion led
to exposing the bedrock in spaces between ripples,
and (iii) sand-gravel covers – extensive sand-gravel
sheets. Two other (not aeolian) landforms
characteristic of this region are impact craters and
structural lineaments.
2.2 Automated Segmentation of
Geomorphological Landforms
First approaches to automated segmentation of
Martian geomorphological landforms were proposed
in the beginning of 21
st
century (Stepinski et al., 2006;
Stepinski et al., 2009; Gosh et al., 2010). Well-known
machine learning algorithms were utilized for this
task (Stepinski et al., 2006). As Martian data volumes
and computing power increased, Deep learning (DL)
algorithms have begun to be used. Semantic
segmentation based on DL approach was utilized both
for impact craters (Lee, 2019; Bandeira, 2012;
Stepinski et al., 2006; Stepinski et al., 2009) and
landforms (Palafox et al.,2017; Barrett et al.,2022;
Nagle-Mcnaughton et al., 2020). DL techniques have
been employed successfully on the most widely used
imagery and elevation data sources collected from
Mars: Mars Orbiter Laser Altimeter (MOLA)
(Stepinski et al., 2006), High Resolution Stereo
Camera (HRSC) (Lee, 2019), Context Camera (CTX)
(Palafox et al., 2017) and High Resolution Imaging
Science Experiment (HiRISE) (Wilhelm et al., 2020).
There are also works taking advantage of images
taken by Martian roves for the purposes of
segmentation and detection of terrain forms
(Wagstaff et al., 2018).
So far, a study by (Rothrock et al., 2016) is the
only one using orbital and rover data in one
workflow. However, these two data sources were
used in separation and for different purposes (orbital
data was used for search of optimal landing site for
future rovers and rover data for wheel slip
predictions). In this work, we propose an approach
that utilizes multiple data sources for semantic
segmentation of geomorphological settings basing on
deep learning multi-source data fusion methods
proposed by (Cao et al., 2018).
2.3 Decision Fusion
There are numerous works proving that fusing
decision outputs from various neural network models
may improve accuracy and generalizability
comparing to use of a single model. Ensemble of
neural networks was used with success both for
recurrent (Zhou et al., 2018) and convolutional neural
networks (Manna et al., 2021; Han and Jeong, 2020).
Simple methods such as averaging, weighted
averaging or majority voting are being used in many
works. Some researchers are developing also more
sophisticated approaches (Manna et al., 2021).
3 EXPERIMENTAL DESIGN
3.1 Data Sources and Pre-processing
In our investigation we used orbital and in situ data,
simultaneously. We used the high-resolution orbital
images of the Martian surface obtained by HiRISE
onboard the NASA Mars Reconnaissance Orbiter
mission. The orbital data were supplemented by in
situ data obtained by the Opportunity rover, one of
two rovers of the NASA Mars Exploration Rover
(MER) mission. Opportunity explored the western
part of Meridiani Planum between Eagle and
Endeavour craters in years 2004-2018.
The HiRISE and Opportunity Rover data were
downloaded from the Planetary Data System (PDS).
To study aeolian landforms from the planetary
surface we focused on the Navigation Camera
(NAVCAM) data. The NAVCAM system consisted
of two stereoscopic cameras (Maki et al., 2003).
3.1.1 HiRISE Data
We used eight images to produce four stereo pairs and
to create the Digital Terrain Model (DTM) that
covered the entire Opportunity rover traverse:
ESP_018846_1775-ESP_018701_1775,
ESP_051245_1780-ESP_020758_1780,
ESP_016644_1780-ESP_037109_1780,
PSP_001414_1780-PSP_005423_1780.
Analysis of Ensemble of Neural Networks and Fuzzy Logic Classification in Process of Semantic Segmentation of Martian
Geomorphological Settings
185

The HiRISE data were processed using NASA Ames
Stereo Pipeline (ASP) (version v2.6.2) and Integrated
Software for Imagers and Spectrometers (ISIS)
(version 3.6.0). From the HiRISE stereopairs four
DTMs were produced. Selected HiRISE images were
orthorectified using the DTMs to remove the impact
of terrain height on the geometry of the images.
Finally, the orthoimages and the DTMs were
mosaicked into continuous raster file, so-called
mosaic, which covered an area of approximately 87
square km and had a spatial resolution of 27 cm.
Using elevation-DTM data from HIRISE images, the
authors also developed derived relief models:
topographic roughness index (TRI), topographic
positioning index (TPI). Various curvature models,
e.g., transverse, longitudinal, were also determined
from the DTM analysis.
3.1.2 NAVCAM Data
We stitched NAVCAM images into spatially
referenced panoramas basing on NAVCAM images
metadata. Radiometric differences between
panorama segments were reduced using histogram
matching technique. The final panoramas were
cylinder-projected. Areas, where images were
overlapping were merged by selecting every second
pixel of each image. The starting orientation for each
panorama is north to ensure consistency for the
analysis of all panoramas used in the research
process. The resolution of a single output panorama
is 2048×6992.
Finally, semantic features from each panorama
were extracted with the use of Places-CNN network
pre-trained on Places365 dataset (Zhou et al., 2017).
Each panorama was converted to 2048-dimensional
feature vector which was reduced to 50 dimensions
by using principal component analysis (PCA)
method. To spatially align in-situ data with orbital
data we interpolated feature vectors onto spatial
domain using Nadaraya-Watson interpolation
algorithm.
3.2 Semantic Segmentation Network
We use a single architecture of a convolutional neural
network (CNN) to train a few independent models in
order to create semantic segmentation of terrain.
Different data sources were used as the input for these
models.
A CNN encoder-decoder network consisting of
two encoders and one decoder was used to train
models employed in this research. Both encoders of
the network were based on VGG-16 architecture
(Simonyan and Zisserman, 2015) with last (fifth)
layer of original VGG-16 replaced by two
convolutional layers. First encoder was used to
extract semantic features from orbital data (imagery
data and derivatives of elevation model concatenated
into multi-layer raster are fed into this part of model).
Second one was utilized to extract in-situ features.
Every last layer of each block of the second encoder
was concatenated with corresponding layer of the first
encoder. The decoder block was also based on VGG-
16 (without the last block, with an up-sampling layer
instead of max-pooling and with reduced number of
parameters). Semantic segmentation of orbital image
is generated as an output from decoder block. The
architecture was implemented using a TensorFlow
framework (Martin, 2015).
3.3 Averaging
Two averaging methods were utilized in this research:
i) simple averaging of selected models decision
certainty, ii) weighted averaging.
In the first case, class decision certainty values of
each model for each data point (pixel) x
i
were
summed and divided by number of models (n):
𝑥̄ =
∑
𝑥
𝑛
(1)
Weighted averaging x
̄
w
was performed by
assigning weight w
i
to each of n models based on their
performance on test dataset (assed by overall
accuracy). The final decision certainty was computed
as the weighted average for each data point x
i
:
𝑥̄
=
∑
𝑤
∗𝑥
∑
𝑤
(2)
Finally, class with the highest fused decision
certainty value was selected as valid for a given data
point.
3.4 Fuzzy Logic
Using deep machine learning methods allows to
obtain reliable classification results, however, the
limitation of this approach is the so-called black box
associated with the use of neural networks. In order
to obtain explicitly defined (yet intentionally fuzzy)
decision rules for classification, the authors of this
paper have applied fuzzy inference systems (FIS).
This approach allows the extraction of decision rules,
but requires prior training of the neural network and
obtaining reliable parameters of membership of
pixels to geomorphological setting classes.
DeLTA 2022 - 3rd International Conference on Deep Learning Theory and Applications
186

4 EXPERIMENTS AND
ANALYSIS
4.1 Individual Models Training
The network architecture described above was used
to train a few semantic segmentation models using
different input data combinations (Table 1).
Table 1: Summary of data sources used for each
experiment.
Experiment no. Data used
1 orbital only
2 orbital + TPI/TRI
3 orbital + curvatures
4 Orbital and in situ fused
5 Orbital and in situ fused +
TPI/TRI
6 Orbital and in situ fused +
curvatures
Each network was trained on the same amount of
data, namely: 523 256x256 tiles of each data type for
training and 108 tiles for testing. As the training
dataset was not large, offline data augmentation
techniques were utilized in order to enlarge dataset.
Moreover, both VGG-16 encoders were pretrained on
the ImageNet dataset.
In our analysis, we used a system of four classes
of Meridiani Planum geomorphological setting:
1) ripple fields,
2) ripples on bedrock,
3) sand-gravel covers,
4) others, neglected in results analysis
4.2 Averaging
Two approaches of results averaging were tested: i)
simple averaging with use of chosen models, and ii)
weighted averaging.
Taking into account individual models results a
couple of variations of models were selected for
simple averaging. Table 2 summarizes experiments
conducted to check the effectiveness of simple
averaging technique.
Second approach to averaging is to use weights
assigned to each model. We used ranked-based
approach to weighting where constant weight values
were assigned to models basing on their individual
accuracy scores (see point 5.1). Table 3 shows
weights assigned to each model.
Table 2: Summary of experiments carried out with use of
simple averaging technique.
Experiments no. used for
avera
g
in
g
(
see Table 1
)
1,2,5,6
5,6
2,5
2,3,4,5
4,5
4,5,6
1,2,3,4,5,6
Table 3: Weight value assigned to each experiment basing
on its individual results.
Experiment no. (see
Table 1)
Weight value
1 0.05
2 0.20
3 0.10
4 0.15
5 0.50
6 0.00
As one can observe, experiment no. 6 was
excluded from multi-model decision process due to
its significantly worse individual performance.
4.3 Fuzzy Logic based Approach
The use of FIS systems allows for the extraction of
fuzzy decision rules and the development of an
efficient inference system based on multiple
variables. In this work, Takagi-Sugeno-Kang fuzzy
inference FIS models (Sugeno, 1985) were used. This
approach uses singleton output membership functions
that are either constant or a linear function of the input
values. Three FIS models were developed to classify
Martian aeolian settings. A fuzzy tree - Aggregated
Structure was also constructed. In this approach, input
values are incorporated as groups at the lowest level,
where each input group is fed into a FIS (Siddique,
2013). The outputs of the lower level fuzzy systems
are aggregated using the higher level fuzzy systems.
In this work, for the simplicity of the model, only two
explanatory variables: image value (IMG) and TRI,
and several simple linguistic variables: low, medium,
high, possible etc. were used.
Analysis of Ensemble of Neural Networks and Fuzzy Logic Classification in Process of Semantic Segmentation of Martian
Geomorphological Settings
187
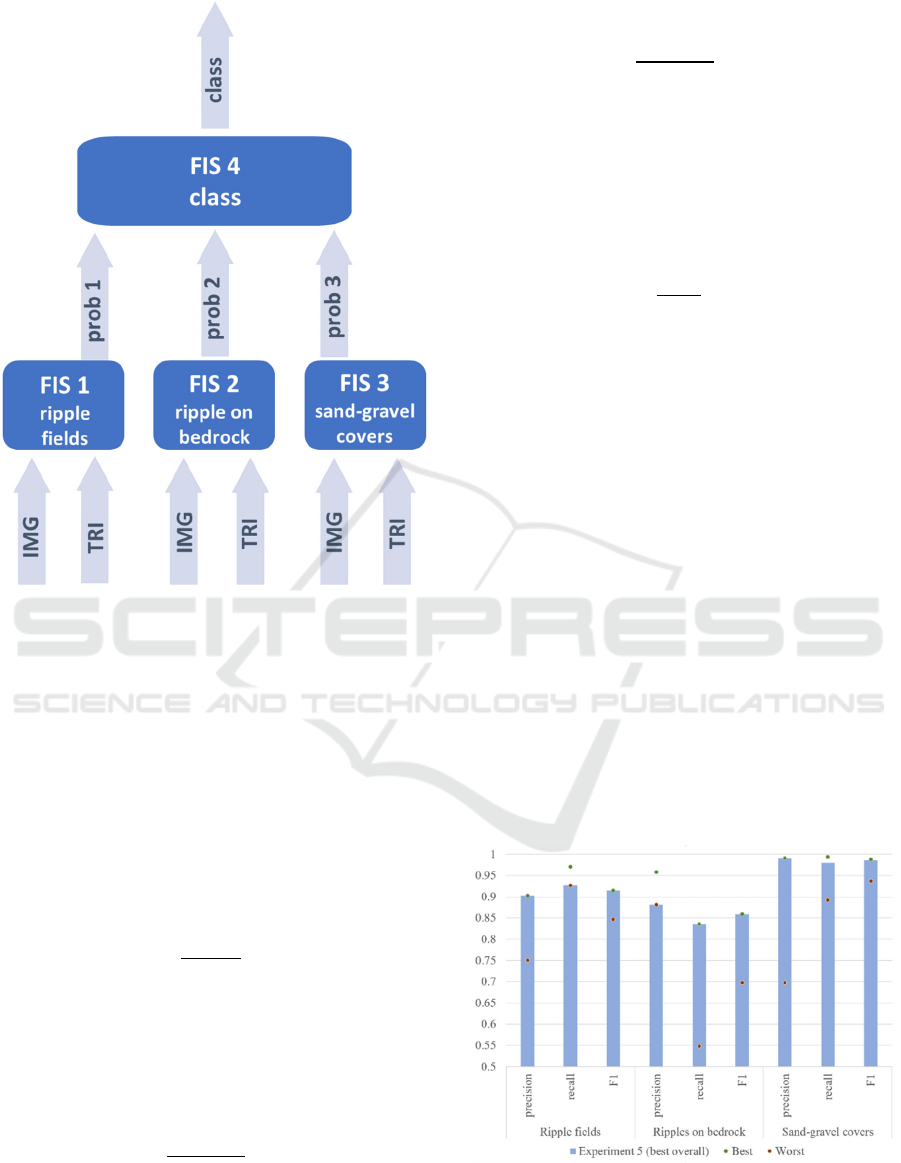
Figure 1: Aggregated Fuzzy Tree.
4.4 Evaluation Metrics
To assess results of the conducted experiments both
global and per-class evaluation metrics were used,
namely: overall pixel accuracy, per-class precision,
recall and F1 score. Also, averaged values of per-
class precision, per-class recall, and per-class F1
score were used to assess overall performance of
selected approaches.
Overall pixel accuracy:
acc=
tr
CM
N
(3)
Where 𝑡𝑟 is the trace of the matrix, 𝐶𝑀 is the
confusion matrix, and 𝑁 is the number of pixels in all
classes.
Per-class precision, P
c
:
p
c
=
CM
cc
∑
CM
cj
n
j=1
(4)
Per-class recall, r
c
:
r
c
=
CM
cc
∑
CM
jc
n
j=1
(5)
Where c represents the index of a given class in the
confusion matrix, n is the number of all classes, and
CM
ij
is the 𝑖th row and the jth column element in the
confusion matrix.
The per-class F1 score takes precision and recall
metrics into account:
F1=
2*p
c
*r
c
p
c
+r
c
(6)
5 RESULTS
Predictions on test dataset of individual and
ensembled models were compared with use of
evaluation metrics described in chapter 4.4.
5.1 Individual Models
Models trained using different data sources
combinations (Table 1) varied between 91.88% and
95.94% in terms of overall accuracy on test dataset.
Best results regarding majority of metrics were
achieved in the experiment which used both in situ
and orbital data along with TPI and TRI rasters
(experiment no. 5).
Figure 2 shows results achieved by the best model
with comparison to the per-metric best and the per-
metric worst result. It can be observed that not in
every case best individual model gives the best result
for each of the tested classes.
Figure 2: Precision, recall and F1-score comparison of best
individual model and best and worst results from all models
for each class.
DeLTA 2022 - 3rd International Conference on Deep Learning Theory and Applications
188
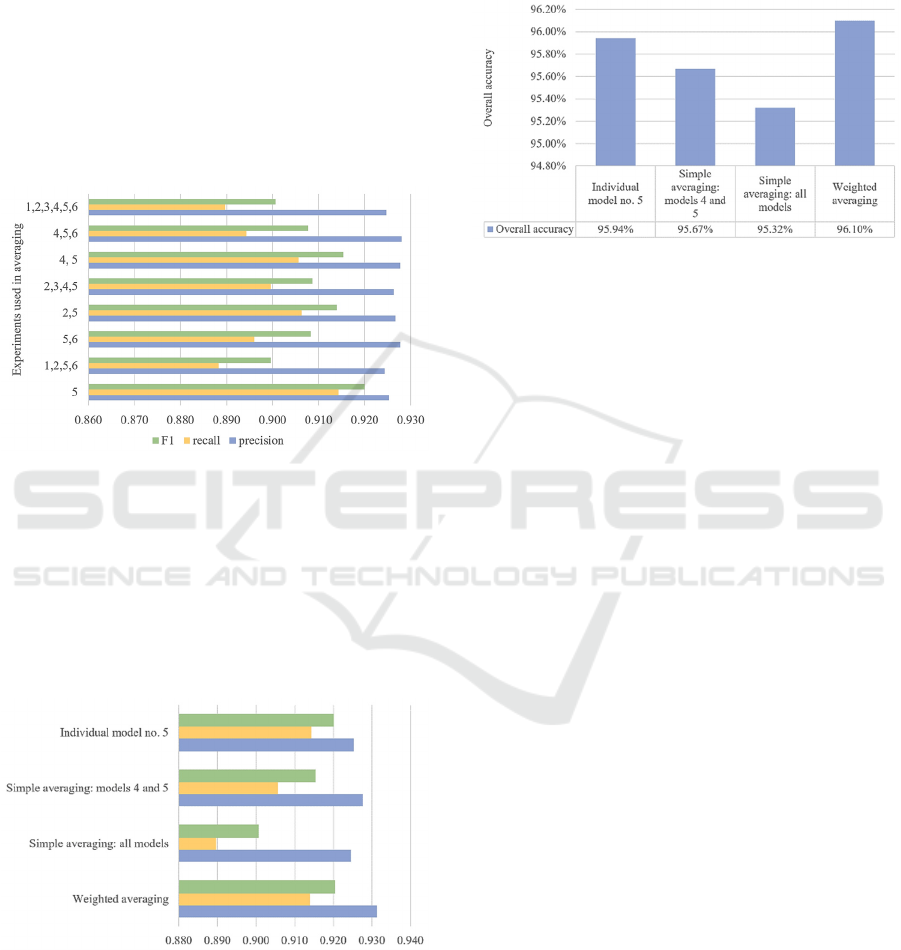
5.2 Ensemble Techniques
The results of simple averaging experiments using
different models (Table 2) are visualized below
(Figure 3). Mean value of precision, recall and F1
score was computed basing on results for individual
classes. Best overall simple averaging results were
achieved using combination of two models: 4 and 5.
However, the results were better only in terms of
precision metric when compared to best individual
model (no. 5). Also, overall accuracy of simple
averaging methods is lower than achieved by model
no. 5. (see Figure 5).
Figure 3: Mean precision, recall and F1-score comparison
of best individual model (5) and multiple models combined
with use of simple averaging technique.
Weighted averaging technique was tested using
weights introduced in Table 3 and compared to
selected results from simple averaging and best
individual model. Figure 4 shows comparison of
achieved precision, recall and F1-score. Figure 5
compares overall accuracy of each model.
Figure 4: Mean precision, recall and F1-score comparison
of best individual model (5), selected multiple models
combined with use of simple averaging technique and
models combined with use of weighted averaging
technique.
Weighted approach proved to give better or equal
results when compared to any individual model in
terms of precision, recall and F1-score. Overall
accuracy is also better than any other approach tested
in this research and achieved level of 96.10%.
Figure 5: Overall accuracy of best individual model (5),
selected multiple models combined with use of simple
averaging technique and model combined with use of
weighted averaging technique.
The weighted averaging technique produces results that
visually fit well with manual recognition of the
geomorphological settings. It enables distinction of the
ripples on bedrock class in areas with small share of
bedrock surface. Subsequently, it tends to overlook small,
isolated bedrock outcrops, which prevents creation of
small, misleading artifacts (Figure 6). The weighted
averaging results tend to have lower, however still
conclusive, decision certainty value in ambiguous areas
than some other approaches. It opens a prospect for better
multi-aspect terrain recognition using fuzzy logic.
5.3 Fuzzy Logic Classification
In the present study, an aggregate decision tree was
developed to detect individual Martian
geomorphological landforms. Each of the three
source Sugeno trees allows for classification of a
distinct type of landform (e.g. ripples) and extraction
of decision rules. For example, first FIS (Figure 1)
component of the FIS tree allows classification of
ripples based on two decision variables - IMG and the
morphometric parameter TRI. The nonlinear FIS
decision surface is shown in Figure 7. The operation
of this FIS tree is based on only three fuzzy decision
rules:
- if IMG is medium and TRI is medium then ripple
is certain
- if IMG is low and TRI is low then ripple is
possible
- if IMG is high or TRI is high then ripple is
impossible
Analysis of Ensemble of Neural Networks and Fuzzy Logic Classification in Process of Semantic Segmentation of Martian
Geomorphological Settings
189
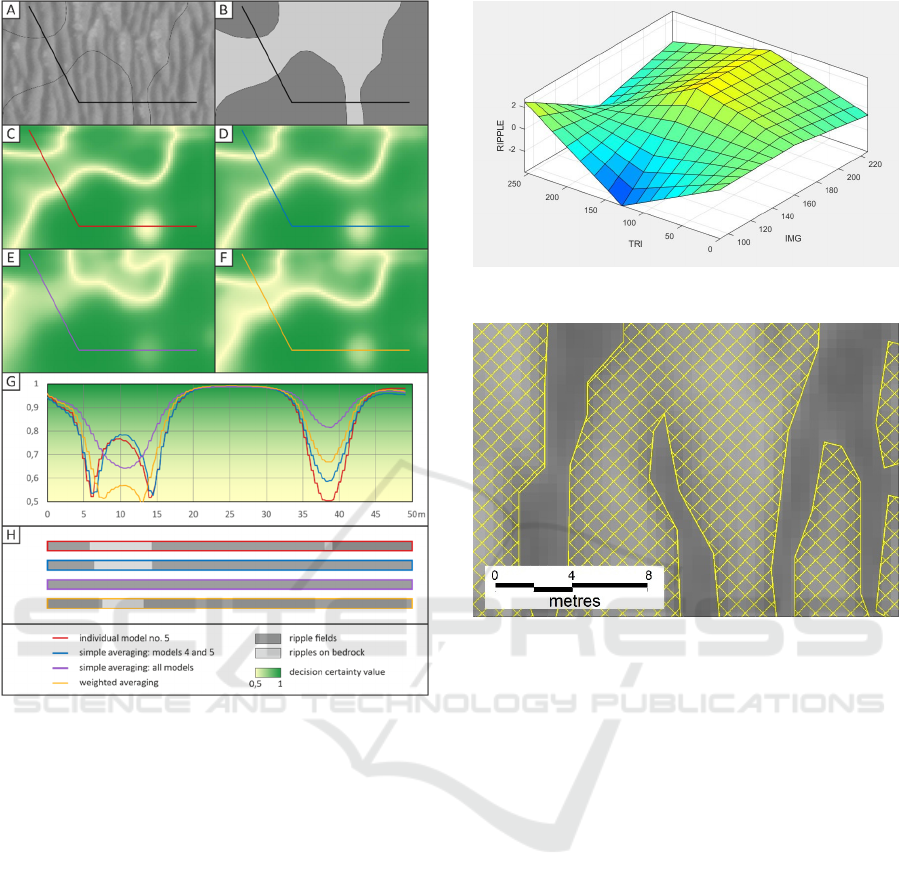
Figure 6: Exemplary part of classified terrain; orthoimage
(A), manual labelling (B), individual model no.5 (C),
simple averaging: model 4 and 5 (D), simple averaging: all
models (E), weighted averaging (F), decision certainty
value plot for a chosen profile (G), classification result
along the profile for different approaches (H).
The results obtained are (in terms of accuracy)
much worse than the classification based on neural
networks (71.23% classification correctness), but this
is partly due to the way the results are granulated
(Figure 8). The FIS system classifies as "ripple" not
so much the areas of ripple occurrence, but individual
ripples. The areas in between ripples have been
assigned to a different feature class: non-ripples.
Thus, the obtained results allow both to "reveal" the
decision rules and open new research directions in the
field of neuro-fuzzy classification.
6 CONCLUSIONS
This research has shown that use of deep learning
methods combined with multisource data have big
Figure 7: Nonlinear fuzzy decision surface.
Figure 8: FIS classification of ripples using decision
variables: image value and TRI.
potential for the highly accurate, automated
geomorphological Martian settings segmentation.
These results may be improved further with use of
ensemble methods such as weighted averaging.
Fusion of multiple model decisions with varying
accuracy may bring improvement in comparison to
use of one model. Weighted averaging proved to give
better results than simple averaging with regard to
model decision fusion for semantic segmentation of
geomorphological settings. Automated optimization
of weight values may further increase system
accuracy and such approach will be investigated in
future.
The use of deep learning machine learning
methods allows for the correct classification of
aeolian forms on Mars and, consequently, for the
development of an implicit knowledge base acting on
the "black box" principle. The use of fuzzy logic
allows the extraction of decision rules which explain
why a given pixel has been classified into the specific
geomorphological setting class. The decision fuzzy
rules provide an understanding of the multifactorial
reasons for classifying pixels into a given category
and the development of an explicit knowledge base.
DeLTA 2022 - 3rd International Conference on Deep Learning Theory and Applications
190

Subsequently, the FIS system enables individual
forms (e.g. ripples) recognition. These issues will be
further investigated by the authors of this paper.
ACKNOWLEDGEMENTS
Funding: The work was funded by the Anthropocene
Priority Research Area budget under the program
"Excellence Initiative – Research University" at the
Jagiellonian University and by POB Research Centre
Cybersecurity and Data Science of Warsaw
University of Technology within the Excellence
Initiative Program - Research University (ID-UB).
REFERENCES
Moore, R., Lopes, J. (1999). Paper templates. In
TEMPLATE’06, 1st International Conference on
Template Production. SCITEPRESS.
Smith, J. (1998). The book, The publishing company.
London, 2
nd
edition.
Manna, A., Kundu, R., Kaplun, D. et al. (2021). A fuzzy
rank-based ensemble of CNN models for classification
of cervical cytology. Sci Rep 11, 14538
Zhou, J., Tian P., Chu Z., and Na S. (2018). Data Pre-
Analysis and Ensemble of Various Artificial Neural
Networks for Monthly Streamflow Forecasting. Water
10, no. 5: 628.
Han S., Jeong J., (2020). An Weighted CNN Ensemble
Model with Small Amount of Data for Bearing Fault
Diagnosis. Procedia Computer Science, V. 175
K. Simonyan, A. Zisserman, (2015). Very deep
convolutional networks for large-scale image
recognition. 3rd International Conference on Learning
Representations, ICLR 2015—Conference Track
Proceedings, pp. 1–14.
T. F. Stepinski, S. Ghosh, R. Vilalta, (2006). Automatic
Recognition of Landforms on Mars Using Terrain
Segmentation and Classification. In Proceedings of the
9th International Conference on Discovery Science,
LNAI 4265, pp. 255–266.
T. F. Stepinski, M. P. Mendenhall, B. D. Bue, (2009).
Machine cataloging of impact craters on Mars. Icarus,
203(1), pp. 77–87.
https://doi.org/10.1016/j.icarus.2009.04.026
S. Ghosh, T. F. Stepinski, R. Vilalta, (2010). Automatic
annotation of planetary surfaces with geomorphic
labels. IEEE Transactions on Geoscience and Remote
Sensing, 48(1), pp. 175–185. https://doi.org/10.1109/
TGRS.2009.2027113
C. Lee, (2019). Automated crater detection on Mars using
deep learning. Planetary and Space Science, 170(2015),
pp. 16–28. https://doi.org/10.1016/j.pss.2019.03.008
L. Bandeira, W. Ding, T. Stepinski, (2012). Detection of
sub-kilometer craters in high resolution planetary
images using shape and texture features. Advances in
Space Research, 49(1), pp. 64–74.
https://doi.org/10.1016/j.asr.2011.08.021
L. F. Palafox, C. W. Hamilton, S. P. Scheidt, A. M. Alvarez,
(2017). Automated detection of geological landforms
on Mars using Convolutional Neural Networks.
Computers and Geosciences, 101(January), pp. 48–56.
https://doi.org/10.1016/j.cageo.2016.12.015
A. M. Barrett, M. R. Balme, M. Woods, S. Karachalios, D.
Petrocelli, L. Joudrier, E. Sefton-Nash, (2022). NOAH-
H, a deep-learning, terrain classification system for
Mars: Results for the ExoMars Rover candidate
landing sites. Icarus, 371 (September 2021), 114701.
https://doi.org/10.1016/j.icarus.2021.114701
T. Nagle-Mcnaughton, T. McClanahan, L. Scuderi, (2020).
PlaNet: A Neural Network for Detecting Transverse
Aeolian Ridges on Mars. Remote Sensing, 12(21), pp.
1–15. https://doi.org/10.3390/rs12213607
T. Wilhelm, M. Geis, J. Püttschneider, T. Sievernich, T.
Weber, K. Wohlfarth, C. Wöhler, (2020). DoMars16k:
A Diverse Dataset for Weakly Supervised
Geomorphologic Analysis on Mars. Remote Sensing,
12(23), pp. 1–38. https://doi.org/10.3390/rs12233981
K. L. Wagstaff, Y. Lu, A. Stanboli, K. Grimes, T. Gowda,
J. Padams, (2018). Deep Mars: CNN Classification of
Mars Imagery for the PDS Imaging Atlas. 32nd AAAI
Conference on Artificial Intelligence, AAAI, pp. 7867–
7872.
B. Rothrock, J. Papon, R. Kennedy, M. Ono, M. Heverly,
C. Cunningham, (2016). SPOC: Deep Learning-based
terrain classification for Mars rover missions. AIAA
Space and Astronautics Forum and Exposition,
September 2016, pp. 1–12. https://doi.org/10.2514/
6.2016-5539
R. Cao, J. Zhu, W. Tu, Q. Li, J. Cao, B. Liu, Q. Zhang, G.
Qiu, (2018). Integrating Aerial and Street View Images
for Urban Land Use Classification. Remote Sensing,
10(10), 1553. https://doi.org/10.3390/rs10101553
B. Zhou, A. Lapedriza, A. Khosla, A. Olivia, A. Torralba.
(2017). Places: A 10 Million Image Database for Scene
Recognition. 2017 IEEE Transactions on Pattern
Analysis and Machine Intelligence, pp.1452-1464.
https://doi.org/10.1109/TPAMI.2017.2723009
A. Martín, et al. (2015). TensorFlow: Large-scale machine
learning on heterogeneous systems. Software available
from tensorflow.org
M. Sugeno, Industrial applications of fuzzy control,
Elsevier Science Pub. Co., 1985
N. Siddique, H. Adeli. Computational Intelligence:
Synergies of Fuzzy Logic, Neural Networks and
Evolutionary Computing. Hoboken, NJ: Wiley, 2013.
Squyres, S. W., Arvidson, R. E., Bollen, D., Bell III J. F.,
Brückner, J., Cabrol, N. A., et al. (2006). Overview of
the Opportunity Mars Exploration Rover Mission to
Meridiani Planum: Eagle crater to Purgatory ripple. J.
Geophys. Res., 111, E12S12. doi:10.1029/2006JE002
771
Hynek, B. M., Arvidson, R. E., & Phillips, R. J. (2002).
Geologic setting and origin of Terra Meridiani hematite
Analysis of Ensemble of Neural Networks and Fuzzy Logic Classification in Process of Semantic Segmentation of Martian
Geomorphological Settings
191

deposit on Mars. J. Geophys. Res., 107(E10), 5088.
doi:10.1029/2002JE001891
Maki, J. N., Bell III, J. F., Herkenhoff, K. E., Squyres, S.
W., Kiely, A., Klimesh, M., et al. (2003). Mars
Exploration Rover Engineering Cameras. J. Geophys.
Res., 108(E12), 8071. http://dx.doi.org/10.1029/2003J
E002077.
McEwen, A. (2007). Mars Reconnaissance Orbiter High
Resolution Imaging Science Experiment, Experiment
Data Record, MRO-M-HIRISE-2-EDR-V1.0, NASA
Planetary Data System.
Fenton, L. K., Michaels, T. I., & Chojnacki, M. (2015). Late
Amazonian aeolian features, gradation, wind regimes,
and Sediment State in the Vicinity of the Mars
Exploration Rover Opportunity, Meridiani Planum,
Mars. Aeolian Research, 16, 75–99.
https://doi.org/10.1016/j.aeolia.2014.11.004
DeLTA 2022 - 3rd International Conference on Deep Learning Theory and Applications
192
