
Line-up Optimization Model of Basketball Players
and the Simulation Evaluation
Wang Yichen
1
and Haruka Yamashita
2
*
1
Graduated School of Science and Technology, Sophia University, 7-1, Kioicho, Chiyoda-ku, Tokyo, Japan
2
School of Science and Technology, Sophia University, 7-1, Kioicho, Chiyoda-ku, Tokyo, Japan
Keywords: Basketball Games, Game Strategy, Deep Neural Network, Game Simulation.
Abstract: This study aims to maximize the offensive capabilities of the basketball team by optimizing the line-up of
players at an arbitrary time. We construct a highly accurate prediction model when the members are
changed considering the situation in the game and then propose a model to determine the optimal line-up.
The Recursive Neural Network model analyzes time series data, and the Neural Network model
incorporates player combinations and game conditions as conditions are combined. The model enables an
analysis of the past scores and game conditions and the construction of a predictive model of scores that
takes the line-up into account and determines the optimal line-up by calculating the prediction of the offense
capabilities with changing the line-up. Furthermore, to demonstrate the validity of the proposed model, this
study evaluates the accuracy of the prediction of the score using data accumulated from the actual baseball
game. Moreover, because it is difficult to use this method in actual games, we applied the proposed model
to the play data of a basketball simulation game. We conducted a simulation experiment where members
were successively optimized and showed that the score was better than the experiment without the
optimization.
This
*
paper is the revised version of Lineup Optimization Model of Basketball Players Based on the Prediction of Recursive
Neural Networks (Wang and Yamashita, 2021). this paper includes the outcomes of the further research of the previous
paper. Specifically, this research derived the simulational study of the player lineup optimization using the video game.
1 INTRODUCTION
In recent years, decisions on game members and
strategies based on the analysis of accumulated data
have been widely attempted in sports. One of the
famous leagues of sports games NBA (National
Basketball Association), has many teams analyzing
the play data for each game. Therefore, each team
has a dedicated team of analysts, and various data
analyses exist to win games.
Here, the game situation in a basketball game is
rapid changes in each game. This feature makes
decision-making based on analysis difficult. In
addition, recent rule changes in the NBL (Homepage
of the NBA) have resulted in more diverse team
line-up compositions (Nourayi, 2019). For example,
the Los Angeles Lakers (Homepage of Los Angels
Lakers) discuss the specific team line-up called
Small Ball, which overwhelmed offensive power
with the aggressive use of shorter players. Some
teams have strengthened their offense and have won
many league championships in recent years.
However, the Small Ball strategy does not apply to
all teams and may not be appropriate depending on
the game situation. Therefore, each team must
analyze both team and player post-game analysis
and real-time play data to determine the line-up of
players in the team's strategy to improve their
offensive capabilities.
Here, it is necessary to determine the members of
the line-up of players for whom the results are
favourable. In other words, determining the
combination of members to optimize the results
while considering the real-time game situation is
required. Therefore, to maximize the offensive
capability of the team, this study (1) constructs a
highly accurate prediction model for changing the
members considering the situation at any given time,
and (2) proposes a model to determine the optimal
492
Yichen, W. and Yamashita, H.
Line-up Optimization Model of Basketball Players and the Simulation Evaluation.
DOI: 10.5220/0011307900003269
In Proceedings of the 11th International Conference on Data Science, Technology and Applications (DATA 2022), pages 492-499
ISBN: 978-989-758-583-8; ISSN: 2184-285X
Copyright
c
2022 by SCITEPRESS – Science and Technology Publications, Lda. All rights reserved

line-up composition in real-time. In this study, we
construct a model that uses score data per gameplay,
which indicates the contribution of the line-up to the
game as output in time-series data and the line-up
and situation of the players as input. We apply a
Recurrent Neural Network (RNN) model (Mikolov,
et al., 2011) that can analyze time-series data as a
basis and combine a Neural Network (NN) model
(Mccullagh, 2010) that incorporates player
combinations and game conditions as conditions,
past scores, and game conditions. The modeling
enables to take line-ups into account for the score
prediction. Furthermore, when optimizing a line-up,
calculating the score's prediction for each
combination of players is required; however, the
number of combinations is vast, and often not
enough data is available. Therefore, we set up a line-
up of candidates for each strategy in advance and
optimize the line-ups among them.
Furthermore, to demonstrate the validity of the
proposed model, this study evaluates the accuracy of
prediction using data collected from actual games. In
addition, it is not easy to use this method in actual
games. Therefore, to verify the model's reliability,
we applied the proposed model to the play data of a
basketball simulation game and conducted a
simulation experiment in which members were
successively replaced.
2 PRELIMINARIES
2.1 Data Description
To examine the validity of the proposed method, this
study conducts an analysis using basketball game
data and game data for simulation, which enables the
evaluation of effects in real-time. Specifically, the
basketball game data was collected by watching the
2019-20 Los Angeles Lakers (Homepage of Los
Angels Lakers) game, recording the game conditions
(referred to as Lakers data), and training the model.
The game data for the simulation records using the
game simulation function of NBA2k21 (Homepage
of NBA2k21) while optimizing the members using
the proposed model. The data for the analysis
consists of 11 variables in Table 1.
For the analysis, the first ten variables are the
model's input variables, and the 11th time series
variable is for both the input and output (objective)
variables. The scores of the former 5 points are the
input variables, and the score of one end is the
output variable.
Table 1: Variables and description of the Lakers data.
Variable Description
Position Uniform number of candidates
Quarter Categorical data for the
q
uarte
r
Time Time of the timing
Score difference The scoring offense of each
p
la
y
Fouls Number of Fouls
Consecutive wins /
losses
The number of Consecutive
wins/losses before the
g
ame
Length difference The difference in the sum of
the length of players for each
tea
m
Main defender The main defender of the
o
pp
onent
Average score The average score of the last
season
Home/ away Home/ away (binary data)
Score A score of each play
2.2 Related Works
In this subsection, we describe the related works
from two viewpoints: the research of basketball
analysis and the research approach using RNN.
Considering the study of basketball analysis,
researchers are using the statistical methods;
factor model for the factors of a ball in basketball
rebounding situations (Hojo, et al., 2019),
illustrating a model of the crucial players in each
game using graph structure (Piette, et al., 2016), and
the transition of the ball during the offense is
proposed (Fewell, et al., 2012). In this study, the
proposal considers individual scoring prediction and
the whole line-up scoring prediction. The
conventional analysis methods have not been
focusing on the viewpoint.
Recently, several studies using the deep NN
model (Rajiv, et al., 2016; Wang, et al., 2016) for
analyzing basketball data have been proposed.
Primarily, basketball analysis based on the RNN
model, which is the high-performance model for the
time series data prediction, is derived (Clemente, et
al. 2015; Luong, et al, 2013) Therefore, constructing
the prediction model of the team should be required.
2.3 Recursive Neural Network Model
Recursive neural network model (RNN) (Mikolov;
2011) is one of the neural network models and has
the feature that the output from the
Line-up Optimization Model of Basketball Players and the Simulation Evaluation
493
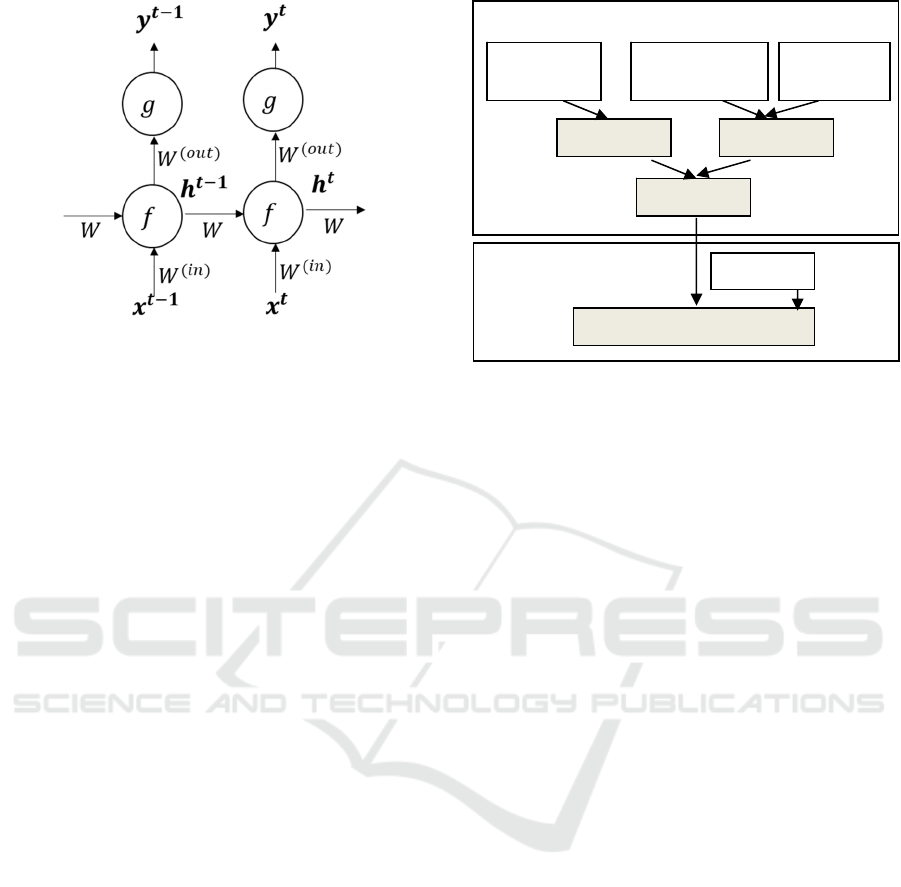
Figure 1: Outline of the proposed model intermediate layer
at one time is used in the intermediate layer at the next
time for the time-series information. Figure 1 shows the
structure of an RNN with one middle layer.
Here, we describe the structure of the basic RNN
model, which has only one middle layer. Let
𝒙
𝒕
𝑥
,…, 𝑥
be an input vector of time series data
at the time,
𝑦
be an output of time. Let 𝑊
be
the weight matrix of edges from the input to the
middle layer, 𝑊
is the weight matrix of edges
from the middle layer to the output layer. RNN has a
feature that the message passing of the output from
middle layers at each time. We denote 𝒉
as the
output vector from the middle layer, 𝑊 as the
weight matrix from the intermediate layer at time 𝑡
output, and is the weight matrix of the input of 𝒉
to
the middle layer at the next point in time 𝑡 .
Parameter estimation is based on backpropagation.
The RNN model does not work well when the
period is extended. Therefore, In the case of long-
term prediction, Long Short Term Memory network
(Greff, 2016; Zhao, 2018) is used.
3 PROPOSED METHOD
Basketball is a fast-paced, multiplayer sport.
Therefore, it is difficult for all teams to know what
line-ups to change (or not change) in an arbitrary
game to perform well. To solve this problem, we
propose two-step models.
We propose (1) a highly accurate model for
predicting scores of upcoming five plays when line-
ups are changed at arbitrary times during a game and
(2) an optimization model for line-ups to maximize
scores for upcoming five plays using the obtained
model. A schematic diagram is shown in Figure 2.
(1) Score prediction model
5 points Game situation Line-up data
Score data data
(2) Line-up optimization
Figure 2: Outline of the proposed model.
3.1 Score Prediction Model
The situation of the play in the game can be a
significant cause for a team's offense. To predict the
score while considering the team situation, we
consider the score from the current point in time to 5
plays back in time-series data and input it into the
RNN model. Next, the line-up of players on the field
and the current game situation are given as input
variables to the NN model. Furthermore, the RNN
and the NN output are combined and input into
another NN model that considers the game situation
and the flow. The output is the total points scored by
the team in the five plays from that point.
Moreover, this model enables us to predict scores
even in situations and line-ups that do not appear.
First, we describe the RNN model in Figure 3. Let
𝒙
𝒕𝟏
𝑥
,…, 𝑥
be an input vector of the
score of 5 past offensive plays at time 𝑡1, and let
𝒛
𝒕
𝑧
,…,𝑧
be the input vector of the game
situation denoted in Table 1 without the score, and
𝑦
be the upcoming score of 5 plays. Here, letting
the RNN function whose input vector is 𝒙
𝒕𝟏
be
𝑓
𝒙
𝒕𝟏
considering the activation functions and
NN function whose input is 𝒛
𝒕
activation functions
are 𝑓
𝒛
𝒕
), the score prediction function
𝑓
of 𝑦
can be represented as follows:
𝑦
𝑓
𝑐𝑜𝑛𝑓
𝒙
𝒕𝟏
, 𝑓
𝒛
𝒕
, (1)
where let () be the combining function of the output
of both RNN and NN. Parameters are estimated
through a backpropagation algorithm. Note that,
because the settings of the detailed structure of the x
(2) an optimization model for line-ups to maximize
scores for upcoming five plays using the obtained
R
N
N
N
N
N
N
Score Maximization
Lineu
p
DATA 2022 - 11th International Conference on Data Science, Technology and Applications
494
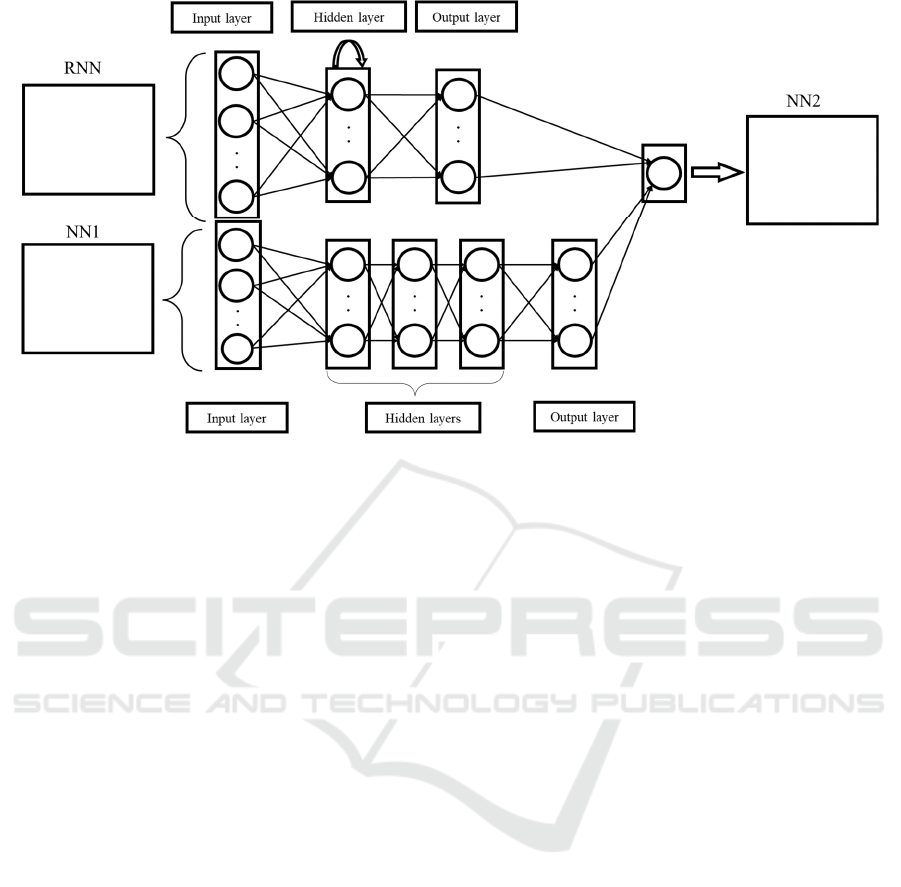
Figure 3: Structure of the score prediction model.
model. A schematic diagram is shown in Figure
2.considers only five plays and uses the data of 5
plays; we use the RNN approach.
3.2 Line-up Optimization
The score prediction model predicts the expected
score for the upcoming five plays in the target
basketball team. In this study, we indicate the
optimal team line-up at an arbitrary time by
changing the team line-up; however, because the
number of combinations of team line-up considering
position is enormous (9040 patterns), enough
learning data is challenging to be accumulated. Note
that the information of the top defender is used for
the prediction, the lack of learning data can be the
problem in the model. Therefore, in this study, we
restrict the combination of line-ups as the finite set
and find the optimal line-up from the set.
Considering the possible combination of line-ups,
we focus on the three kinds of line-ups: Normal ball
line-ups, small ball line-ups, and Bench line-ups. A
normal ball line-up is the essential combination of
players. We focus on the three normal line-ups for
the finite set. A small ball line-up is a specific
pattern that focuses on offense instead of defense.
This strategy has been tried in many teams recently;
however, the experts still discuss the effectiveness is
not the line-up. We focus on the three line-ups
which are well used in the actual game. The last kind
of line-up is the bench line-up which uses bench
start players (i.e., not the starting members). Because
basketball is a challenging sport, how to give players
rests is one of the crucial strategies. We focus on
four patterns that are well used in actual games.
Then, the number of the elements in a finite set 𝑈 is
10 (
|
𝑈
|
0. We find the line-up 𝑢 from 𝑈, which
maximizes the score
calculated by (1) as follows:
𝑢
∗
argmax
∈
𝑦
. (2)
In this study, we applied straight-forward approach
for finding the solution of 𝑢.
4 EVALUATION PREDICTION
MODEL USING REAL
BASKETBALL GAME DATA
In this section, we evaluate the accuracy of the
prediction of the proposed data using the actual
baseball game data. The data is accumulated from
the NBA league held from 2019th to 2020th. The
information is accumulated by watching videos of
the games of the Los Angeles Lakers, which is one
of the favored teams in the NBA league.
4.1 Detailed Setting of the Score
Prediction Model
The detailed setting of the model is represented
follows:
- RNN model has 3 layers, each layer has 32 nodes
Input data of
the score of 5
offensive past
plays
Input data of
game situations
Upcoming
score of 5 plays
Line-up Optimization Model of Basketball Players and the Simulation Evaluation
495
- NN model has 3 hidden layers, 24, 16, 16oki
nodes are set in each layer
- The concatenate function
- The activation function used was a combination
of three activation functions: sigmoid, tanh
(hyperbolic tangent), and ReLu function.
- The number of epochs is 40, and the batch size is
24.
- Optimization by Adam with a learning rate of 0.1.
- Evaluation is the mean absolute error (MAE) and
the correlation between the data and prediction.
- Learn the model using the offensive play data of
81 games and testing the last 50 plays in the last
game.
- For the evaluation, we used simple RNN (the
setting of the model is the same as the proposed
model) and compared the accuracy.
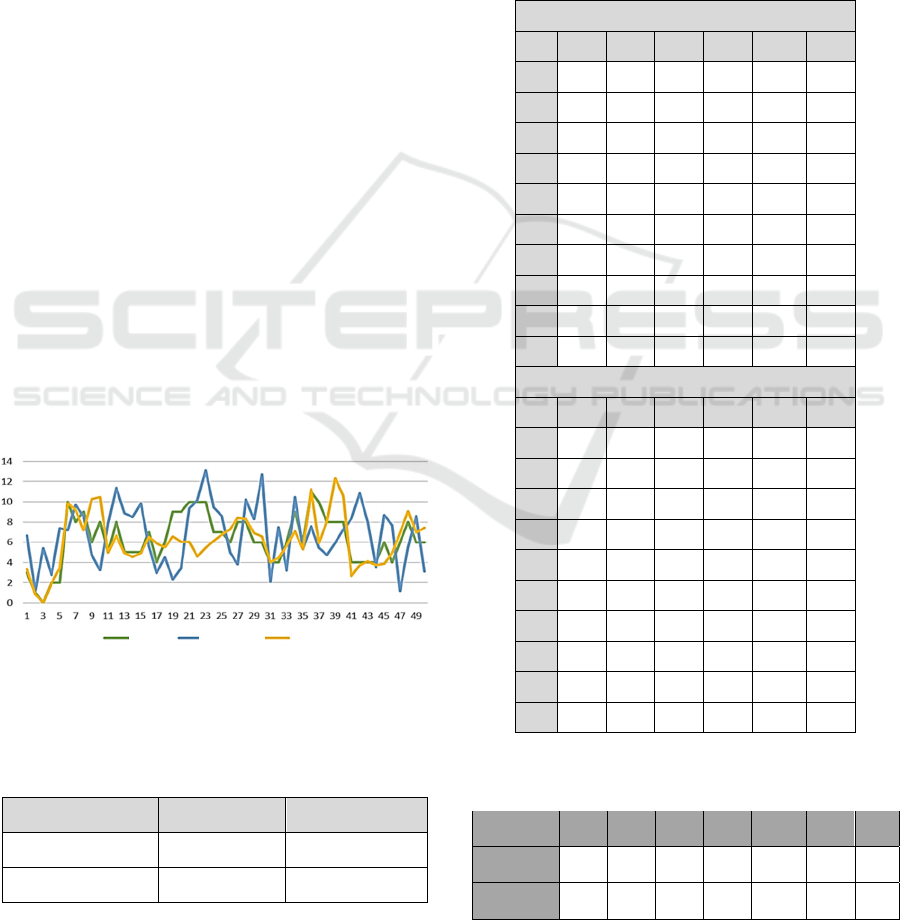
4.2 Prediction Result
The relationship between the predicted data and the
prediction of the proposed is represented in Figure 4.
The result shows that although some points are not
better than the simple RNN model, the proposed
model records better overall performance. The
evaluation indices: RMSE, and the correlation are as
Table 2. From the result, the proposed method is
superior to the simple RNN method; this result
shows that the line-up optimization should be
derived from the proposed method.
Figure 4: Indices of plays (x-axis) and the point (y-axis) of
the data, RNN prediction, and Proposed method
prediction.
Table 2: Evaluation indices of the proposed and simple
RNN method prediction.
Method RMSE Correlation
Proposed 1.8 0.68
Simple RNN 3.8 0.26
5 EVALUATION PREDICTION
MODEL USING SIMULATION
VIDEO GAME DATA
In the last section, we showed that the score's
prediction using the proposed method is more
accurate than the simple RNN model. However, the
objective of this study is to find the optimal line-up
in terms of the score at an arbitrary time.
Table 3: Results of the getting points for each quarter of
proposed and conventional (Automatically) optimization.
Proposed optimization
No qtr1 qtr2 qtr3 qtr4 Sum Gap
1 33 27 35 31 126 -12
2 32 31 29 55 147 1
3 33 30 30 43 136 38
4 30 25 31 36 122 28
5 27 23 24 37 111 -1
6 44 29 28 30 131 38
7 39 29 33 37 138 43
8 37 21 30 24 112 3
9 33 33 29 23 118 -2
10 25 42 22 36 125 3
Automatic optimization
No qtr1 qtr2 qtr3 qtr4 Sum Gap
1 28 35 28 29 120 8
2 36 27 33 29 125 -6
3 26 24 36 24 110 -7
4 26 20 25 37 108 15
5 25 32 39 34 130 3
6 26 25 39 29 119 2
7 22 37 28 30 117 -7
8 30 37 26 32 125 -4
9 23 28 29 19 99 -9
10 38 26 32 21 117 7
Table 4: Average of the getting points for each quarter of
proposed and conventional (Automatically) optimization.
Opt. qtr1 qtr2 qtr3 qtr4 Sum Gap
Win
Proposed 33.3 29 29.1 35.2 126.6 13.9 7
Automatic 28 29.1 31.5 28.4 117 0.1 5
Data
Simple RNN
Proposed method
DATA 2022 - 11th International Conference on Data Science, Technology and Applications
496

Therefore, the effectiveness of the proposed method
should be evaluated by the effect of the actual
basketball game data with changing players based on
the proposed method.
5.1 Accumulation of the Simulation
Video Game Data
In this section, we describe the experiments of the
line-up optimization using NBA2k21(Homepage of
NBA2k21), the basketball simulation video game
developed by Visual Concepts and published by 2K
Sports, based on the games played in 2020-2021 in
the NBA league.
This game has two playing modes: the mode
with the function that video game players can
change basketball players in arbitrary time, and the
mode that the computer (system) changes the
basketball players automatically for the number of
times that video game players set as parameters in
advance. Note that the timing of the change follows
the timing of NBA regulation. In this experiment,
we accumulate simulation video game data by
playing NBA2k21 by changing the basketball player
using the proposed method (score prediction model
and line-up optimization) for 7 times following the
NBA rule. We set the same home and away team
and same basketball game stadium. We played the
game, as well as the situations of each data, were
common during the games. We evaluate the results
by the sum of the getting points and the gap
(difference) between the getting points and losing
points. Comparing each quarter's results for the two
optimizations and the better result is represented by
the bold number. The results indicate that the
proposed optimization is superior than automatic
optimization.
5.2 Result of the Experiment
The results of the simulation experiments using the
video games for each quarter and the sum of the
obtained scores and the gap points are in Table 3.
We describe the result in Table 3. As shown in Table
4, in some quarters proposed optimization method is
superior, and quarters the automatic optimization;
however, the proposed method tends to be better.
The summary of the result (average score and the
number of game wins for each quarter for each
optimization) is shown in Table 3. Note that the
t-test shows differences in each average value
without quarter 3. From the result, we see that the
proposed method can lead to the offense ability of
the team by the player optimization at an arbitrary
time, and we indicate the effectiveness of our
proposal.
5.3 Discussion
In this study, our objective is to optimize the
basketball players in a game. Moreover, using our
proposal, the discussion of optimal line-ups for each
situation can be considered. However, because the
simulation data is accumulated for only ten times,
and the game situation is different, it is difficult to
summarize the data. Here, we show the score
predictions for the line-ups optimization in Figure 5
and indicate the features and problems of our
method.
The figure shows that our method tends to
predict that the small ball strategy is the best in the
first half of the game, and the bench line-up strategy
is best in the second half. Also, the normal ball
strategy tends to be not selected as the best strategy.
In terms of strengthening the offensive ability, these
decisions should be reasonable; however,
considering the offensive perspective, we should
consider the getting score and losing score. For
example, learning the gap score can be the solution
by setting the output as the gap score. Moreover,
because this game data has only the result of 10
games, discussion of the members' strategy is not
capable. We need more data for the detailed
consideration of the experiment.
Nevertheless, there are some difficulties; the
results indicate that our method can improve the
team strength, and these results showed the
effectiveness of our approach. Improving the model
and increasing the dataset to learn the model lead the
better game strategy.
6 CONCLUSION
In this study, to determine the combination of
basketball members in terms of the offensive ability,
the real-time game situation is considered. We (1)
constructed a highly accurate prediction model for
changing the members considering the situation at
any given time, and (2) proposed a model to
determine the optimal line-up composition in real-
time. For constructing the model, we applied a RNN
model that analyses time-series data as a basis and
combined a NN model that incorporates player
combinations, and game conditions, past scores as
the factor for deciding the upcoming score for the
five plays.
Line-up Optimization Model of Basketball Players and the Simulation Evaluation
497
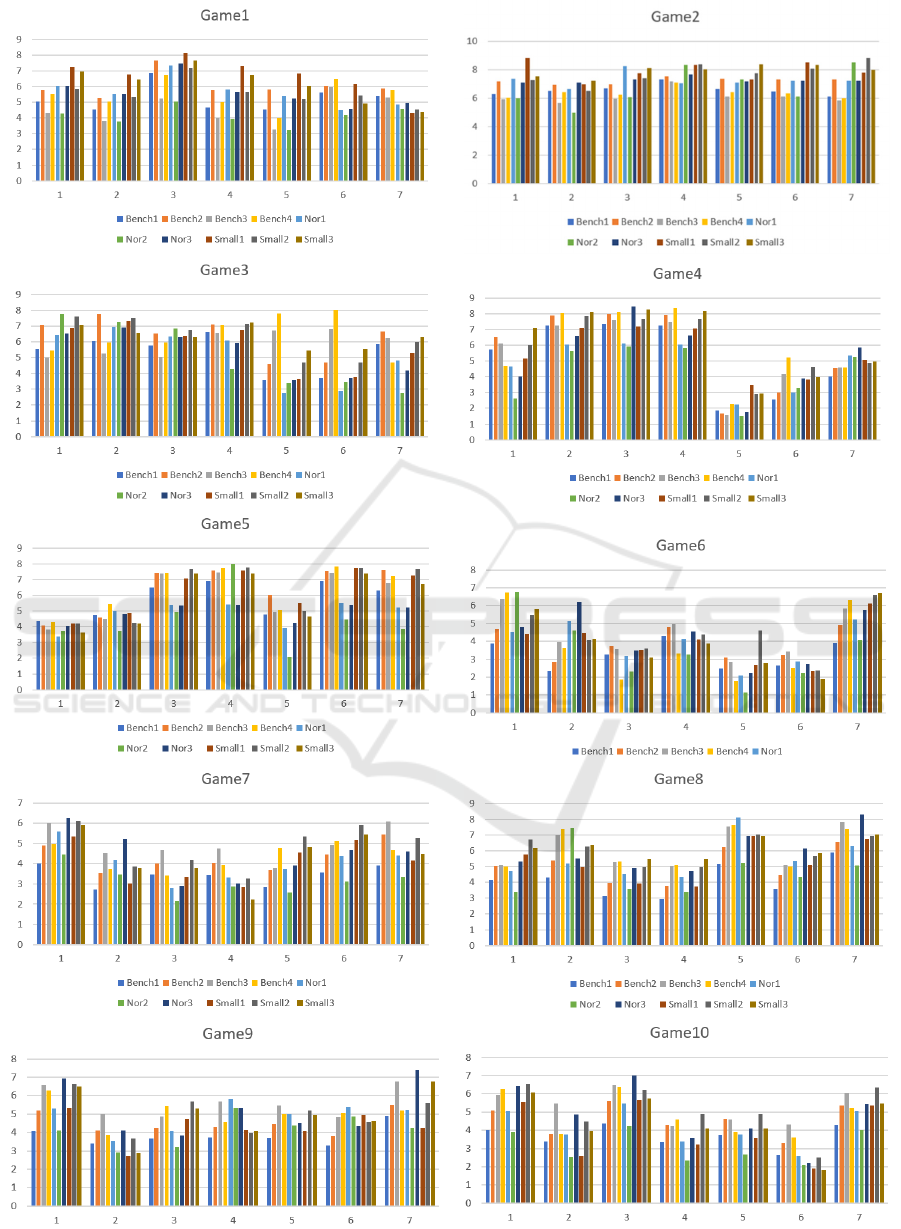
Figure 5: Quatre indices (x-axis) and the predicted score (y-axis) of each combination of members for 10 games.
DATA 2022 - 11th International Conference on Data Science, Technology and Applications
498

The modeling considers to take line-ups into
account for the score prediction. Furthermore, to
demonstrate the validity of the proposed model, this
study evaluated the accuracy of prediction using data
collected from real games, and effectiveness of the
model using play data of a basketball simulation
game and conducted a simulation experiment in
which members were successively replaced.
There remains future works about the data
constructions. First future work is to expand the data
not only for focusing the Lakers. The data
accumulation needs enormous time, the support
system is required. The next future work is to
increase the number of input variables for more
reasonable prediction. Also, the consideration of the
objective value should be the future work.
Furthermore, we restricted the line-ups in advance.
In the real situation, we should consider every
pattern. Therefore, the effective optimization
algorithm such as branch cutting method should be
considered. Finally, the preferable model evaluation
is to use the method in the real basketball games,
and evaluate the performance of our method can be
derived.
REFERENCES
Homepage of National Basketball League,
https://nbl.com.au/
Nourayi, M. M. "Strategically Driven Rule Changes in
NBA: Causes and Consequences." The Sport Journal ,
Vol.2, published online, 2019.
Homepage of Los Angels Lakers: https://www.nba.com/
lakers
Wang, Y., Yamashita, H. "Lineup Optimization Model of
Basketball Players Based on the Prediction of
Recursive Neural Networks", International Journal of
Economics and Management Engineering Vol:15,
No:3, 2021.
Mikolov, T., Kombrink, S., Burget, L., Černocký, J., &
Khudanpur, S., Extensions of recurrent neural network
language model. In: 2011 IEEE international
conference on acoustics, speech and signal processing
(ICASSP). IEEE, pp. 5528-5531, 2011.
Mccullagh, J., "Data mining in sport: A neural network
approach." International Journal of Sports Science and
Engineering. Vol.4, no. 3: 131-138, 2010.
NBA2k2, https://nba2k.jp/nba2k21/
Hojo, M., Fujii, K., and Kawahara, Y. "Analysis of
factors predicting who obtains a ball in basketball
rebounding situations," International Journal of
Performance Analysis in Sport, Vol.19, no.2, pp.192-
205.
Piette, J., Anand, S., and Pham, L. "Evaluating basketball
player performance via statistical network modeling."
The 5th MIT Sloan Sports Analytics Conference.,
published online, 2011.
Fewell, J. H., Armbruster, D., Ingraham, J., Petersen, A.,
and Waters, J. S., "Basketball teams as strategic
networks," PloS one, Vol. 7, no.11, e47445, 2012.
Rajiv, S., and Romijnders, R.. "Applying deep learning to
basketball trajectories." arXiv preprint
arXiv:1608.03793, published online, 2016.
Wang, K, and Zemel, R. "Classifying NBA offensive
plays using neural networks." Proceedings of MIT
Sloan Sports Analytics Conference. Vol. 4., published
online, 2016.
Clemente, F. M., Martins, F. M. L., Kalamaras, D., and
Mendes, R. S. "Network analysis in basketball:
Inspecting the prominent players using centrality
metrics." Journal of Physical Education and Sport, Vol.
15, no.2, p.212, 2015.
Luong, M. T., Socher, R., and Manning, C. D. “Better
word representations with recursive neural networks
for morphology,” In Proceedings of the seventeenth
conference on computational natural language learning
pp. 104-113, 2013.
Greff, K., Srivastava, R. K., Koutník, J., Steunebrink, B.
R., and Schmidhuber, J.. “LSTM: A search space
odyssey, ” IEEE transactions on neural networks and
learning systems, Vol. 28, no. 10, pp. 2222-2232, 2016.
Zhao, Y., Yang, R., Chevalier, G., Shah, R. C., and
Romijnders, R.. Applying deep bidirectional LSTM
and mixture density network for basketball trajectory
prediction. Optik, 158, pp. 266-272, 2018.
Yin, W., Kann., K., Yu, M., and Schütze, H.,
"Comparative research of CNN and RNN for natural
language processing." arXiv preprint
arXiv:1702.01923, published online, 2017.
APPENDIX
This study is supported by JSPS grant number
21K14369.
Line-up Optimization Model of Basketball Players and the Simulation Evaluation
499
