
Lowering Big Data Project Barriers: Identifying System Architecture
Templates for Standard Use Cases in Big Data
Matthias Volk, Daniel Staegemann, Akanksha Saxena, Johannes Hintsch, Naoum Jamous
and Klaus Turowski
Magdeburg Research and Competence Cluster (MRCC), Otto-von-Guericke University, Magdeburg, Germany
njamous@gmail.com, klaus.turowski@ovgu.de
Keywords: Big Data, Project, Use Case, Architecture, Technologies, Design Science Research.
Abstract: For almost a decade now, big data has become the foundation of today's data-intensive systems used for
various disciplines, such as data science or artificial intelligence. Although a certain level of maturity has been
reached since then, not only in the domain itself but also in the engineering of interconnected systems, many
problems still exist today. The number of available technologies and architectural concepts, whose application
is often very use case-specific, makes the successful implementation of big data projects still a non-trivial
undertaking. To overcome this problem and deliver support with the realization of a related project, existing
standard use cases in this domain are analyzed, and architectural concepts are derived through the design
science research methodology. By observing essential criteria, like use case descriptions as well as relevant
requirements, decision-makers can harness architectural concepts and technology recommendations for their
setup.
1 INTRODUCTION
For almost a decade now, big data has become the
foundation of today's data-intensive systems.
Implemented in many different adhering application
areas, such as data science, artificial intelligence, or
cyber-physical systems, more organizations than ever
are harnessing the benefits that come together with
the usage of related tools and technologies (Müller et
al. 2018). According to one of the most prominent
definitions, big data represents “extensive datasets
primarily in the characteristics of volume, variety,
velocity, and/or variability that require a scalable
architecture for efficient storage, manipulation, and
analysis” (Chang and Grady 2019a).
Although the domain of big data has become
mature in recent years, various challenges still exist,
primarily related to the engineering of related
systems. This can be noticed in many surveys and
numerous research articles, such as (Ataei and
Litchfield 2020; Davoudian and Liu 2020). Hence, it
doesn't seem surprising that big data projects'
realization still represents a sophisticated
undertaking. This situation is reinforced by multiple
aspects. Today, a vast number of architectural
concepts for the domain of big data exist that are
intended to help potential decision-makers, project
managers, and all other affiliated persons in this
domain. However, in many cases, those are very
specific in terms of the targeted use case. According
to the ISO 42010:2011 (ISO 2011), a system
architecture describes “fundamental concepts or
properties of a system in its environment embodied in
its elements, relationships, and in the principles of its
design and evolution“. Hence, these represent a
decisive link between the functionalities to be
achieved by a system, the requirements to accomplish
these, and the tools and technologies that will help to
fulfill them (Davoudian and Liu 2020; Sommerville
2007).
1.1 Research Goal
To overcome this problem, reference architecture
attempts to generalize some of the denoted
information in terms of the considered requirements,
technologies, and interconnections. Famous
examples of these are the Lambda (Marz and Warren
2015), Kappa (Jay Kreps 2014), and NIST-Big Data
Reference Architecture (NIST 2019). Despite that,
these are primarily generalized regarding their
Volk, M., Staegemann, D., Saxena, A., Hintsch, J., Jamous, N. and Turowski, K.
Lowering Big Data Project Barriers: Identifying System Architecture Templates for Standard Use Cases in Big Data.
DOI: 10.5220/0011307700003280
In Proceedings of the 19th International Conference on Smart Business Technologies (ICSBT 2022), pages 33-44
ISBN: 978-989-758-587-6; ISSN: 2184-772X
Copyright
c
2022 by SCITEPRESS – Science and Technology Publications, Lda. All rights reserved
33
applicability. For a potential user, who is not an
expert in this domain, most of these can be rather seen
as a reference to how a system could be created. Even
though some of these provide potential technologies
that might be applicable (Pääkkönen and Pakkala
2015), they often neglect details that may either help
for a specific implementation context, the selection of
concrete tools and technologies as well as their
combination.
Matt Turck (Turck 2021) proposes the landscape
that encompasses related technologies on a yearly
basis. Concurrently, a list is maintained, which backs
the proposed landscape up. Although some of the
entries are no longer valid, the sheer size of almost
1500 entries reinforces this problem (Turck 2022). By
solely observing the rising number of existing big
data tools, the situation exacerbates almost day by
day, resulting in an increased complexity to oversee
this domain.
In contrast to this, specific use case descriptions,
which are published via research articles, white
papers, or blog entries from different companies,
encompass predominantly very specific information
tailored for the targeted undertaking. Although these
are a valuable sources of information (Ebneyamini
and Sadeghi Moghadam 2018), not only the search
and analysis of the multitude of existing use cases can
be a time-consuming and cumbersome task.
Additionally, the transferability to a personal project
cannot be guaranteed. Hence, a mediating instance is
required to identify a potential architectural layout.
In a recently published research article by Volk et
al. (2020), a thorough use cases analysis was
performed, resulting in the definition of nine distinct
standard use cases (SUC). Within the contribution at
hand, it shall be investigated how those could be used
to provide decision support when it comes to
developing a suitable big data architecture. Thus, in
the course of this work, the following research
question shall be answered: “How can architectural
concepts for standard use cases in big data be
created?”
To approach the creation stepwise and provide
future researchers and practitioners decision support
regarding their selection, the following sub-research
(SRQ) questions will be answered.
SRQ 1: “Which information are required to
create general architectures for
standard use cases in big data?”
SRQ 2: “How can the data be utilized to provide
decision support regarding their
selection for a planned big data
project?”
1.2 Methodology
To find an answer to the research questions
mentioned above, the design science research (DSR)
methodology is applied (Hevner et al. 2004; Peffers
et al. 2007). In particular, the recommended
workflow by Peffer et al. (2007) is used, according to
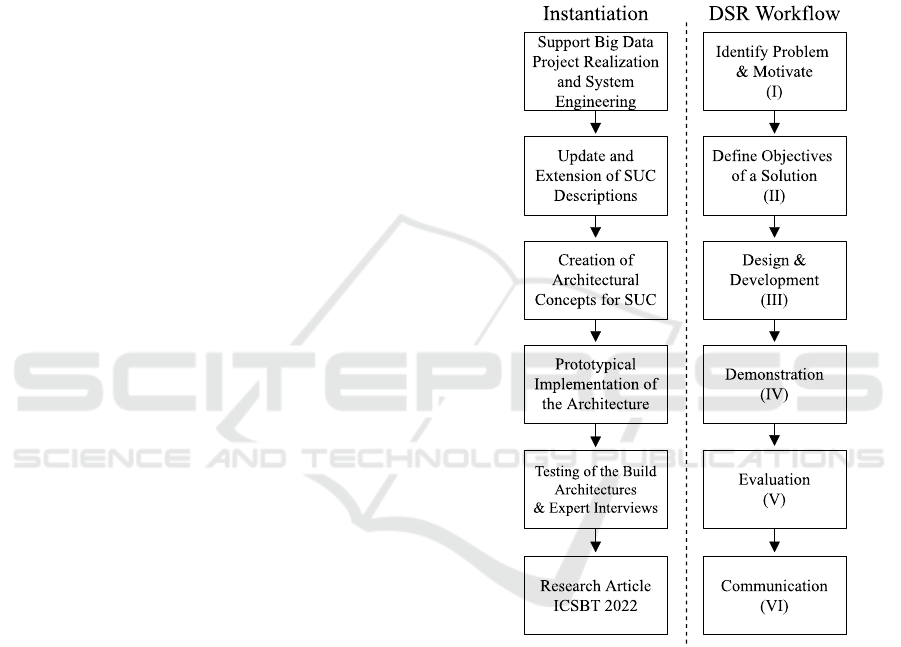
which six essential steps are required. An overview of
each of the conducted DSR steps and their
instantiation is depicted in
Figure 1.
Figure 1: Applied Design Science Research Methodology
(Peffers et al. 2007).
Apart from an initial motivation (I), the main
objectives (II) need to be stated. Then, the relevant
background and state of the art need to be observed to
start with the artifact's design and development (III).
After that, a demonstration (IV) and evaluation (V)
are required. Eventually, the results need to be
communicated (VI), which is realized by this research
article itself. While the introduction already fulfilled
the steps (I) and (II), the research background is
covered in the upcoming sections.
There, essential information about the already
referred standard use cases are presented, which
ICSBT 2022 - 19th International Conference on Smart Business Technologies
34

builds the foundation for the contribution at hand.
Here, it is further stated how those were created
(section 2). The authors of the related research articles
recognized only articles from completed years (here
until the end of 2018) to simplify future revision. For
an up-to-date version, the missing part between 2019-
2021 is covered. To do so, a structured literature
review, following the same steps from (Volk et al.
2020b), is conducted. The design and development
(III) will occur in the same-named third section.
Based on the made findings, for each SUC,
requirements engineering and a tool identification are
conducted, as well as specific architectural concepts
derived, to facilitate a comprehensive foundation for
a potential decision making. Afterward, the
demonstration (IV) and a two-folded evaluation (V)
are presented and discussed in section 4. The paper
ends with concluding remarks.
2 STANDARD USE CASES FOR
BIG DATA
Through the use of a complex procedure that is
comprised of a literature review (1), use case analysis
(2), and agglomerative clustering approach (3),
within the already introduced contribution provided
by Volk et al. (2020b), a total of nine distinct SUC
were formed out of 39 specific big data use cases.
In particular, an initial literature review (1) of
completed years was performed, using academic and
non-academic sources, to gather existing literature
describing detailed use cases in big data. The
comprehensiveness was evaluated with various
inclusion and exclusion criteria and a modified
version of the NIST template to define big data use
cases (Chang and Grady 2019b). After that, features
were identified by checking the remaining use cases
in detail. The similarity between them was measured
afterward using an agglomerative clustering
approach. By an additional manual mapping of
outliners, the final cases were formed.
Potential users of the formed SUC may receive
general information for the setup of their related
projects and detailed knowledge when checking the
aligned used cases in detail (Volk et al. 2020b). Apart
from specific technologies, tailored architectural
concepts are listed in each of those related use cases.
However, this is currently not the case for the SUC
themselves. An excerpt for each of the identified SUC
is depicted in
Table 1. Besides the particular number,
title, and short description, the number of aligned
cases (#) is highlighted.
Table 1: An excerpt of the SUC descriptions according to
(Volk et al. 2020b).
No Name Description #
1 Data
Analysis
Improvement
Analysis of the massive amount
of unstructured data originating
with high speed from a different
source increases data quality.
8
2 Batch-Mode
Sensor Data
Analysis
Integration of different data
sources and enabling the data
exchange between users and
applications. Data typically
comes in an unstructured format
that is gathered and processed in
batch mode. The visualization of
the processed data is crucial to
represent the findings.
3
3 Smart City Utilization of data from various
devices and human actors to
improve life in a smart city. For
this purpose, structured,
unstructured, and transient and
permanent data can be used as
analysis input. Suitable storage
and real-time processing
solutions are required.
6
4 Multi-Level
Problems
Consideration of complex
problems that require data from
different sources. The solution
offers high reliability and the
ability to efficiently search,
query, and store the data in an
unstructured format. By
following privacy-preserving,
these shall be analyzed in batch
mode.
3
5 Expand Data
Sourcing
The data comes from various
resources that need to be
combined into one functioning
system. The data, as well as the
structure can be highly volatile.
The data is usually processed in
batch mode, and different
techniques are used for the
collection cleaning.
4
6 Data
Connection
Use of various big data
technologies to facilitate
querying and searching a large
information basis with the intent
of special processing steps in
real-time. This may include,
among other things, techniques
like anonymization or
classification, which may
significantly impact the overall
decision-making, depending on
the application area.
3
Lowering Big Data Project Barriers: Identifying System Architecture Templates for Standard Use Cases in Big Data
35
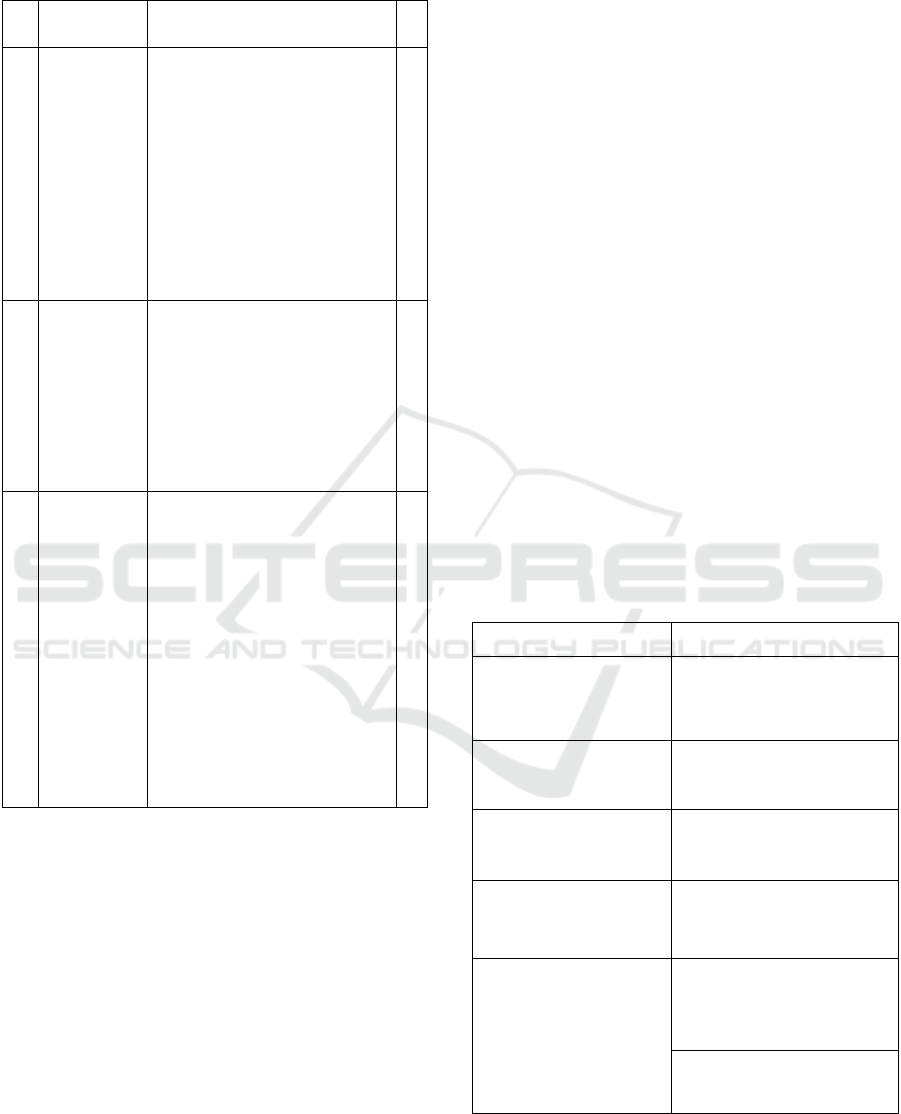
Table 1: An excerpt of the SUC descriptions according to
(Volk et al. 2020b) (cont.).
No Name Description #
7 Decision
Support
Real-time analytics on
differently structured data to
facilitate decision support for
data-driven problems. Through
basic statistics, classifications,
and other analytical methods,
previously unused data are
converted into valuable
information. For a better
presentation of the obtained
results, visualization techniques
are fundamental.
3
8 High-Speed
Analysis
(Pre) processing of data that
comes in a structured and
unstructured format to ensure
that all functionalities and results
can be immediately provided.
For an understandable
representation of the results and
the performed calculations,
visualization is required.
6
9 Process
Optimization
Data incoming with high
velocity needs to be processed in
real-time, both in a structured
and unstructured format. Also,
batch-mode processing mode
should be available either as a
backup solution or for specific
analytical tasks. Clustering
techniques support the
identification of
recommendations with which
existing processes can be
optimized. Visualization
techniques can be used for
presentation.
3
2.1 A Literature Review for Extending
Standard Use Cases in Big Data
As described before, all of the previously introduced
SUC were built using comprehensively described use
cases. For the initial literature review, the focus was
not only put on scientific literature databases but also
on information that was provided by practitioners.
Due to the big differences in the quality, which are
not only to be expected when comparing individual
contributions but also between scientific and non-
scientific publications, various quality assessments
were carried out. More specifically, the NIST
template for the description of big data use cases
(Chang and Grady 2019b) was applied in a slightly
modified form, similar to (Volk et al. 2020b), to
determine the information density and suitability of
each use case. The use case was further considered if
all of the required information could be filled. To
achieve an updated version of the previously created
SUCs, this procedure was carried out again, but
explicitly for the completed years 2019, 2020 and
2021.
In conformance with well-known approaches
(Levy and Ellis 2006; Webster and Watson 2002), at
first, a structured literature review was conducted, the
same way as described in (Volk et al. 2020b), using
Scopus as a scientific meta-literature database. Here,
the search term “big data" AND ("use case" or "case
study) was used. The same procedure applies for the
investigation of further industry cases which were not
covered by academic publications. In doing so, the
Google search engine was used.
Not all of the found publications were deemed
relevant. For example, domain-specific publications
that solely focused on big data technologies were not
of specific interest. Because of that, further inclusion
and exclusion criteria were defined and utilized (Levy
and Ellis 2006). Whenever one of the inclusion
criteria was not met, or one of the exclusion criteria
was fulfilled, the paper was rejected. A list of all of
the criteria is presented in
Table 2.
Table 2: Applied inclusion and exclusion criteria of the
structured literature review.
Inclusion Criteria Exclusion Criteria
The paper describes in
detail a use case of big
data
The publication only
emphasizes the introduction,
development, or assessment
of new big data technologies.
The paper was published
between the years 2019
and 2021.
No data source is mentioned
in the paper.
The paper must be
written in English.
No information regarding the
data is present in the paper.
The technologies for the
realization are described.
No project or system
requirements are mentioned
in the paper.
The goals and
expectations of big data
technologies are defined.
Information regarding data
processing and analysis is not
available in the publication.
The data mentioned in the
literature do not possess big
data characteristics.
After achieving an initial set of results, those were
further refined by a two-stepped procedure,
concurrently observing the mentioned criteria. Only
ICSBT 2022 - 19th International Conference on Smart Business Technologies
36
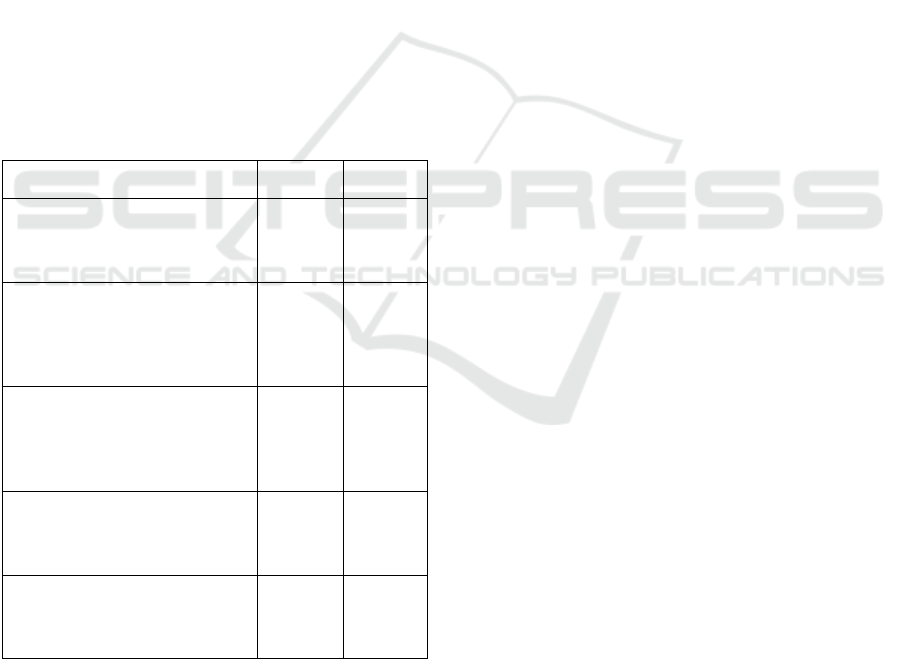
the title, abstract, keywords, and structure were
examined within the first step. In total, 34
publications were found in Scopus and only 2 in
Google.
Within the adhering step, those were checked in
terms of comprehensiveness. Each contribution was
read thoroughly, and the relevant information was
extracted to fill the modified NIST template from
(Volk et al. 2020b). After that, only four cases
remained from the Scopus search (Guerrero-Prado et
al. 2020; Isah and Zulkernine 2019; Jin et al. 2020;
Jnr et al. 2020) and only one from the Google search
(Wassouf et al. 2020). After finalizing the structured
keyword-based procedure, an additional forward and
backward search was performed. However, that
didn’t bring any additional cases. An overview of all
of those is listed in
Table 3. Since Scopus is rather
serving as a meta-database, the actual scientific
database is mentioned (DB). Notably here, although
not explicitly searched for, the Google search
revealed another scientific publication that fulfilled
the requested standard, thus, providing all relevant
information.
Table 3: Results of the literature review.
Found Articles
Origin DB
“High-performance IoT
streaming data prediction system
using Spark: a case study of air
p
ollution“
(
Jin et al. 2020
)
Scopus Springer
“Predictive analytics using big
data for increased customer
loyalty: Syriatel Telecom
Company case study“ (Wassouf
et al. 2020)
Google Springer
“Big Data Driven Multi-Tier
Architecture for Electric
Mobility as a Service in Smart
Cities: A Design Science
Approach“ (Jnr et al. 2020)
Scopus Emerald
Insight
“The power of big data and data
analytics for AMI data: A case
study“ (Guerrero-Prado et al.
2020)
Scopus MDPI
“A Scalable and Robust
Framework for Data Stream
Ingestion“ (Isah and Zulkernine
2019
)
Scopus IEEE
Xplore
2.2 Refinement of the Standard Use
Cases
Within the origin of this procedure (Volk et al.
2020b), all found contributions were further analyzed
quantitatively and qualitatively. In doing so, after the
detailed use case analysis, feature engineering, and
agglomerative clustering, some of the mappings were
manually performed, using the detailed information
of each use case. Similar to this, the same was
conducted in the contribution at hand.
Jin et al. (2020) discuss in their paper a high-
performance IoT data streaming prediction system.
The system relies on high-velocity data from various
IoT devices that are getting processed in a cloud
environment. As the core, Apache Spark is used. The
case study was mapped to the first due to similarities
in terms of the data to be processed, the performed
analysis, and many other features.
In the research article provided by Wassouf et al.
(2020), a service offering approach is proposed that
targets specific customers segments. Big data is used
here for the data analysis and improvements of
already present feature sets. The created architectures
build upon well-known big data technologies
provided by Apache, in particular Hadoop, Spark,
Zepplin, and Ambari. Due to the close relations to the
first SUC, this case study was assigned to it.
An approach to collect, process, and provide data
to enhance electric mobility in smart cities is
proposed (Jnr et al. 2020). Here, an architecture is
introduced that utilizes Hadoop, Spark, and CouchDB
in a smart city context. Based on the given
descriptions regarding the processed data, which are
structured and unstructured here, as well as their
distribution between different users or devices in a
smart city context, the case study is assigned to the
third SUC.
The paper provided by Guerrero-Prado et al.
(2020) describes a big data implementation of smart
metering that helps to understand user consumption
patterns in the city of London. The proposed
architecture is based on the NIST reference
architecture (NIST 2019). This use case connects data
from different sources and uses statistical methods
and machine learning algorithms for processing that
data. Based on the close similarities to the sixth SUC,
a mapping to this one was conducted.
The last paper from Isah and Zulkernine (2019)
proposed an architecture that integrates Apache NiFi
and Kafka to process high-velocity data streams from
social media. Apart from that, Apache Spark and
multiple business intelligence tools are used for
predictive analytics. After a comprehensive check
and comparison, the case study was mapped to the
eights` SUC. While examining each of the newly
found cases, the SUC and their already assigned cases
were qualitatively checked on an individual base (cf.
Table 2). For SUC 1, the article from (La Marra et al.,
2017) describes a smart home approach where
Lowering Big Data Project Barriers: Identifying System Architecture Templates for Standard Use Cases in Big Data
37

multiple sensors collect data and evaluate it for usage
control policies. Unfortunately, it lacks detailed
information regarding the used technologies, which
are required for general SUC technology
recommendation and particular architecture setups.
Due to this reason, it was removed from the cluster.
In particular, the following changes were made: to
SUC 1 (Jin et al. 2020; Wassouf et al. 2020); were
added; to SUC 3 (Jnr et al. 2020) was added; to SUC
6 (Guerrero-Prado et al. 2020) was added; to SUC 8
(Isah and Zulkernine 2019) was added, the remaining
SUCs (2,4,5,6,7,9) stayed unchanged.
3 DESIGN AND DEVELOPMENT
After each SUC was updated, a further in-depth
analysis was performed to design and develop the
intended architectural concepts. In doing so, best
practices were utilized, particularly the ISO
15288:2015 (ISO, 2015), as it proposes a structured
procedure for creating the related system. To define
an architecture, first, a thorough overview of the
current body of knowledge is required, comprising
essential information about existing approaches and
potential elements. This step was already performed
with the literature research within the original
contribution, the previous update, and an initial
investigation regarding promising reference
architectures. Then, requirements relevant for the
system construction need to be developed,
encompassing functional (FR) and non-functional
requirements (NFR). These are proposed in the
following sub-section (cf. 3.1). All of the essential
details are finally brought together to engineer the
related system architectures within the last sub-
section.
3.1 Requirements Engineering
Requirements represent essential details about the
functionalities of a system and its habits (ISO 2018;
Sommerville 2007). As a critical part of the
aforementioned procedure, the requirements
engineering for each of the SUC is done. Hence,
qualitative analysis for all of the included use cases,
of each cluster was performed. At first, the essential
functions of a planned system, addressed within each
use case description, were gathered, refined and
generalized.
To find the common explanations for most of
them, not only the individual cases but also the
contributions by Volk et al. (2020a; 2021) were used,
in which extensive research was carried out, focusing
on those. A total of 26 different FR could be defined
in this way. To achieve better assignability and later
usability for the FR. A further categorization was
made into data ingestion, data preparation, data
analysis, data result delivery, and system operation
functionalities, as they are in many cases the most
relevant technology categories for related projects
and systems. This can also be ascertained by
comparing those to existing categorization and
reference architectures (NIST 2019; Pääkkönen and
Pakkala 2015).
The overarching categories for the FR commonly
denote essential steps to realize data-intensive
projects. This was influenced by the approach of
(Volk et al. 2020a), who examined famous
approaches, such as the knowledge discovery in
databases (KDD) and the Cross-industry standard
process for data mining (CRISP-DM), to derive a
categorization approach for big data technologies.
Some of the addressed functionalities are not bonded
to the respective FR category, instead, they can also
be seen as the overall system capability. For instance,
clustering and classification can additionally be
attributed to the category of data analysis (DA).
Since most of the existing NFR conflict with each
other and are hard to formulate, the consideration
cannot be easily realized by boolean true and false
answers, as it is the case for the FR. Instead,
individual ratings might be required that highlight the
severity of each of them (Farshidi et al. 2018;
Sommerville 2007; Volk et al. 2021).
In the recently published work by Volk et al.
(2021), a multi-criteria decision-making method for
big data projects was proposed that incorporates
different FR and NFR in a multi-stepped procedure.
After identifying each of the basic functionalities a
system may fulfill, further specifications of the NFR
are made. Here, to highlight the individual
importance of each of those, a rating from 1 to 5 is
given.
Similar to the commonly known Likert scale
(Boone and A. Boone 2012), it ranges from very low
(1) to very high (5). A value in this range was defined
for every single use case, individually highlighting
the importance of each NFR. Whenever the
requirements were neither considered nor implicitly
or explicitly described, we assigned a score of one. A
score of five was allocated if a requirement was
explicitly addressed. We used the values in between
were if the NFR was implicitly highlighted (4),
indicated by additional information (3), or only slight
hints were recognized (2). Then, in one cluster, the
median for all of them was calculated to get the
specific value for each SUC.
ICSBT 2022 - 19th International Conference on Smart Business Technologies
38

Table 4: Functional (FR) and non-functional requirements (NFR) of each SUC.
No.
Non-Functional Requirements (NFR) Functional Requirements (FR)
UI IM FS C CC RE SC SE DS FT AV S R DI DP DA DD SO
1. 5 3 5 4 4 3 5 3 3 3 5 2 5
EP,MH,
P,ST,SD,
SS,SU
A,CF,
CL,CU,F
MH,NP,
PP,RP,ST
PL,RP
CM,M,
RC,RM
2. 5 4 5 2 2 2 5 2 2 2 3 2 5 SD,SU
A,CF,CL,
U,F
BP,PP, PL,RP -
3. 5 5 5 4 3 4 5 4 3 4 5 3 5
P,SE,
SD,SS,SU
CF,CL,
CU,F
MH,NP,
RP
PL,RP CM
4. 3 3 5 3 3 3 3 5 3 5 4 3 4
EP,P,
ST,SU
- BP,RP - M,RC
5. 5 5 5 3 4 2 5 5 3 5 5 2 5
SE,SD,
SS,SU
CL,F NP PL,RP
CM,M,
RC,RM
6. 5 5 5 3 3 3 5 2 3 2 5 4 5
EP,P,SE,
SD,SU
CF,CL,
CU,F
- PL,RP RC
7. 5 4 5 3 3 3 5 5 4 5 5 2 5
SE,SU,
SD
CF,CL,
CU,F
BP,RP RP -
8. 5 4 5 3 5 4 5 5 3 5 5 3 5
SE,ST,
SD,SU
CF,CL,
CU,F
PP,BP,RP RP -
9. 3 5 5 5 5 5 5 5 2 5 5 2 5
EP,MH,
SE,SS,SU
- BP - M,RC
NFR-UI: User Interface; IM: Installation and Maintenance Effort; DS: Documentation and Support; FS: Flexibility and
Scalability; S: Speed; C: Cost; CC: Computational Complexity; RE: Regulations; SC: Storage Capacity; SE: Security; FT:
Fault Tolerance; AV: Availability; S: Sustainability; R: Reliability; FR-Categories-DI: Data Ingestion; DP: Data
Preparation; DA: Data Analysis; DD: Data Result Delivery; SO: System Operation FR-Specific-A: Aggregation; AA:
Automation Acting; BP: Batch Processing; CF: Classification; CL: Cleaning; CU: Clustering; CM: Cluster Management;
CP: Consistency Preservation; EP: Event Processing; F: Formatting; ML: Machine Learning; MH: Message Handling; MO:
Monitoring; NP: Near Real-time Processing; P: Pipelining; PP: Parallel Processing; PL: Plotting; RP: Real-time Processing;
RC: Recovery Mechanics; RP: Reporting; RM: Ressource Management; SE: Selection; SD: Store Structured Data; SS:
Store Semi-Structured Data; SU: Store Unstructured Data; ST: Streaming
3.2 Standard Use Case Architectures
Concurrently to the identification of the different
tools, multiple components were defined, as they
have been frequently named and addressed within the
individual use cases. Sometimes, single tools were
very prominent in almost all use cases, such as
Apache Hadoop with the Hadoop Distributed File
System (HDFS). Others used various alternative
tools, indicating the uniqueness of the project and the
decisions for setting up the architecture beyond.
Especially at this point, it was noticed, presumably
due to the academic background and thus the
preference for non-commercial software, some less
common solutions were used for different
components. This applies, for instance, to the data
storage (DST) component, where in one of the SUC
Apache Phoenix was involved. An overview of all of
the found tools, their respective components, and the
mapping to the respective SUC is presented in the
morphological box below (cf.
Table 5). If an element
was not further identified, the individual cell was
blackened. Otherwise, the acronym was given. For a
potential user, after finding out which of the
requirements might be relevant for a planned
endeavor, this information can be used to identify
required components as well as initial ideas for the
potential tools. In conformance with the
recommended procedure to create system
architectures, introduced at the beginning of this
section (ISO, 2015), now the connections of each
component had to be revealed to form the specific
architectures. Similar to the investigation carried out
so far, the results of the qualitative analysis were used
to identify the architectural setups. The depicted
deployment diagram in
Figure 2 contains all of the
interconnections of the specified components, found
during the qualitative analysis of the individual cases
of each SUC. A simple connection line was used for
every default connection without any further
description. In turn, whenever a connection was
special for a SUC, this is indicated by the identifier
on top of that connection. For instance, in SUC 2, the
data sources were directly connected with the storage.
In every other case, a connection of the central
processing engine was realized through the data flow
Lowering Big Data Project Barriers: Identifying System Architecture Templates for Standard Use Cases in Big Data
39
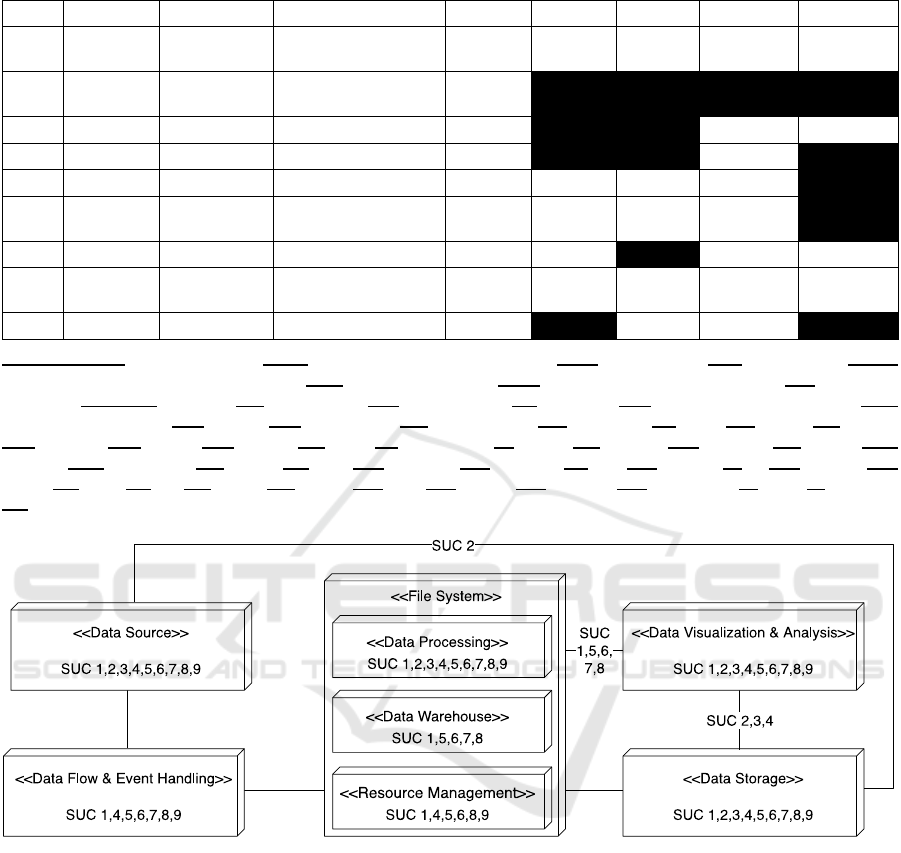
Table 5: Morphological box describing the SUC architecture components.
SUC DP DAV DST FSY DW RMO DFE AP
1. SP,PI,HA
Z, KI, CW,
PY, R
AS3, CA, HB, DC,
ES, MD, PG, RE
HD, LS HI
Y, RA,
AM
F, SQ, K GI, LU
2.
SP, ST,
HA, S4
CW, BI
DY, CA, HB, MD,
PG, TR, RE
HD
3. SP, HA CW, BI CD, MD, PG HD K GI, MA
4. SP CW MD, PG HD K
5. HA CW PG HD HI ZO FL
6.
SP, HA,
SO
Z, TA, BI
HB, ES, FD, PG,
BD, PH
HD HI ZO FL, SQ
7. SP, HA CW, BI HB, PG HD IS, HI FL, SQ MA
8.
SP, ST,
PI, HA, FI
CW, TA
HB, MD, PG, N4,
OD, RI, RE
HD IS, HI Y NI, K
GI, MA,
LU
9. HA, SP CW DC, PG HD, LS Y FL
Components-DP: Data Processing; DAV: Data Analysis and Visualization; DST: Data Storage; FSY: File System; RMO:
Ressource Management and Operations; DW: Data Warehousing; DFE: Data Flow and Event Handling AP: Additional
Packages; Tools-AM: Ambari; AS: Amazon S3; BD: Berkeley DB; BI: BI Tools; CA: Cassandra; CD: CouchDB; CW:
Custom Web Interface; DC: dCache; DY: DynamoDB; ES: ElasticSearch; FD: Fusiki DB; FI: Flink; FL: Flume; GI: Giraph;
HA: Hadoop; HD: HDFS; HB: HBase; HI: Hive; IS: InfoSphere; K: Kafka; KI: Kibana; LU: Lucerne; LS: Lustre; MA:
Mahout; MD: MongoDB; N4: Neo4j; NI: Nifi; PG: Postgres; PH: Phoenix; PI: Pig; PY: Python; R: R; RA: Ranger; RE:
Redis; RI: Riak; S4: S4; SP: Spark; ST: Storm; SO: Solr; SQ: Sqoop; TA: Tableau; TR: Voldemort; Y: Yarn; Z: Zeppelin;
ZO: Zookeeper;
Figure 2: The architectural composition of the different components for each SUC.
and event handling component as the mediator.
Although this is not a mandatory prerequisite when
setting up the respective architecture, it delivers
essential details of the underlying architectures of the
single use cases.
Hence, potential decision-makers that are willing
to conduct a big data project, can utilize all of the
presented information to get an idea of their system
architecture. For a structured procedure, the details
delivered within the contribution at hand and the
related research articles of each SUC might be
required (Volk et al. 2020b). By keeping this in mind,
a specific procedure may start with the general
identification of the details of a planned endeavor (1).
Afterward, the list of existing SUC is observed and
compared in terms of the overall description, using
Table 1 (2). The potential SUC is then further checked
in detail. This includes the examination of the FR and
NFR (cf.
Table 4) and their importance (3). Either this
could be done by a manual approach, in which single
values are solely compared with each other, or other
sophisticated methods. For instance, in (Volk et al.
2021), a two-stepped procedure was proposed to
select big data technologies. Within the first step of
this procedure, FR are initially identified, regarding
planned system capabilities. Then, an analytical
hierarchy process is conducted. Similar multi-criteria
decision-making endeavors, with a similar context,
ICSBT 2022 - 19th International Conference on Smart Business Technologies
40
can also be found in further research, such as
(Farshidi et al. 2018; Sachdeva et al. 2016). However,
future research requires additional effort, considering
their investigation and integration.
After selecting the SUC, the morphological box
can be used to identify suitable technologies (4). For
each component, one technology can be chosen.
Although no precise details are delivered, which of
them could be suitable, the range of available tools
for the particular problem is heavily reduced.
Depending on the different components of the
overall architecture and their importance, these can be
then used and combined as suggested by the
deployment diagram in Figure 2. However, these are
only general recommendations for a potential
combination, serving as decision support.
Depending on the final purpose of the planned
architecture and the specificities of the selected
technologies, further compatibilities should be
considered here. Notwithstanding that, as one may
note, the procedure is similar to the conducted method
to create that SUC architecture, thus implicitly
following the used ISO 15288 (ISO 2015).
Summarizing that, this section delivered answers
to the aforementioned research questions. The
information depicted in
Table 4 and Table 5 provided
essential details about the information to be used,
answering sub-RQ 1. The derived procedure from the
already harnessed best practices allows a step-wise
procedure that provides decision-makers to select the
most suitable concepts for their undertaking, which
answers sub-RQ 2. Eventually, by taking all of the
given information in this section into consideration,
an answer to the main research question was given,
how architectural concepts for SUC can be created.
4 EVALUATION
The evaluation represents a crucial step for validating
a designed artifact in the DSR methodology (Hevner
et al. 2004; Peffers et al. 2007). As described within
the first section, the evaluation of the created
architecture catalog is performed. This is done in a
two-folded way. First, the procedure was tested by a
real-world implementation, using one of the use case
descriptions contained in one of the SUC (cf.
Table 1).
After that, additional expert interviews were
conducted to evaluate not only the technical aspects
but also the general sensibility.
4.1 Architectural Setup
For the demonstration and evaluation, the detailed
described use case from (Avvenuti et al. 2018) was
chosen that is located in SUC 1. Here social media
data are analyzed to identify the city and country
during any possible crisis. Since the primary focus of
this research is put on the architectural setup and not
the complete process, as it was described before, the
first step was skipped. Hence, the procedure was
directly started with the manual step-wise comparison
of the given FR and NFR. Concerning this, all
required information were extracted from the selected
article and cross-checked not only with the
information to the related but also other SUC (cf.
Table 4). After that Table 5 was used for the selection
of related tools. For each component, one solution
was selected. Following the baseline architecture, as
presented in Figure 2, a combination of all of these
was performed, resulting in an instantiation of the
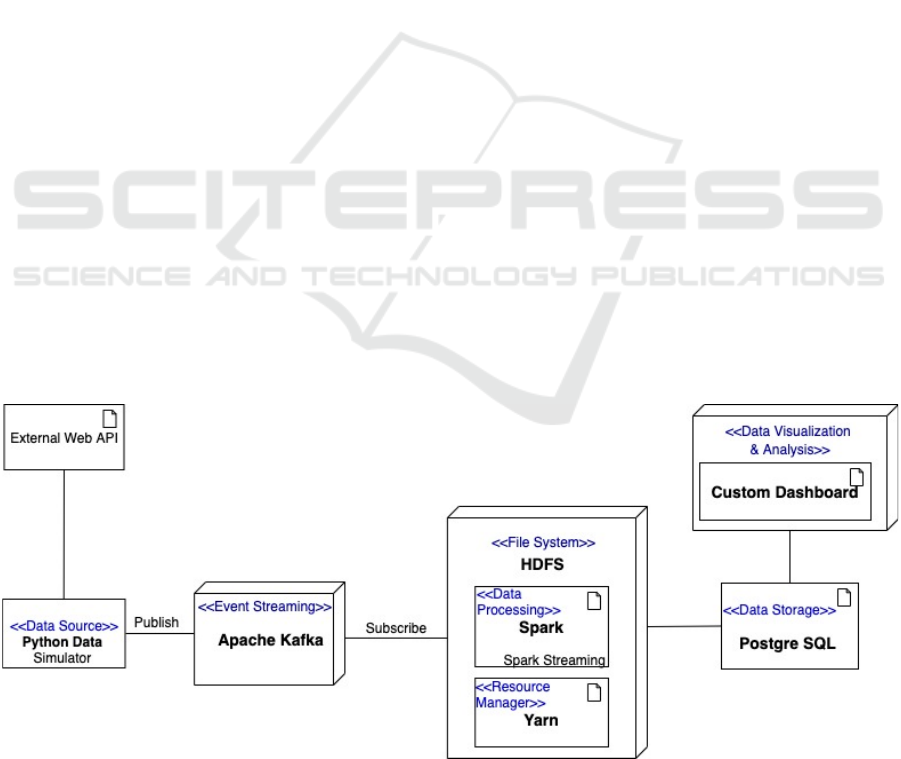
architecture shown in Figure 3.
Figure 3: The developed architecture for evaluation.
Lowering Big Data Project Barriers: Identifying System Architecture Templates for Standard Use Cases in Big Data
41

The implementation itself was realized in a
testbed using Docker. Due to the unavailability of the
dataset that was used in the related use case,
containing social media data, the required data was
simulated. By using the page “randomuser.me”
suitable data were extracted, replicated, and
forwarded in real-time to simulate the actual data
source. In particular, only relevant information that
are related to a specific location, including city and
country, were considered and published using Kafka.
In the end, the testbed consisted of Kafka, HDFS,
Spark, Yarn, PostgreSQL, and a custom python
program for visualization (cf.
Figure 1). The use of the
provided information in the previous section,
including also the architectural composition, helped
to realize and test the planned architecture
successfully.
4.2 Conducted Interviews
After the practical demonstration and evaluation, the
obtained results were further evaluated using
interviews. By following best practices and
guidelines provided by (Adams 2015), various
experts with an average of 8-10 years of experience,
one from academia and another three, were surveyed.
For that, we used multiple questions related to the
designed catalog information. In summary, together
with an interview guide, a total of seven categories,
each with numerous questions, were formulated and
asked within 45-60 minutes. All of the formulated
questions were open and ranged from beginner
questions, such as “What is according to you big
data?”, which were asked at the very beginning to
more sophisticated ones, like “In your experience,
how do the architectures differ in different use
cases?” or “Which functional and non-functional
requirements do you consider when setting up an
architecture?”. One out of four interviews was
conducted via telephone. The others were conducted
via email, which was mainly due to the strict schedule
and the lack of time the individual persons had in their
position as senior big data consultant (1), multi-
solution data architects (2), or data scientists (1). In
almost every interview, it turned out that the
developed FR and NFR were equally highlighted by
each interviewee (cf.
Table 4). However, here, even
more, are listed. Notwithstanding that, the categories
derived from those, which were later forming the
different components of the SUC architectures (cf.
Table 5), were also highlighted by the interviewees as
the essential parts of a big data architecture.
The construction and implementation of the
particular architecture have proven that generalized
architectures can be used to help realize big data
projects and also that those findings described in the
previous section are applicable for this kind of
undertaking. As a result, all RQ´s have been answered
and evaluated.
4.3 Discussion
Regardless of these positive results, some aspects
should be taken into account when using the made
findings. In particular, this concerns the
comprehensiveness, as well as the actuality, of the
discussed technologies. Many of these, found in the
contributions, do not necessarily represent the
industry standard. Instead, they are open-source
solutions, frequently used based on the basic
scientific idea of freely distributing knowledge. Thus,
users coming from industry and looking for all-
encompassing solutions may find them to be only
partly suitable. In addition, specific compatibility
issues, as they can sometimes exist between different
versions of tools or existing system components, were
not discussed. Users should pay attention to
appropriate interfaces here and consider the
documentation provided by the existing vendors.
Nevertheless, the extension and specification of
such problems are planned for future research. In
addition to the architecture and their
comprehensiveness, the process for the selection
should also be improved. Multi-criteria approaches,
as described above, seem to be particularly useful
here. Especially in this context, a computer-assisted
solution, such as decision support systems, appears to
be sensible. Beyond that, further large-scale
evaluations are planned, predominantly with
practitioners to identify potential shortcomings and
new research avenues.
5 CONCLUDING REMARKS
Based on a previous research article that attempted to
shed light on currently existing use case descriptions
(Volk et al. 2020b), an updated and extended version
of the introduced SUC was presented. Beyond that,
architectural information for potential
implementations were also constructed,
demonstrated, and evaluated, answering the initially
formulated research question, “How can
architectural concepts for standard use cases in big
data be created?”
A prospective user can utilize the presented
information and compare them to the specifics of a
planned endeavor. The given recommendation for
ICSBT 2022 - 19th International Conference on Smart Business Technologies
42

architectural construction can then be used to create a
tailored architecture without having the necessity to
uncover the nature of each of the related technologies
in this domain. Currently, all of the presented catalog
information need to be compared manually. In the
future, this approach shall be further evaluated,
extended, and implemented within a decision support
system that simplifies the planning and realization of
related projects during an interview with various
experts.
REFERENCES
Adams, W. C. (2015). Conducting semi-structured
interviews. Handbook of practical program evaluation
(4), pp. 492-505.
Ataei, P., and Litchfield, A. (2020). Big Data Reference
Architectures, a systematic literature review. ACIS
2020 Proceedings.
Avvenuti, M., Cresci, S., Del Vigna, F., Fagni, T., and
Tesconi, M. (2018). CrisMap: a Big Data Crisis
Mapping System Based on Damage Detection and
Geoparsing. Information Systems Frontiers (20:5), pp.
993-1011 (doi: 10.1007/s10796-018-9833-z).
Boone, H. N., and A. Boone, D. (2012). Analyzing Likert
Data. Journal of Extension (50:2), pp. 1-5.
Chang, W., and Grady, N. (2019a). NIST Big Data
Interoperability Framework., Gaithersburg, MD: NIST
Big Data Public Working Group, Definitions and
Taxonomies Subgroup.
Chang, W., and Grady, N. (2019b). NIST Big Data
Interoperability Framework: Volume 3, Use Cases and
General Requirements. (doi: 10.6028/NIST.SP.1500-
3r2).
Davoudian, A., and Liu, M. (2020). Big Data Systems: A
Software Engineering Perspective. ACM Computing
Surveys (53:5) (doi: 10.1145/3408314).
Ebneyamini, S., and Sadeghi Moghadam, M. R. (2018).
Toward Developing a Framework for Conducting Case
Study Research. International Journal of Qualitative
Methods (17:1), 160940691881795 (doi: 10.1177/1609
406918817954).
Farshidi, S., Jansen, S., Jong, R. de, and Brinkkemper, S.
(2018). A decision support system for software
technology selection. Journal of Decision Systems
(27:sup1), pp. 98-110 (doi: 10.1080/12460125.2018.14
64821).
Guerrero-Prado, J. S., Alfonso-Morales, W., Caicedo-
Bravo, E., Zayas-Pérez, B., and Espinosa-Reza, A.
(2020). The power of big data and data analytics for
AMI data: A case study. Sensors (Switzerland) (20:11),
pp. 1-27 (doi: 10.3390/s20113289).
Hevner, A. R., March, S. T., Park, J., and Ram, S. (2004).
Design Science in Information Systems Research. MIS
Quarterly (28:1), p. 75 (doi: 10.2307/25148625).
Isah, H., and Zulkernine, F. (2019). A Scalable and Robust
Framework for Data Stream Ingestion. Proceedings -
2018 IEEE International Conference on Big Data, Big
Data 2018, pp. 2900-2905 (doi: 10.1109/BigData.20
18.8622360).
ISO. (2011). ISO/IEC/ IEEE 42010 Systems and software
engineering — Architecture description. Functional
Analysis and Its Applications (16:4), pp. 319-321 (doi:
10.1007/BF01077867).
ISO. (2015). International Standard ISO/IEC/IEEE 15288
Systems and Software Engineering - System life cycle
processes. ISO (17:1), p. 108.
ISO. (2018). International Standard ISO / IEC / IEEE 29148
Systems and Software Engineering — Life Cycle
process - Requirements Engineering. ISO/IEC/IEEE
29148:2018.
Jay Kreps. (2014). Questioning the Lambda Architecture:
The Lambda Architecture has its merits, but
alternatives are worth exploring., available at
https://www.oreilly.com/ideas/questioning-the-
lambda-architecture, accessed on Mar 1 2022.
Jin, H. Y., Jung, E. S., and Lee, D. (2020). High-
performance IoT streaming data prediction system
using Spark: a case study of air pollution. Neural
Computing and Applications (32:17), pp. 13147-13154
(doi: 10.1007/s00521-019-04678-9).
Jnr, A. B., Petersen, S. A., Ahlers, D., and Krogstie, J.
(2020). Big Data Driven Multi-Tier Architecture for
Electric Mobility as a Service in Smart Cities: A Design
Science Approach., pp. 1-25.
La Marra, A., Martinelli, F., Mori, P., and Saracino, A.
(2017). Implementing usage control in internet of
things: A smart home use case. Proceedings - 16th
IEEE International Conference on Trust, Security and
Privacy in Computing and Communications, pp. 1056-
1063 (doi: 10.1109/Trustcom/BigDataSE/ICESS.20
17.352).
Levy, Y., and Ellis, T. J. (2006). A Systems Approach to
Conduct an Effective Literature Review in Support of
Information Systems Research.
Marz, N., and Warren, J. (2015). Big data: Principles and
best practices of scalable real-time data systems,
Shelter Island, NY: Manning.
Müller, O., Fay, M., and vom Brocke, J. (2018). The Effect
of Big Data and Analytics on Firm Performance: An
Econometric Analysis Considering Industry
Characteristics. Journal of Management Information
Systems (35:2), pp. 488-509 (doi: 10.1080/0742122
2.2018.1451955).
NIST. (2019). NIST Special Publication 1500-6 NIST Big
Data Interoperability Framework : Volume 6 -
Reference Architecture. (6:June).
Pääkkönen, P., and Pakkala, D. (2015). Reference
Architecture and Classification of Technologies,
Products and Services for Big Data Systems. Big Data
Research (2:4), pp. 166-186 (doi: 10.1016/j.bdr.20
15.01.001).
Peffers, K., Tuunanen, T., Rothenberger, M. A., and
Chatterjee, S. (2007). A Design Science Research
Methodology for Information Systems Research.
Journal of Management Information Systems (24:3), pp.
45-78 (doi: 10.2753/MIS0742-1222240302).
Lowering Big Data Project Barriers: Identifying System Architecture Templates for Standard Use Cases in Big Data
43

Sachdeva, N., Singh, O., Kapur, P. K., and Galar, D. (2016).
Multi-criteria intuitionistic fuzzy group decision
analysis with TOPSIS method for selecting appropriate
cloud solution to manage big data projects.
International Journal of System Assurance Engineering
and Management (7:3), pp. 316-324 (doi:
10.1007/s13198-016-0455-x).
Sommerville, I. (2007). Software Engineering, eighth
edition, Addison-Wesley.
Turck, M. (2021). Red Hot: The 2021 Machine Learning,
AI and Data (MAD) Landscape., available at
https://mattturck.com/data2021/, accessed on Mar 20
2022.
Turck, M. (2022). The AI and Data Landscape., available
at http://dfkoz.com/ai-data-landscape/, accessed on
Mar 20 2022.
Volk, M., Staegemann, D., Bischoff, D., and Turowski, K.
(2021). Applying Multi-Criteria Decision-Making for
the Selection of Big Data Technologies. AMCIS 2021
Proceedings.
Volk, M., Staegemann, D., Jamous, N., Pohl, M., and
Turowski, K. (2020a). Providing Clarity on Big Data
Technologies. International Journal of Intelligent
Information Technologies (16:2), pp. 49-73 (doi:
10.4018/IJIIT.2020040103).
Volk, M., Staegemann, D., Trifonova, I., Bosse, S., and
Turowski, K. (2020b). Identifying similarities of big
data projects-a use case driven approach. IEEE Access
(8), pp. 186599-186619 (doi: 10.1109/ACCESS.20
20.3028127).
Wassouf, W. N., Alkhatib, R., Salloum, K., and Balloul, S.
(2020). Predictive analytics using big data for increased
customer loyalty: Syriatel Telecom Company case
study. Journal of Big Data (7:1) (doi: 10.1186/s40537-
020-00290-0).
Webster, J., and Watson, R. T. (2002). Analyzing the Past
to Prepare for the Future - Writing a Literature Review.
ICSBT 2022 - 19th International Conference on Smart Business Technologies
44
