
Air Quality Monitoring of Bangladesh (AQM): Data Driven Analysis
System
Noureen Islam
a
, Noor-E-Sadman
b
, Mahmudul Islam
c
and Mahady Hasan
d
Department of Computer Science & Engineering, Independent University, Bangladesh
Keywords:
Air Quality, Software System, Data Analysis, Machine Learning, IoT, Satellite Data, AQI, PM2.5.
Abstract:
Air pollution is a major concern for countries around the world. According to World Health Organization
(WHO), seven million people die worldwide every year caused by air pollution. Bangladesh has not only
serious pollution problems but also it is ranked first among the world’s most polluted countries with a PM2.5
reading of 76.9 microgrammes per cubic meter (µg/m
3
) in the year 2021 (AQI Bangladesh, 2021). In this
paper, we propose to develop a data-driven software system for monitoring the air quality of Bangladesh. Our
proposed system will provide atmospheric maps and charts for monitoring the current and future Air Quality
Index (AQI) of any area. We conducted an experiment for 1-year time span to observe the concentration level
and data patterns of PM2.5 in our country focusing on the transportation routes and industrial zones. The
data is collected from the sensors and satellites of different stations covering multiple areas. The results are
analyzed in the context of divisions, transportation stations, industrial zones, and time. For a variety of air
quality indicators, the experimental results were compared to IQAir AirVisual Pro and showed good results,
with very small differences between our obtained result and IQAir AirVisual Pro. Our goal is to mainly
monitor the industrial zones, power plants, divisions, and transportation routes as most toxic compounds are
formed there.
1 INTRODUCTION
Air pollution is a worldwide crisis with limited so-
lutions because of the presence of compounds in the
atmosphere that are detrimental to the wellness of
habitats or pose a hazard to the ecosystem or objects.
Bangladesh is a densely populated country struggling
with serious air pollution. According to the most
recent World Health Organization data, Dhaka’s air
quality averages 90 µg/m3 of PM2.5 concentration
per year. Dhaka, having a yearly Air Quality Index
of 168, is considered to be unhealthy and is indicated
only as a warning since air pollution can reach signif-
icantly up to 300 plus dangerous higher levels.
The World Bank began a 7-year investment of
USD $62.20 million in the Clean Air and Sustainable
Environment (CASE) project in 2009. The goal of
this project was to install 11 Continuous Air Qual-
ity Monitoring Stations (CAMS) among 8 cities to
monitor air pollutants and create real-time air qual-
ity data including an air quality index for important
a
https://orcid.org/0000-0002-5193-4730
b
https://orcid.org/0000-0002-7531-8537
c
https://orcid.org/0000-0002-3270-8877
d
https://orcid.org/0000-0002-9037-0181
cities. Under this project, Air Quality Research and
Monitoring Center (AQRMC) has been established
at Dhaka University, Bangladesh. According to the
CASE project report, $10 millions USD have already
been used but the progress is not visible (Air Pollu-
tion, 2021).
We have collected data from different areas of
Bangladesh using sensors and compared the result
with the data obtained by an industrial-graded device
called AirVisual Pro by IQAir. This comparison is
performed to determine the data compatibility and it
has been observed that the data we yielded had good
results. We have also implemented multiple machine
learning algorithms for predicting the AQI on AOD
550 nm data. However, in this paper, we propose
to develop a data-driven solution to monitor the air
quality that will collect data from IoT-based devices,
Aqua satellite, and geospatial weather data bank. The
Aerosol Optical Depth (AOD) data is determined to
be collected from satellites for those areas which are
not covered by AQM devices. Our system will gen-
erate atmospheric maps and various charts with the
help of different MLAs which will display the AQI,
PM1.0, PM2.5, PM10, CO, CO
2
, NO
2
, VOCs of dif-
ferent areas of Bangladesh. The AQI forecast will
Islam, N., Noor-E-Sadman, ., Islam, M. and Hasan, M.
Air Quality Monitoring of Bangladesh (AQM): Data Driven Analysis System.
DOI: 10.5220/0011306300003266
In Proceedings of the 17th International Conference on Software Technologies (ICSOFT 2022), pages 205-212
ISBN: 978-989-758-588-3; ISSN: 2184-2833
Copyright
c
2022 by SCITEPRESS – Science and Technology Publications, Lda. All rights reserved
205

help the government to make significant decisions for
maintaining the air quality.
The rest of this paper is organized as follows. Lit-
erature reviews have been discussed in section 2 while
the research problem is stated in section 3. Our pro-
posed solution to solve the research problem is pre-
sented in section 4. The experimental results have
been presented in section 5 and finally, in section 6
we have drawn the conclusion along with future re-
search scope.
2 RELATED WORKS
Around the world, in different countries, many sys-
tems have been developed to monitor air quality. So
far in Bangladesh, very few works have been done
related to Air quality monitoring systems. In this
research work, A number of conference papers and
journal articles related to air quality monitoring sys-
tems have been studied for a deeper understanding.
An air quality monitoring system was designed by
(Gu and Jia, 2019). The system’s modular architec-
ture allows it to carry a variety of air pollution sensors
and integrate data from all of them with geo-location
information in real-time. The prototype’s preliminary
field tests show that the onboard devices had no ef-
fect on the UAV’s power consumption or flight time.
A similar kind of system is also developed by (Kan-
naki et al., 2020), the entire operation is controlled
by a microcontroller, which receives input signals and
sends output signals to components such as the DC
Brushless Fan and LED lamps. (Sung et al., 2019)
also developed a system where PM1, PM2.5, PM10,
CO, CO
2
, VOCs, temperature and humidity have been
monitored. They used short and long-distance com-
munication modules such as Bluetooth, Wi-Fi, and
Lora to communicate with a developed smartphone
application.
A big data driven urban healthcare system was
proposed by (Chen et al., 2018) where a method
was introduced for combining multi-source air quality
data which help to prepare data for AI based smart ur-
ban services. A testbed was also established by them,
including the deployment of air quality aware health-
care applications. Similar kind of system was pre-
sented by(Meli et al., 2020) where the system enables
the deployment of many low-cost nodes throughout a
building, yielding considerable location-based indoor
air pollution data. A new concept of a portable system
named GASDUINO which enables the users to detect
air quality via IoT was introduced by (Karar et al.,
2020). Their technology can warn users about harm-
ful levels of air quality index (AQI) values ranging
from 0 to 200 PPM. It detects the AQI with the MQ-
135 sensor and visualizes the data using the Remote
XY Arduino cloud. A low-cost air quality measure-
ment system was developed by (Arroyo et al., 2019)
where volatile organic substances such as benzene,
toluene, ethyl benzene, and xylene are detected by the
system.
A study describes the evaluation of a smart in-
door air quality and health system conducted by (Patil
et al., 2019) , which aims to allow the users to moni-
tor oxygen level and provide alerts when the environ-
mental atmosphere breaches the safe limit threshold.
A Wireless Sensor Network (WSN) based system has
been developed by (Purwanto et al., 2019) that can be
accessed through smartphone and internet. With the
capability to measure air pollution environmental fac-
tors like temperature, humidity, wind speed, S
2
, NO
x
.
Air quality monitoring via an array of sensors which
transmit their toxic gas readings through Bluetooth to
the nearest smartphone introduced by (Yang and Li,
2015). The readings get updated every time the ap-
plication is installed in the smartphone and clicked.
WSN based air pollution monitoring system was pro-
posed by (Suganya and Vijayashaarathi, 2016). This
system used a Mobile Ad Hoc Network routing algo-
rithm, where 28 moving vehicles cover a large area.
Each vehicle covers 300 meters and collects the data
using air pollutant detecting sensors.
A real-time air monitoring system has been de-
veloped by (Holovatyy et al., 2018) where real-time
toxic gas data has been extracted with an array of sen-
sors to determine the concentration of deadly gases
and vapours in air. Similarly, a system developed
by (Kiruthika and Umamakeswari, 2017) where a set
of data is extracted from multiple sensors which had
some threshold values set by the system. While the
collected value exceeds the threshold value, the mes-
sage alert has been sent by the communication mod-
ule to the client. An air pollution Geo-sensor net-
work has been modelled by (Al-Ali et al., 2010) to
obtain the AQI (Air Quality Index) where sensors
are taking 24/7 real-time readings of CO, NO
2
and
SO
2
components and transmit the pollutant data to
a database through a server. (Dhingra et al., 2019)
developed a system to observe the concentration of
Carbon Monoxide (CO), Methane (CH
4
) and Carbon
dioxide (CO
2
) gases to measure the AQI. A platform
has been developed by (Zaldei et al., 2017) to moni-
tor air pollution and traffic movements which captures
CO, NO
2
, and C
2
concentrations using open-source
Arduino technology.
ICSOFT 2022 - 17th International Conference on Software Technologies
206
3 PROBLEM STATEMENT
The average annual PM 2.5 concentrations in
Bangladesh were 76.9 microgrammes per cubic meter
(µg/m3) which is seven times higher than the WHO
exposure guidelines. Dhaka the capital of Bangladesh
stands second among all cities around the world (AQI
Dhaka, 2021). To eliminate the climate change cri-
sis, we are proposing to develop an air quality mon-
itoring system which will forecast AQI using AOD
data from the satellite along with a device to detect
the concentration of pollutants and monitor the data
patterns in real-time. Our proposed AQM system, in
combination with the device, will help in forecast-
ing AQI in remote places where the devices cannot
be deployed. The forecast model of the AQM sys-
tem will also greatly reduce the cost of a large-scale
implementation of the air quality detection system by
reducing the quantity of device implementation. Our
collected data showed promising results with respect
to the industrial-approved device called AirVisual Pro
by IQAir. Therefore, we believe that our data-driven
air quality monitoring software system can be devel-
oped to monitor the air quality of Bangladesh and help
to take appropriate measures for decreasing air pollu-
tion.
4 PROPOSED SOLUTION
Inspired by the success of data-driven solutions, we
propose to develop a data-driven software system that
will be used to monitor and ensure the air quality of
Bangladesh. The main purpose of the proposed AQM
system is to improve air quality and to establish a low-
cost solution for improving AQI by monitoring the air
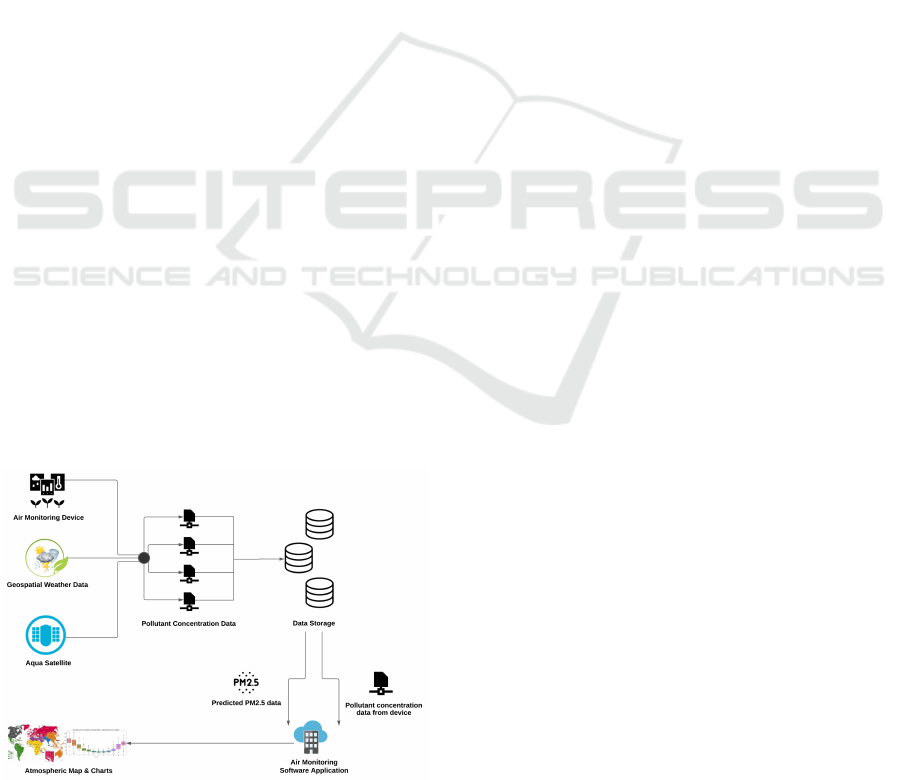
standard. A high-level diagram of the proposed AQM
system is presented in Figure 1.
Figure 1: High-level Diagram of AQM.
Our proposed AQM system will collect data
through different sensors which have been set in dif-
ferent regions of Bangladesh. Since it is not feasible
to set the sensors in every single place, therefore, the
system will also collect Aerosol Optical Depth (AOD)
550 nm data from Aqua Satellite for those areas which
are not covered under sensors and geospatial weather
data from Visual Crossing weather data bank. All the
data collected from the sensors, Aqua Satellite, and
the weather data banks will be stored in the cloud.
Data collected from different sensors are real-time
data whereas we get the previous day’s data from
aqua satellite and the weather data banks. Atmo-
spheric maps and charts will be generated based on
the stored real-time data collected from different sen-
sors. On the other hand, machine learning algorithms
and techniques will be applied on the data collected
from the aqua satellite, weather data banks and pre-
diction analysis will be performed. After prediction
analysis, atmospheric maps and charts will be gener-
ated and shown on the AQM system.
Figure 2 depicts the software system architecture
of our proposed AQM system where the air quality
data will be gathered from various sources i) Pollu-
tant data from IoT based air quality monitoring de-
vice ii) Aerosol Optical Depth (AOD) 550 nm data
from Aqua satellite iii) Geospatial weather data from
Visual Crossing weather data bank. Data obtained
from the IoT devices and the Geospatial Weather
Data along with the satellite data will be stored in a
Apache Cassandra NoSQL database. The real time
data from the AQM devices will be stored in the
database using MQTT protocol and Kafka connec-
tor whereas, the weather and satellite data in CSV
files will be imported directly using Apache Cassan-
dra. Real time data will be preprocessed using the
real time stream processing of the Apache Spark and
generate atmospheric maps and charts for different ar-
eas such as distinctive states, industrial zones, trans-
portation routes. Similarly, our proposed system will
operate a batch processing on the data collected form
AQM devices, weather, and satellite using the batch
processing tool of the Apache Spark. We will use
Apache Spark MLib tool to obtain prediction analy-
sis based on the preprocessed data and fit the machine
learning models to forecast air quality index (AQI).
Finally, the system will generate AQI-based atmo-
spheric maps and charts for the betterment of pollut-
ing areas and route monitoring.
Figure 3 shows the communication overview of
the MQTT and Kafka Connector used in our proposed
AQM system. In the AQM system the AQM Devices
will use MQTT protocol to feed sensor data to the
MQTT Broker, then using Kafka MQTT connector
Air Quality Monitoring of Bangladesh (AQM): Data Driven Analysis System
207
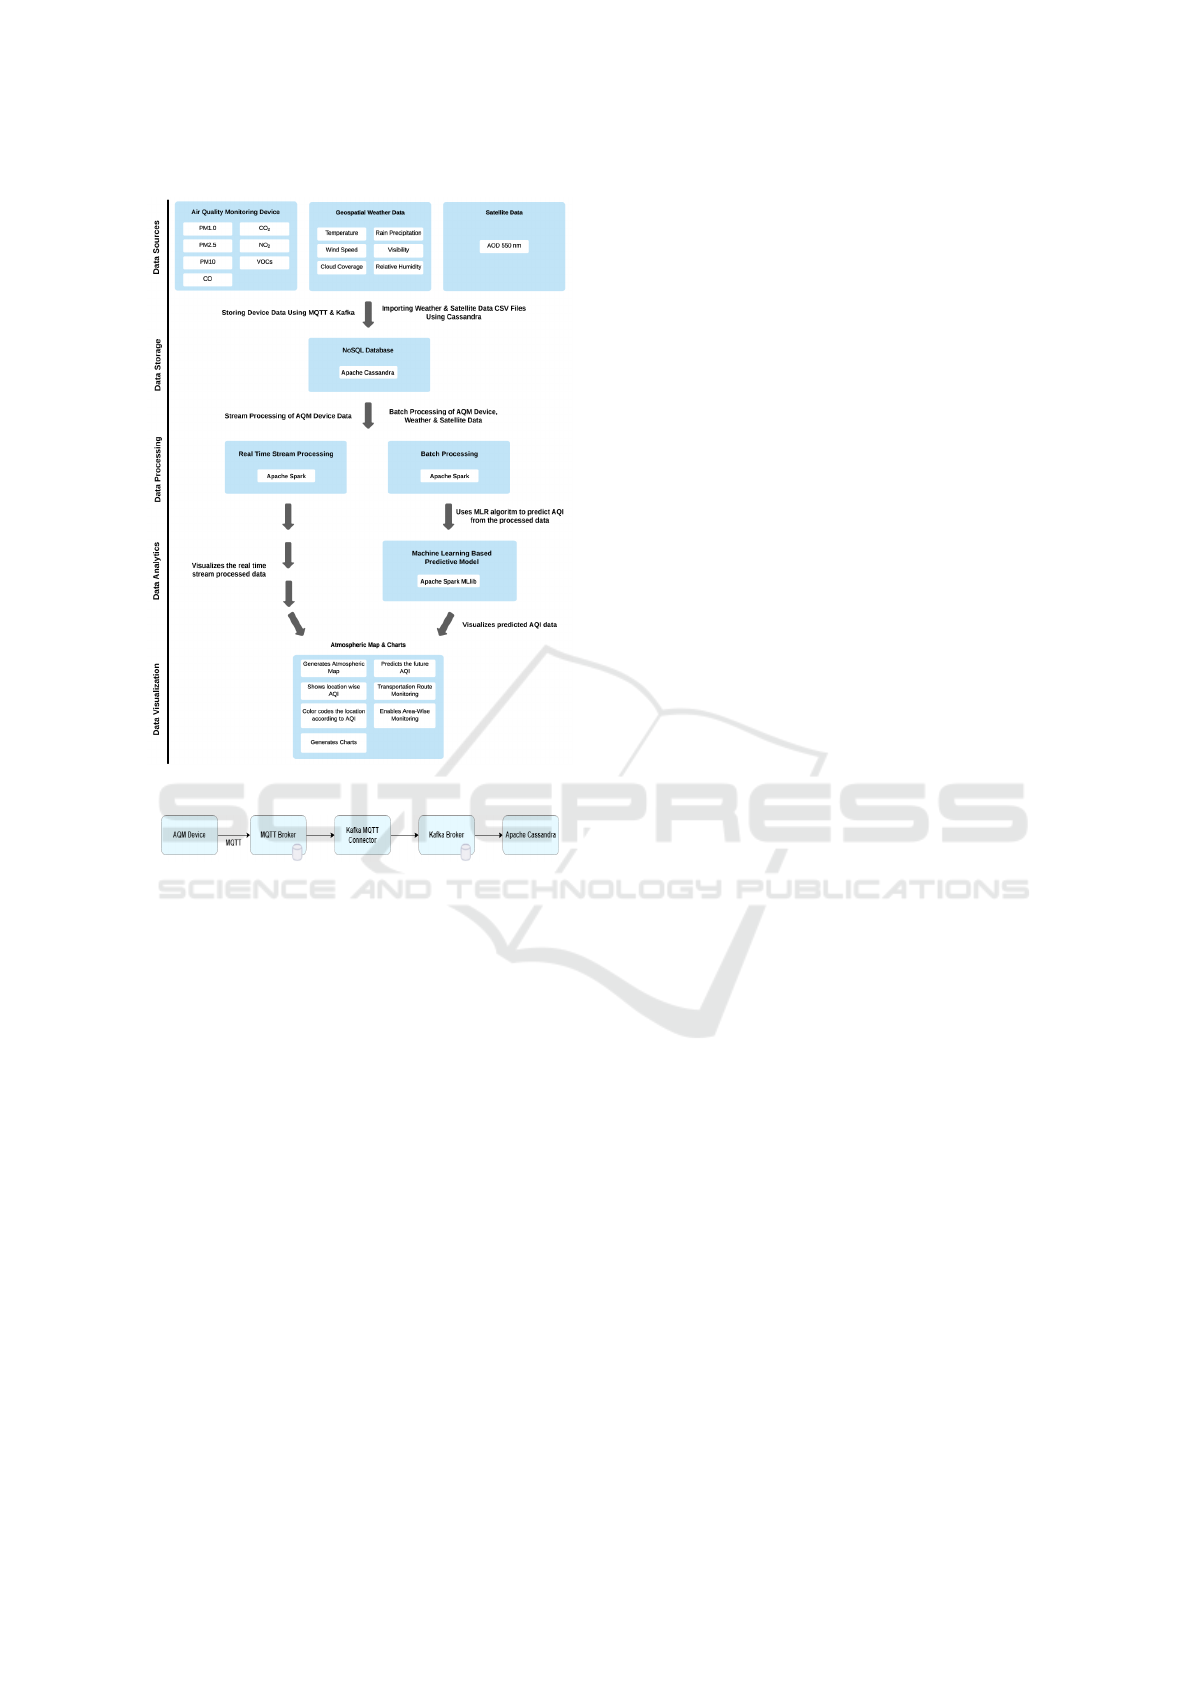
Figure 2: Software System Architecture of AQM.
Figure 3: Overview of the MQTT and Kafka Connector in
our proposed AQM system.
the data will be sent to the Kafka Broker from the
MQTT Broker. Finally, the sensor data will be stored
in the Apache Cassandra Database from the Kafka
Broker.
4.1 Data Collection
For the detection of contaminating toxic gases, it
is necessary to outsource the sensors with greater
accuracy that is available and inexpensive, keeping
in mind the budget-friendly factor. After sourcing
the sensors, it is vital to narrow down the suitable
methodologies that will lead the proposed system to
its outcome. To determine the most-fitted procedure,
it is better to do a literature review to execute the goal
and fix the steps. The stated process above will be
executed according to the proposition.
According to the proposition design, the sensors
will be mounted to multiple cars as nodes. When the
car is in motion, the device takes readings from sen-
sors every minute and uploads the data to the cloud
storage with the location and time stamp. It will use
in-built GSM module to upload the sensor’s data to
the cloud database server, then all the data will be pro-
cessed and published on the AQM system portal along
with temperature, relative humidity data and GPS in-
formation. We will collect data also from Aqua Satel-
lite of Aerosol Optical Depth (AOD) 550 nm data for
those places which are not covered by sensors. We
will use the NASA Giovanni data visualization tool
to get the satellite AOD 550 nm data. The available
AOD 550 nm data which we will obtain are prepro-
cessed using the Aqua Satellite’s MODIS (Moderate
Resolution Imaging Spectroradiometer) instrument.
Aqua satellite travels from the South to the North
Poles. The AOD 550 nm data is essentially the level-3
atmosphere daily global product (MYD08 D3), which
is produced from four level-2 MODIS AQUA atmo-
sphere products (MYD04 L2, MYD05 L2, MYD06
L2, and MYD07 L2). And, the geospatial weather
data will be collected from Visual Crossing weather
data bank.
4.2 Data Preprocessing
In our experiment, we started with data cleaning dur-
ing the data preprocessing phase. Initially, we identi-
fied all the missing data, noisy data, and global out-
liers caused due to equipment malfunction and have
inconsistencies with other recorded data using One-
Class Support Vector Machine (SVM). One-Class
SVM is used in one-class problems, in which all data
belongs to the same class. In One-Class SVM, the al-
gorithm knows the pattern of normal data therefore,
when new data comes it can identify whether the data
is normal or not. If not, the new data is classified as
anomalous. After identifying, we removed all missing
data, noisy data and global outliers. To accomplish
the data integration, the acquired AOD 550 nm data
from the Aqua Satellite, PM2.5 data from the ground
station, and geospatial weather data were merged into
a single coherent csv file. Data value conflicts such as
different scales were removed during the extraction of
the data as all the data were extracted in British Units.
Later on, the data were split into a 70:30 ratio respec-
tively for training and testing datasets.
Finally, data transformation was performed. Ex-
cept for the AOD 550 nm data, all the integrated data
was normalized by decimal scaling to two decimal
points. Decimal scaling the AOD 550 nm impacted
heavily in the prediction model thus it was discarded
from decimal scaling. Similarly, in our proposed sys-
tem we will be implementing the aforementioned data
preprocessing procedure.
ICSOFT 2022 - 17th International Conference on Software Technologies
208
4.3 Reporting
One of the most important parts of our proposed data-
driven air quality monitoring software system (AQM)
is to generate atmospheric maps or graphical reports.
The overall air quality and other pollutant data will be
calculated and displayed in the form of atmospheric
maps and charts which will help the decision-makers
to analyze air quality and to take initiatives for im-
proving the air quality. Our proposed AQM system
will generate atmospheric maps for divisions, indus-
trial areas, and transportation routes for both land and
marine which are presented below. Using real data,
we have generated multiple atmospheric maps and
charts. Our generated atmospheric map for all the di-
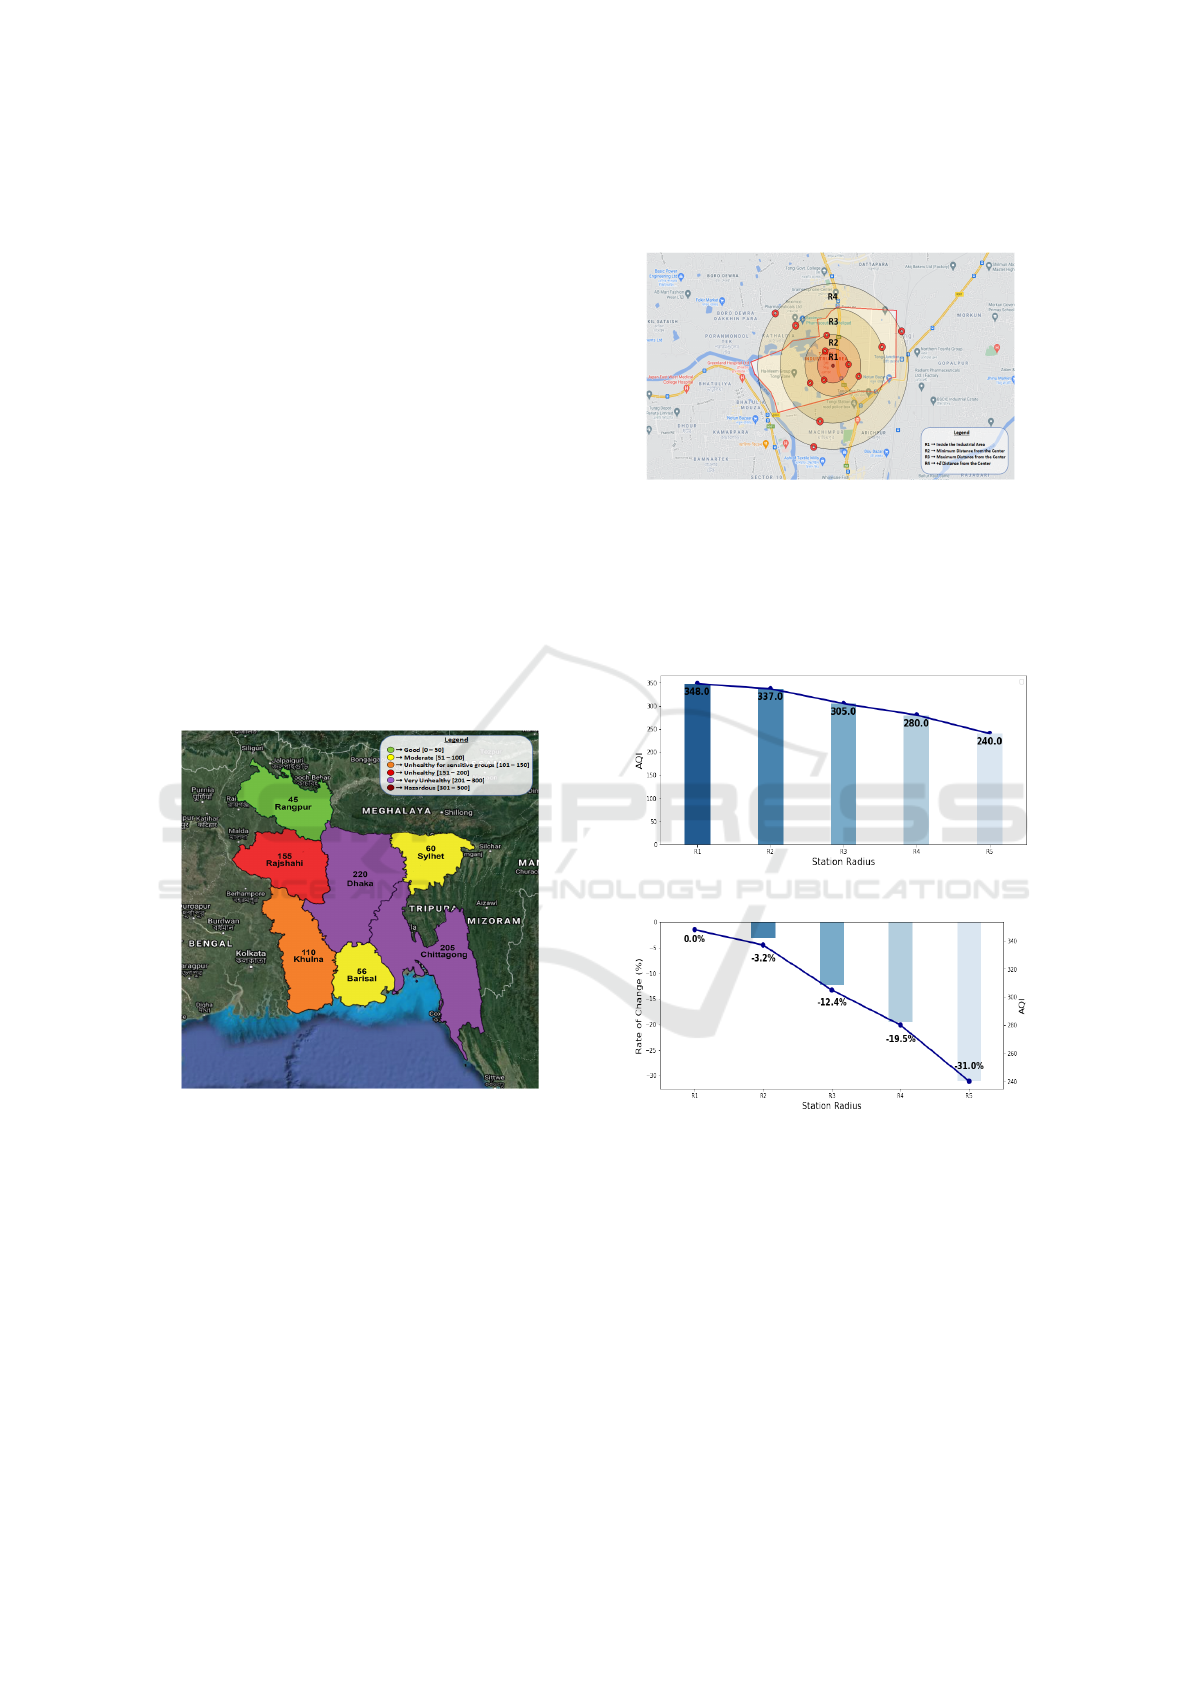
visions of Bangladesh is presented in Figure 4.
In Figure 4, air quality index (AQI) is shown for
all the divisions of Bangladesh such as Dhaka, Sylhet,
Chittagong, Barisal, Khulna, Rajshahi, and Rangpur.
All the divisions were color coded according to their
individual mean AQI. We have also generated a demo
atmospheric map for Tongi industrial area of Dhaka
City which is presented in Figure 5.
Figure 4: Overall Monitoring of Bangladesh.
The AQM system will also monitor the industrial
areas which will greatly help to reduce the pollution
in the environment. Figure 5 represents the Industrial
area monitoring. In Figure 5, R1 represents the cen-
ter of the industrial area where the level of pollution
is highest, R2 represents the minimum distance from
the center where all the sensor nodes are inside the
industrial area, R3 represents the maximum distance
from center where most of the sensor nodes are out-
side the industrial area, and R4 represents the +δ dis-
tance away from the center where all the sensor nodes
will be outside the industrial area. We have divided
the industrial area into circular areas and plan to place
three sensor nodes in every single circle which will be
used to read the AQI.
Figure 5: Industrial Area Monitoring.
Figure 6 depicts the mean AQI per station radius
for the industrial area which is shown in Figure 5. The
AQI is highest in the center R1 which means the con-
centration of pollution is highest in R1 and the AQI is
falling as distance increases, indicating that air quality
is improving.
Figure 6: Bar Chart of Mean AQI Per Station Radius.
Figure 7: Change of Rate of AQI Per Station Radius.
Figure 7 shows the rate of change in the AQI per
station radius for the industrial area depicted in Figure
5. The rate of change in the AQI increases negatively
as distance increases.
5 RESULT AND DISCUSSION
The purpose of making the IoT-based device is to
present a cheaper option and easily accessible to the
citizens of the country, so that they become alert of the
alarming situation which is not being addressed yet.
Air Quality Monitoring of Bangladesh (AQM): Data Driven Analysis System
209
Our IoT-based device detects many of the pollutants
like PM1.0, PM2.5, PM10, CO, CO
2
, NO
2
, Volatile
Organic Compounds(VOCs), and helps us keep track
of temperature and humidity.
However, in this experiment, the PM2.5 data were
separately monitored to determine the pollutant’s con-
centration level in our country for one year time
span. To observe the data, we incorporated multiple
PM2.5 detecting sensors by mounting them over the
local transports which travel only through that spe-
cific route throughout the day. The recorded data is
later uploaded to the cloud for each transportation
stop, also known as stations. In the following parts
of the discussion, the results are examined and user
interfaces have been developed for analyzing station-
wise, hourly, monthly, and season-wise data patterns.
Like every other experimental result, some outliers
have been distinguished into the data patterns which
we will be covering in the following research below.
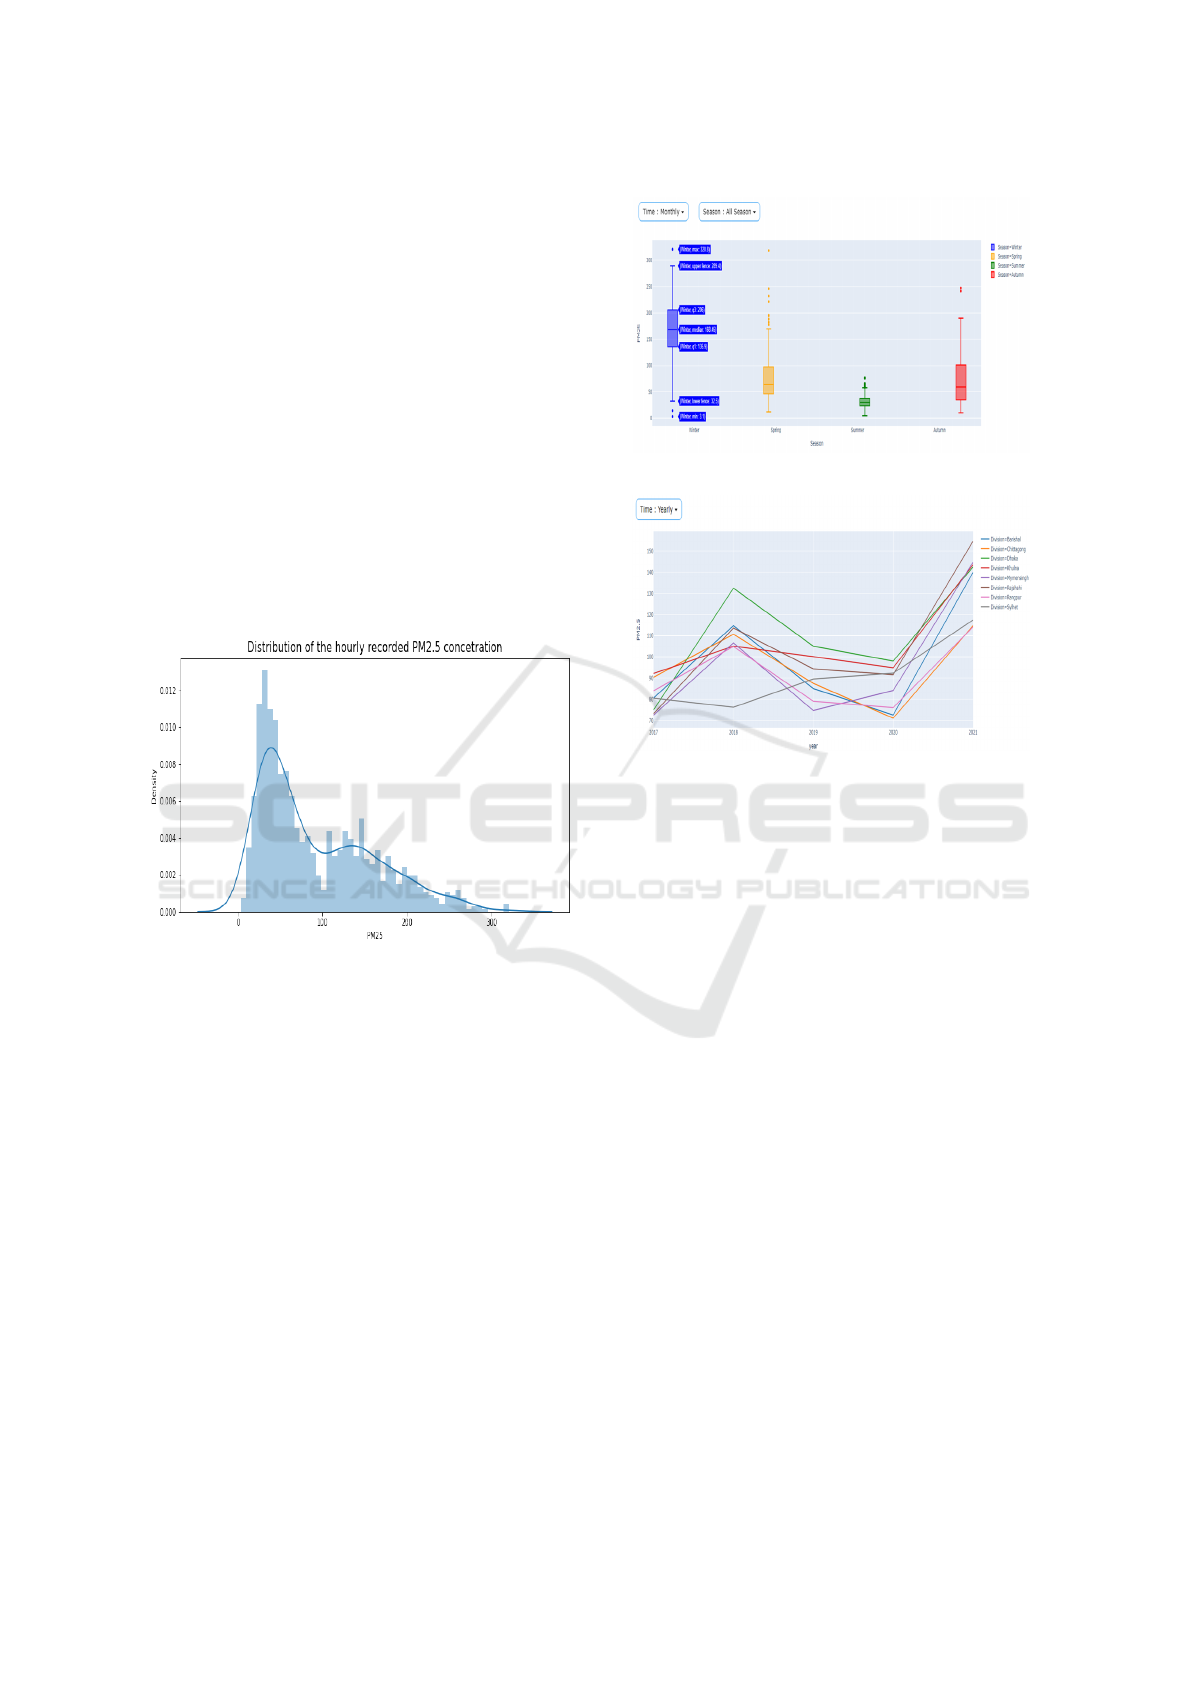
Figure 8: Data Distribution of PM2.5.
We have identified the data patterns in PM2.5 con-
centration readings. Figure 8 shows the data patterns
in PM2.5 concentration readings found in the busy
transportation route. The data was taken for one year
continually round the clock. We may deduce from
the distribution of PM2.5 data that the data is posi-
tively skewed. The majority of the PM2.5 concentra-
tion data falls on the lower bound in this positively
skewed distribution, although a rise in PM2.5 con-
centration during the daytime leads the distribution to
skew positively.
In our proposed system user interfaces will be
available so that users can observe the data with re-
spect to different times. Figure 9 presents the user
interface for the Box Plot diagrams portraying the
PM2.5 concentration behaviour in Bangladesh. The
drop-downs depend on the time chosen by the user on
the day, night, hourly, or monthly basis and the users
are independent to choose the season of their choices
Figure 9: Box Plot User Interface.
Figure 10: Division-Wise Time Based User Interface.
such as Winter, Spring, Summer, Autumn, or All Sea-
son.
There are different divisions in Bangladesh and
different divisions have a different levels of PM2.5
concentration since the population, the number of
transports, and factories are different. A division wise
time-based user interface for PM2.5 concentration be-
haviour in Bangladesh has been presented in Figure
10. This user interface displays PM2.5 for eight di-
visions such as Dhaka, Khulna, Barishal, Chittagong,
Rangpur, Rajshahi, Sylhet, and Mymensingh over the
year. Since the PM2.5 data are being updated to
the cloud according to the station, a station-wise box
plot diagram demonstrated in Figure 11 has the most
upper extreme and upper quartile in the most busy
routes.
Figure 12 presents the hourly box plot diagram
against PM2.5 and it has come to a surprise that the
most generation of PM2.5 occurs at the earliest time
of the day, evening and night-time. In the morn-
ing time, the routes are mostly used by citizens, dur-
ing the evening working citizens take the road and at
night-time, the paths are mostly occupied by trucks
and pickup vans for carrying goods.
The monthly box-plot diagram of PM2.5 data
in Figure 13 explains that the maximum production
of PM2.5 occurs during January, February, March,
November and December since the winter and au-
ICSOFT 2022 - 17th International Conference on Software Technologies
210
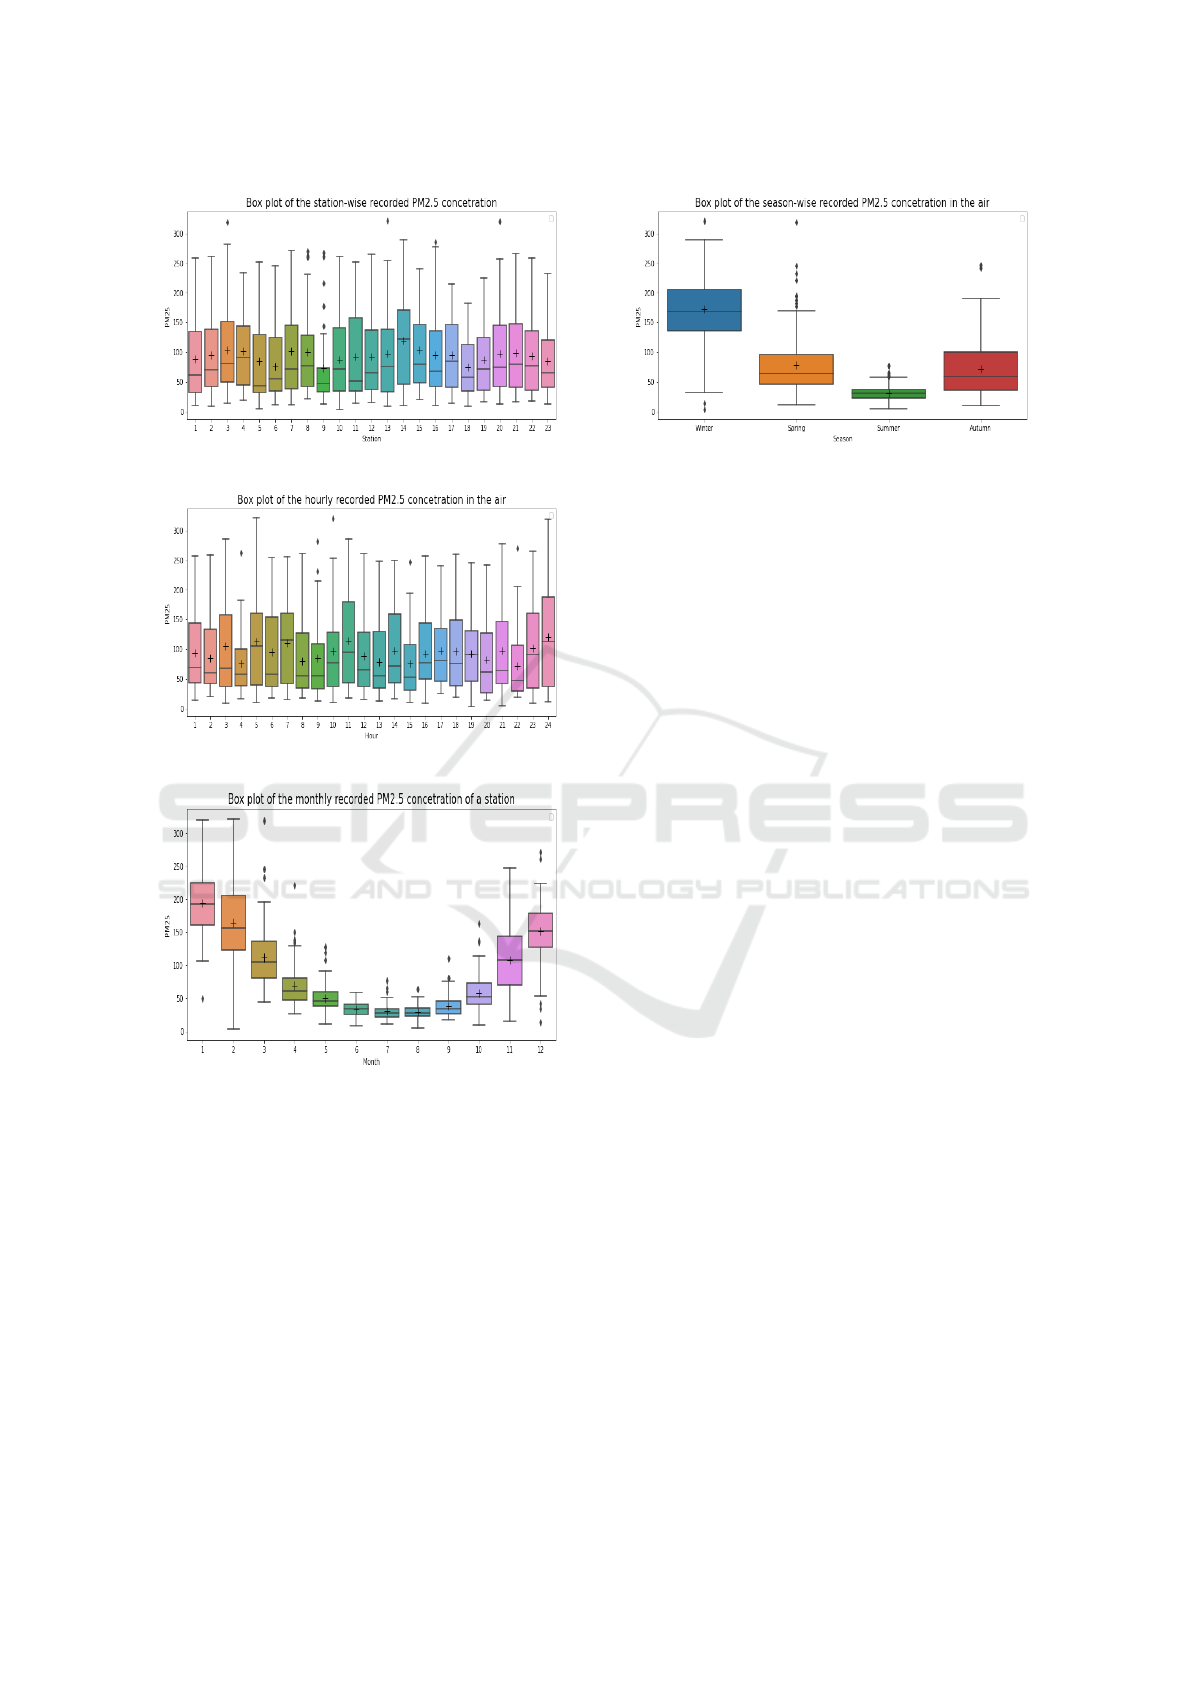
Figure 11: Box Plot of Station-Wise PM2.5 Data.
Figure 12: Box Plot of Hourly PM2.5 Data.
Figure 13: Box Plot of Monthly PM2.5 Data.
tumn seasons last within those months. The rest of the
months has less concentration of this pollutant due to
having the most amount of humidity and rain.
Figure 14 validates our point placed in Figure 13
where we justified how humidity and higher precip-
itation are responsible for less generation of PM2.5.
The lower wind speed and shallower boundary layer
height causes less substantial amount of PM2.5 as
stated in (Dhaka et al., 2020).
Figure 14: Box Plot of Season-Wise PM2.5 Data.
6 FUTURE WORK AND
CONCLUSION
Bangladesh is a developing country, and it requires a
massive amount of power, electricity, industrial usage
with an uprising amount of infrastructure and techno-
logical advancement in the process of the country’s
establishment. With modernization, pollution comes
in all kinds. Air pollution in Bangladesh is so high
that a system is needed to monitor and control it. Our
target is mostly to monitor the polluting areas like in-
dustrial zones, power plants and busy transportation
routes. We are not against industrialization and mod-
ernization; our goal is to keep air pollution within a
favourable amount.
The key concept highlighted in this research paper
is air quality monitoring and assurance. We have per-
formed an experiment for a year and our experimen-
tal results showed promising results. Therefore, we
believe our proposed data-driven air quality monitor-
ing software system (AQM) in this research work will
help to monitor and ensure air quality. The proposed
AQM system will monitor the air quality of different
divisions, industrial areas, and transportation routes
by showing atmospheric maps. We have presented
different types of atmospheric maps in this paper that
will be implemented in our proposed system.
We have collected air quality data for different ar-
eas of Bangladesh for one year period time from vari-
ous sources and later analyzed them. Our experimen-
tal results have been compared to IQAir AirVisual Pro
for different number of air quality indicators, includ-
ing temperature, humidity, PM1.0, PM2.5, PM10.0,
and CO
2
showed good results. Differences between
our obtained result and IQAir AirVisual Pro are very
low. In future, we will implement our proposed AQM
software system in full fledged based on our current
experiment. This AQM system will help to monitor
and ensure the air quality of Bangladesh as well as
Air Quality Monitoring of Bangladesh (AQM): Data Driven Analysis System
211

decision-makers to take effective initiatives for im-
proving and ensuring the air quality.
REFERENCES
Air Pollution (2021). Air pollution in dhaka, bangladesh.
Al-Ali, A., Zualkernan, I., and Aloul, F. (2010). A mobile
gprs-sensors array for air pollution monitoring. IEEE
Sensors Journal, 10(10):1666–1671.
AQI Bangladesh (2021). World air quality report of 2021.
AQI Dhaka (2021). Air quality index and pm2.5 air pollu-
tion in dhaka.
Arroyo, P., Herrero, J. L., Su
´
arez, J. I., and Lozano,
J. (2019). Wireless sensor network combined with
cloud computing for air quality monitoring. Sensors,
19(3):691.
Chen, M., Yang, J., Hu, L., Hossain, M. S., and Muham-
mad, G. (2018). Urban healthcare big data sys-
tem based on crowdsourced and cloud-based air qual-
ity indicators. IEEE Communications Magazine,
56(11):14–20.
Dhaka, S. K., Kumar, V., Panwar, V., Dimri, A., Singh, N.,
Patra, P. K., Matsumi, Y., Takigawa, M., Nakayama,
T., Yamaji, K., et al. (2020). Pm 2.5 diminution and
haze events over delhi during the covid-19 lockdown
period: an interplay between the baseline pollution
and meteorology. Scientific reports, 10(1):1–8.
Dhingra, S., Madda, R. B., Gandomi, A. H., Patan, R., and
Daneshmand, M. (2019). Internet of things mobile–
air pollution monitoring system (iot-mobair). IEEE
Internet of Things Journal, 6(3):5577–5584.
Gu, Q. and Jia, C. (2019). A consumer uav-based air
quality monitoring system for smart cities. In 2019
IEEE international conference on consumer electron-
ics (ICCE), pages 1–6. IEEE.
Holovatyy, A., Teslyuk, V., Lobur, M., Pobereyko, S., and
Sokolovsky, Y. (2018). Development of arduino-based
embedded system for detection of toxic gases in air.
In 2018 IEEE 13th International Scientific and Tech-
nical Conference on Computer Sciences and Informa-
tion Technologies (CSIT), volume 1, pages 139–142.
IEEE.
Kannaki, S., Priya, S., Mukhilan, J. S., Santhosh, M., Sud-
harsanan, E., Ganapathy, A. B., Abhinav, S., and
Tansin, M. (2020). Development of smart air qual-
ity monitoring & filtering system. Journal of Critical
Reviews, 7(9):367–370.
Karar, M. E., Al-Masaad, A., and Reyad, O. (2020).
Gasduino-wireless air quality monitoring sys-
tem using internet of things. arXiv preprint
arXiv:2005.04126.
Kiruthika, R. and Umamakeswari, A. (2017). Low cost pol-
lution control and air quality monitoring system us-
ing raspberry pi for internet of things. In 2017 In-
ternational Conference on Energy, Communication,
Data Analytics and Soft Computing (ICECDS), pages
2319–2326. IEEE.
Meli, M., Gatt, E., Casha, O., Grech, I., and Micallef, J.
(2020). A low cost lora-based iot big data capture and
analysis system for indoor air quality monitoring. In
2020 International Conference on Computational Sci-
ence and Computational Intelligence (CSCI), pages
376–381. IEEE.
Patil, K., Laad, M., Kamble, A., and Laad, S. (2019).
A consumer-based smart home with indoor air qual-
ity monitoring system. IETE Journal of Research,
65(6):758–770.
Purwanto, P., Suryono, S., and Sunarno, S. (2019). De-
sign of air quality monitoring system based on web
using wireless sensor network. In Journal of Physics:
Conference Series, volume 1295, page 012043. IOP
Publishing.
Suganya, E. and Vijayashaarathi, S. (2016). Smart vehi-
cle monitoring system for air pollution detection using
wsn. In 2016 International Conference on Communi-
cation and Signal Processing (ICCSP), pages 0719–
0722. IEEE.
Sung, Y., Lee, S., Kim, Y., and Park, H. (2019). Develop-
ment of a smart air quality monitoring system and its
operation. Asian Journal of Atmospheric Environment
(AJAE), 13(1).
Yang, Y. and Li, L. (2015). A smart sensor system
for air quality monitoring and massive data collec-
tion. In 2015 International Conference on Infor-
mation and Communication Technology Convergence
(ICTC), pages 147–152. IEEE.
Zaldei, A., Camilli, F., De Filippis, T., Di Gennaro, F.,
Di Lonardo, S., Dini, F., Gioli, B., Gualtieri, G.,
Matese, A., Nunziati, W., et al. (2017). An integrated
low-cost road traffic and air pollution monitoring plat-
form for next citizen observatories. Transportation re-
search procedia, 24:531–538.
ICSOFT 2022 - 17th International Conference on Software Technologies
212
