
Optimal Resource Allocation for Fast Epidemic Monitoring in
Networked Populations
Paolo Di Giamberardino
1 a
, Daniela Iacoviello
1 b
and Federico Papa
2
1
Dept. of Computer, Control and Management Engineering A.Ruberti, Sapienza University of Rome, Rome, Italy
2
IASI, CNR, Rome, Italy
Keywords:
Epidemic Modeling, Optimal Resource Allocation, Monitoring.
Abstract:
The COVID-19 pandemic highlighted the fragility of the world in addressing a global health threat. The avail-
able resources of the pre-pandemic national health systems were inadequate to cope with the huge number of
infected subjects needing health care and with the rapidity of the infection spread characterizing the COVID-19
outbreak. Indeed, an adequate allocation of the resources could produce in principle a strong reduction of the
infection spread and of the hospital burden, preventing the collapse of the health system. In this work, taking
inspiration from the COVID-19 and the difficulties in facing the emergency, an optimal problem of resource
allocation is formulated on the basis of an ODE multi-group model composed by a network of SEIR-like sub-
models. The multi-group structure allows to differentiate the epidemic response of different populations or of
various subgroups in the same population. In fact, an epidemic does not affect all populations in the same way,
and even within the same population there can be epidemiological differences, like the susceptibility to the
virus, the level of infectivity of the infectious subjects and the recovery from the disease. The subgroups are
selected within the total population based on some peculiar characteristics, like for instance age, work, social
condition, geographical position, etc., and they are connected by a network of contacts that allows the virus
circulation within and among the groups. The proposed optimal control problem aims at defining a suitable
monitoring campaign that is able to optimally allocate the number of swab tests between the subgroups of the
population in order to reduce the number of infected patients (especially the most fragile ones) so reducing the
epidemic impact on the health system. The proposed monitoring strategy can be applied both during the most
critical phases of the emergency and in endemic conditions, when an active surveillance could be crucial for
preventing the contagion rise.
1 INTRODUCTION
The COVID-19 pandemic has been modifying the
habits all over the world, inducing all the populations
to apply containment measures, such as social dis-
tancing, using masks, participating to swab test cam-
paigns, and getting the vaccination when it became
available. A huge amount of papers have been pub-
lished on this topic, focusing on the effects and the
effectiveness of such actions, see (Gatto et al., 2020),
(Di Giamberardino and Iacoviello, 2021), (Pung et al.,
2021), (Casares and Khan, 2020), (Espinoza et al.,
2020), (Liu et al., 2020), (Borri et al., 2021) only
as possible examples. In literature, different aspects
have been investigated, changing the focus of the
analysis as the pandemic conditions vary, ranging
a
https://orcid.org/0000-0002-9113-8608
b
https://orcid.org/0000-0003-3506-1455
from data analysis in the very first period of the emer-
gency, (Tang et al., 2020), (Wu et al., 2020), to mod-
eling and control during 2020 − 2021, (Ivorra et al.,
2020), (Wang et al., 2020), (Silva et al., 2021), (Di Gi-
amberardino et al., 2021b) up to ex-post analysis of
what happened, in order to understand the dynam-
ics of the infections and to avoid possible delays in
decision making in case of new sanitary emergen-
cies, (Assefa et al., 2022), (Marziano et al., 2021),
(Di Giamberardino et al., 2021a). The main COVID-
19 specificities are the high infection rate, the signifi-
cant percentage of asymptomatic subjects that can in-
fect, the different course of the illness in the various
categories, and not well identified reasons of sensi-
tivity with respect to the disease. The strong rela-
tionships among populations, and inside each popu-
lation, increase the probability of new infections and
therefore of the epidemic spread. The spread among
616
Di Giamberardino, P., Iacoviello, D. and Papa, F.
Optimal Resource Allocation for Fast Epidemic Monitoring in Networked Populations.
DOI: 10.5220/0011299300003271
In Proceedings of the 19th International Conference on Informatics in Control, Automation and Robotics (ICINCO 2022), pages 616-625
ISBN: 978-989-758-585-2; ISSN: 2184-2809
Copyright
c
2022 by SCITEPRESS – Science and Technology Publications, Lda. All rights reserved

populations is studied in (Di Giamberardino et al.,
2021) where the mobility aspects after the lockdown
of 2020 in Italy are analysed; in that case the entire
Italian population has been split into three geograph-
ical groups (referring to North, Center and South of
Italy) showing the influence of controlled re-opening,
after the lockdown, on the distribution of the infec-
tion. The connections among groups of populations
can be faced considering as “population” not only the
habitants of a region but also, for example, a cate-
gory of workers, or an age-category; therefore, it is
possible to study the interconnections among social
groups with different characteristics, analysing the ef-
fects, on the entire population, of control actions ap-
plied separately in one group, (Contreras et al., 2020),
(Di Giamberardino et al., 2021), (Ndairou et al.,
2020). At the very beginning of the current pan-
demic, the available resources were not sufficient for
the severity of the emergency and some choices had to
be taken. In absence of vaccination and ad hoc med-
ications, two main containment measures are, in gen-
eral, achievable: the social distancing (including the
use of masks) and the fast identification of infected
patients. This latter issue can be fulfilled by means
of an adequate monitoring campaign based on swab
tests, which were not easily available at the begin-
ning of the COVID-19 pandemic. Moreover, also in
the endemic condition, an active surveillance action
could consider a regular swab test campaign to con-
tain the number of infected patients, especially in the
most fragile part of the population. The main goal of
this paper is to propose a strategy for optimizing the
swab test campaign, considering also limitations from
logistic, economic and material points of view.
The paper is organized as follows. In Section 2,
the total population is divided into n groups and a
compartmental model describing the disease dynam-
ics in each group is proposed and analysed. An op-
timal allocation control is proposed, which aims at
yielding a strategy for defining a swab test campaign
in case of limited resources, both from economic and
technical point of view. In Section 3, the introduction
of the optimized strategy for fast epidemic monitor-
ing is studied, comparing its effects with the non con-
trolled case. Conclusion and future developments end
the paper.
2 MATERIALS AND METHODS
A population is here modeled as partitioned into n
groups; this could represent, for example, a classifica-
tion with respect to the age, or to the geographical po-
sition, or to the working categories, or any other char-
acteristics that imply different response to the virus.
In each group, 7 compartments representing differ-
ent patient conditions w.r.t. the disease evolution are
introduced. In particular, the severity of the disease
is explicitly taken into account by distinguishing be-
tween asymptomatic (A) and symptomatic isolated
infected (I), and hospitalized (H) individuals. This
choice depends on the COVID-19 specificity charac-
terized by an high percentage of asymptomatic pa-
tients that could infect other people and by the high
heterogeneity of the disease severity, going from the
absence of symptoms to the need of health assistance.
In the following, three subsections will be devel-
oped; in the first one the mathematical model is pro-
posed; then, the reproduction number is determined
analysing the system by means of the next generation
matrix approach. Finally, the control problem aim-
ing at the optimal resource allocation is introduced.
The optimal strategy addresses the fast identification
of asymptomatic patients to reduce, as soon as possi-
ble, new infections and hospitalizations.
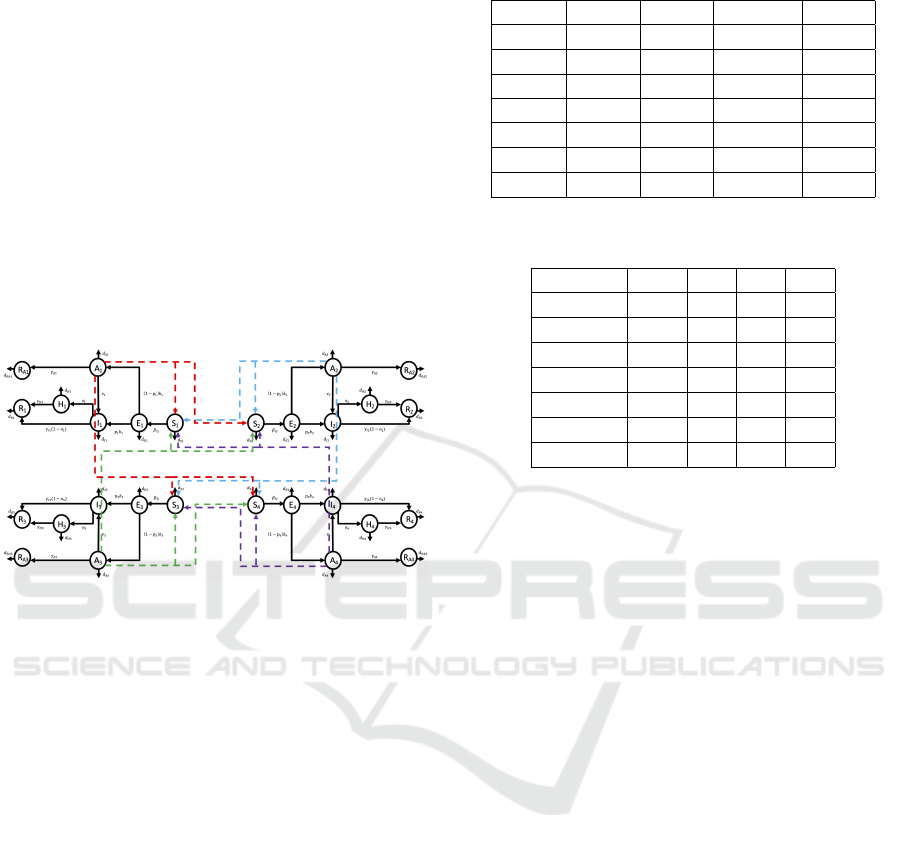
2.1 Mathematical Model
As previously said, each group is partitioned into 7
compartments as shown by Fig. 1. So, referring to
the h–th group, h = 1, . . . , n, the model accounts for
the following compartments:
• S
h
: susceptible subjects, that is the healthy peo-
ple within the population which are not vaccinated
yet;
• E
h
: exposed individuals, i.e. the subjects in the
incubation period; they are infected but cannot in-
fect;
• I
h
: infected isolated patients; this compartment
collects infected patients who are diagnosed as
COVID-19 positive (because of the presence of
recognizable symptoms or of a positive swab test).
As diagnosed patients, they are isolated and can-
not transmit the infection;
• H
h
: isolated hospitalized patients; it is assumed
that they are isolated in hospital, with serious
health conditions;
• A
h
: infected non isolated patients; they are sub-
jects unaware of their infection status, since they
show only light or no symptoms at all; therefore,
they can infect other people of the same or of dif-
ferent groups;
• R
h
: removed subjects, immunized because of the
healing from the infection; they are aware of their
previous infection status;
Optimal Resource Allocation for Fast Epidemic Monitoring in Networked Populations
617

• R
Ah
: removed subjects, immunized because of the
healing from the infection; they are unaware of
their previous infection status.
Note that the immunization assumed for compart-
ments R
h
and R
Ah
is actually a temporary condition
that could be reached after healing, and its presence
and duration substantially depend on the particular
virus strain that is dominant within the infected pop-
ulation. Since the majority of virus strains appeared
during the COVID-19 evolution have produced some
transitory protection from the reinfection, it is reason-
able to assume a sort of immunization in the problem
formulation, at least for a short period after the recov-
ery. Note also that the distinction among the healed
patients between those aware of their previous infec-
tion state (R
h
) and those unaware (R
Ah
), allows to ex-
clude the first class R
h
from the swab test campaign,
at least until few months after healing. The class of
people indicated by R
Ah
is not measurable, of course,
as the class of A
h
, but they could be approximately
inferred from some extrapolation based on the test re-
sults related to specific populations or to particular pe-
riods.
Figure 1: Block diagram of the proposed model for the h–th
group.
It is assumed that only the subjects in the class A
h
of each group h can infect the subjects S
j
of any group
j. Therefore, it is mandatory to recognize as soon as
possible the subjects in each class A
h
, h = 1, . . . , n, by
means of a suitable swab test campaign, taking into
account the operative limitations.
The unique subjects really sure of their health con-
ditions are the ones that have received a positive di-
agnosis of COVID-19 after a swab test and/or after
having developed the symptoms, i.e. the subjects in
the classes I
h
, H
h
and R
h
, whereas the remaining ones
in the classes S
h
, E
h
, A
h
and R
Ah
need to be tested.
After a test, the subjects in S
h
and R
Ah
don’t change
their class, whereas the subjects in E
h
and A
h
move to
I
h
; this justifies the weight coefficient
ρ
h
E
h
S
h
+E
h
+A
h
+R
Ah
of the control action term influencing the subjects in
E
h
and, correspondingly, the weight
τ
h
A
h
S
h
+E
h
+A
h
+R
Ah
re-
garding the evolution of A
h
.
The dynamic equations describing the epidemic
spread of each group h can be written as
˙
S
h
=N
h
− S
h
n
∑
k=1
β
hk
A
k
− d
Sh
S
h
(1)
˙
E
h
=S
h
n
∑
k=1
β
hk
A
k
− d
Eh
E
h
− k
h
E
h
−
ρ
h
E
h
S
h
+ E
h
+ A
h
+ R
Ah
u
h
(2)
˙
I
h
=−d
Ih
I
h
+ p
h
k
h
E
h
− γ
Ih
(1 − o
h
)I
h
+ ν
h
A
h
+
ρ
h
E
h
+ τ
h
A
h
S
h
+ E
h
+ A
h
+ R
Ah
u
h
− o
h
¯o
h
I
h
(3)
˙
A
h
=−d
Ah
A
h
+ (1 − p
h
)k
h
E
h
− γ
Ah
A
h
− ν
h
A
h
−
τ
h
A
h
S
h
+ E
h
+ A
h
+ R
Ah
u
h
(4)
˙
H
h
=−d
Hh
H
h
− γ
Hh
H
h
+ o
h
¯o
h
I
h
(5)
˙
R
h
=−d
Rh
R
h
+ γ
Ih
(1 − o
h
)I
h
+ γ
Hh
H
h
(6)
˙
R
Ah
=−d
RAh
R
Ah
+ γ
Ah
A
h
(7)
The parameters appearing as coefficients in (1)–
(7) have the following meanings:
• d
∗h
denotes the death rate in compartment ∗ of the
h −th group;
•
1
k
h
is the mean incubation time in E
h
;
• β
i j
represents the infection rate constant between
the healthy subjects S
i
and the infectious ones A
j
,
with i = 1, .., n, j = 1, ..., n;
•
1
ν
h
is the mean period of natural transition from A
h
to I
h
;
•
1
¯o
h
represents the mean period required for an in-
fected patient to be hospitalized, i.e. to transit in
H
h
; it is assumed that it is immediately evident
that the patient is in need of hospitalization; in the
following this value will be set equal to 1;
•
1
γ
A
h
,
1
γ
I
h
and
1
γ
H
h
represent the mean periods re-
quired for the healing of patients in the classes A
h
,
I
h
and, respectively, H
h
;
• ρ
h
and τ
h
are normalization coefficients related
with the reliability of the swab tests;
• p
h
∈ [0, 1] is the probability that a subject in E
h
becomes an infected patient in I
h
after developing
COVID-19 symptoms;
• o
h
∈ [0, 1] is the probability that a subject in I
h
re-
quires hospitalization because of health worsen-
ing;
ICINCO 2022 - 19th International Conference on Informatics in Control, Automation and Robotics
618

• N
h
represents the rate of new incomers.
The different n groups influence each other by
means of the infection rates depending on the pecu-
liarities of the population at hand. In the following,
the total model of the n groups is analysed, finding, in
particular, the expression of the reproduction number
R
0
.
2.2 Model Analysis
This model will be analysed considering the whole
population with the n groups connected; the state of
the h-th group is denoted by
X
h
=
S
h
E
h
I
h
A
h
H
h
R
h
R
Ah
T
(8)
Therefore, setting X as the 7n–dimensional column
vector
X =
X
1
X
2
.
.
.
X
n
and observing that the equations describing the trend
of each group depend on all the state variables of all
the groups (because of the infection mechanism sus-
tained by the asymptomatic subjects), the h–th dy-
namical system can be written as
˙
X
h
= Γ
h
(X) + Ω
h
(X
h
)u
h
(9)
with the obvious meaning of the notation, and the
global system can be described as
˙
X = Γ(X ) + Ω(X)U (10)
In (10)
Γ(X) =
Γ
1
(X)
.
.
.
Γ
n
(X)
(11)
is the 7n ×1 vector function representing the non con-
trolled part of the state equations, while Ω(X ) is the
7n × n matrix
Ω(X) =
Ω
1
(X
1
)··· 0
.
.
.
.
.
.
.
.
.
0 ···Ω
n
(X
n
)
(12)
multiplying the control vector
U =
u
1
u
2
... u
n
T
The disease free equilibrium point
P
e
=
P
e
1
P
e
2
.
.
.P
e
n
is easily obtained and it is given by
P
e
h
=
S
e
h
0 0 0 0 0 0
T
with S
e
h
=
N
h
d
S
h
.
A useful parameter that provides information on
the evolution of the pandemic, in the absence of con-
trol actions, is the reproduction number R
0
, that is
the mean number of secondary cases per unit time
that a unique infected subject produces in a totally
susceptible population. An estimation of R
0
can
be obtained by means of the next generation matrix
method, (Van Den Driessche and Watmough, 2002);
it requires the definition of the vector Z that collects
the variables of the global system describing the evo-
lution of the infected people (in all the phases) in the
whole population
Z =
Z
1
Z
2
.
.
.
Z
n
where
Z
h
=
E
h
I
h
A
h
H
h
T
The reduced dynamical system
˙
Z can be described by
distinguishing the terms that include new infections
(F ) from all other changes (V ) in the population
˙
Z = F − V
where
F =
F
1
F
2
.
.
.
F
n
V =
V
1
V
2
.
.
.
V
n
with
F
h
=
S
h
∑
n
k=1
β
hk
A
k
0
0
0
V
h
=
d
Eh
E
h
+ k
h
E
h
d
Ih
I
h
− p
h
k
h
E
h
+ γ
Ih
(1 − o
h
)I
h
− ν
h
A
h
d
Ah
A
h
− (1 − p
h
)k
h
E
h
+ ν
h
A
h
+ γ
Ah
A
h
d
Hh
H
h
+ γ
Hh
H
h
− o
h
I
h
Starting from F and V , new matrices, say F and V ,
are defined as follows
F =
∂F
∂Z
P
e
=
F
1,1
···F
1,n
.
.
.
.
.
.
.
.
.
F
n,1
···F
n,n
(13)
Optimal Resource Allocation for Fast Epidemic Monitoring in Networked Populations
619

where
F
h, j
=
∂F
h
∂Z
j
P
e
=
0 0 S
e
h
β
h j
0
0 0 0 0
0 0 0 0
0 0 0 0
(14)
and
V =
∂V
∂Z
P
e
(15)
The matrix V , of dimension 4n×4n, is block diagonal
with the non null blocks equal to
V
j j
=
d
Eh
+k
h
0 0 0
−p
h
k
h
d
Ih
+γ
Ih
(1−o
h
) −ν
h
0
−(1−p
h
)k
h
0 d
Ah
+γ
A
h
+ν
h
0
0 −o
h
0 d
Hh
+γ
Hh
The reproduction number R
0
is defined as the dom-
inant eigenvalue of the next generation matrix FV
−1
.
Due to the diagonal block structure of the next gen-
eration matrix, the reproduction number R
0
is the
maximum of the set {R
0h
}, h = 1, ..., n, where R
h
is the reproduction number of group h and it is given
by
R
0h
=
S
e
h
β
hh
(1 − p
h
)k
h
(d
Eh
+ k
h
)(d
Ah
+ γ
Ah
+ ν
h
)
(16)
This implies that, if we consider the entire popula-
tion constituted by the n interacting groups, the total
reproduction number R
0
is less than 1, thus leading
to the reduction of the pandemic, if and only if the
reproduction number of each group R
0h
, h = 1, ..., n,
is smaller than 1. Note that each R
0h
, h = 1, ..., n,
increases with β
hh
and with (1 − p
h
); this is due to
the fact that the unique population that could infect is
constituted by the asymptomatic subjects in A
h
, that,
in fact, increase as (1 − p
h
) does.
2.3 Optimal Control
In a pandemic scenario characterized by a severe lim-
itation on the swab test availability, like for instance
in the first phase of the epidemic outbreak or during
a prolonged surveillance strategy, it is mandatory to
optimally allocate the available resources to decrease
the total number of infected patients (infected, asymp-
tomatic, hospitalized). The following cost index is
proposed
J(U)=
Z
t
f
t
i
L(X,U)dt
=
1
2
Z
t
f
t
i
n
∑
k=1
[α
A
k
A
2
k
+ α
I
k
I
2
k
+ α
H
k
H
2
k
+ µ
k
u
2
k
]dt
with the constraints
u
k
∈ [u
m
k
, u
M
k
], u
m
k
< u
M
k
, k = 1, . . . , n
The weights α
A
k
, α
I
k
, α
H
k
are chosen between 0 and 1
depending on the relative importance of the various
terms. The use of the Pontryagin principle requires
the introduction of the 7n-dimension costate vector,
Λ = (λ
1
... λ
7n
)
T
, satisfying the costate vectorial
equation
˙
Λ = −
∂H
∂X
T
(17)
being H the Hamiltonian of the process
H (X,U) = L(X,U) + Λ
T
[Γ(X) + Ω(X)U] (18)
According to the Pontryagin inequality, the opti-
mal control action u
o
h
of group h satisfies the condi-
tion:
1
2
µ
h
u
o2
h
+
4
∑
j=2
λ
7(h−1)+ j
Ω
7(h−1)+ j,h
u
o
h
≤
1
2
µ
h
w
2
h
+
4
∑
j=2
λ
7(h−1)+ j
Ω
7(h−1)+ j,h
w
h
(19)
for any admissible control w
h
∈ [u
m
h
, u
M
h
]. The quantity
Ω
l,m
denotes the the row l and the column m of the
matrix Ω defined in (12).
Therefore, the n optimal control actions are equal
to
u
o
h
(t) = Φ
h
(t), h = 1, . . . , n, (20)
where
Φ
h
(t) =
−
∑
4
j=2
λ
7(h−1)+ j
Ω
7(h−1)+ j,h
µ
h
= −
1
µ
h
−λ
7(h−1)+2
ρ
h
E
h
S
h
+ E
h
+ A
h
+ R
Ah
+λ
7(h−1)+3
ρ
h
E
h
+ τ
h
A
h
S
h
+ E
h
+ A
h
+ R
Ah
− λ
7(h−1)+4
τ
h
A
h
S
h
+ E
h
+ A
h
+ R
Ah
(21)
whenever Φ
h
(t) is in [u
m
h
, u
M
h
]. Otherwise, if Φ
h
(t) ≥
u
M
h
or Φ
h
(t) ≤ u
m
h
the optimal control is given by u
M
h
or, respectively, u
m
i
.
Note that, as usual, the switching functions Φ
h
(t)
depend on the costate evolution, given by Eq. (17)
solved backward starting from the final condition
Λ(t
f
) = 0.
ICINCO 2022 - 19th International Conference on Informatics in Control, Automation and Robotics
620
3 NUMERICAL RESULTS
In this section it is analysed the epidemic trend of
a simulated population in which, for its peculiari-
ties, four different groups can be identified; these
groups may be differentiated based on their weak-
ness and susceptibility with respect to the virus in-
fection and on different healing capability. It may
correspond to age-class subdivision or activity-related
differences; the four groups, referred for simplicity
as G
i
, i = 1, 2, 3, 4, are defined by the initial condi-
tions given in Table 1 and by the model parameters
given in Tables 2, 3. Each control u
h
is limited by the
box constraint [0.05,0.99]. Fig.2 shows the network
regarding the infection spread within the population
with the 4 selected groups. The scenario described in
Figure 2: Virus spread in a network of 4 connected groups.
this paper assumes that group G
1
has a higher infec-
tion capability with respect to the others; this means
that the contact rates β
i1
for i = 1, ..., 4 are higher with
respect to the other values of the matrix β collecting
the contact rates β
i j
, i, j = 1, ..., 4
β = 10
−7
9.5 7 5 2
9.4 8 7 4
9.4 5 8 7
9.8 5 7 8
(22)
Among the groups G
i
, i = 1, ..., 4, it is assumed a de-
creasing capability of healing from the infection, as
well as an increasing probability of hospitalization
after the infection, as i increases (see Tables 2, 3).
The described situation could correspond to a possi-
ble splitting of the population into 4 groups depending
on age; therefore, as the age increases the subjects of
each group become more susceptible to the infection,
weaker and with increased probability of hospitaliza-
tion. The rate of new incomers in each S
h
is estimated
as S
h
(0)·d
Sh
·100, that is 100 times the corresponding
death rate.
The choice of the weights in the cost index de-
pends on the specific goal to be pursued. In the
considered scenario, the aim is to minimize the in-
fected subjects allocating optimally the available re-
Table 1: Initial conditions.
G
1
G
2
G
3
G
4
S
i
(0) 10
6
3 · 10
6
4.5 · 10
6
10
6
E
i
(0) 10
2
4 · 10
2
3 · 10
3
2 · 10
2
I
i
(0) 50 10 20 4
A
i
(0) 10
2
3 5 10
H
i
(0) 10 10 10 5 · 10
2
R
i
(0) 10
2
4 · 10
3
10
3
2 · 10
2
R
Ai
(0) 5 · 10
2
10
2
8 · 10
2
10
2
Table 2: Death rated parameters for each group i = 1..., 4;
note that the values in the table must be multiplied by 10
−5
.
G
1
G
2
G
3
G
4
d
Si
· 10
5
1 1.5 1.5 2
d
Ei
· 10
5
1 1.5 1.5 2.3
d
Ii
· 10
5
1.1 1.7 1.8 3
d
Ai
· 10
5
1.02 1.5 1.6 3.4
d
Hi
· 10
5
1.2 1.8 1.8 4
d
Ri
· 10
5
1 1.5 1.5 1.5
d
RAi
· 10
5
1 1.5 1.5 2
sources, that is defining the optimal planning of the
swab test campaign, which is very useful in case of
resource limitation, especially at the beginning of a
sanitary emergency but also for a prolonged surveil-
lance, during and after the pandemic and endemic pe-
riod. As said, group G
1
includes subjects with higher
infectious capability and lower probability of showing
symptoms; therefore, a possible goal is to decrease
the number of patients in A
1
; at the same time, it is
mandatory to avoid the infection and hospitalization
of the weak subjects. With this framework in mind,
the values in Table 4 are proposed.
As far as the control weights, without specific rea-
sons for privileging the action over one category, it
was decided to weigh the controls u
h
, h = 1, ...4 in
the same way, assuming µ
k
= 0.5 · 10
5
for k = 1, ..., 4.
Note the different order of magnitude of the weights
of the state variables and of the controls; this is due to
make these quantities comparable and effective in the
cost index. The simulations are obtained over a period
of 60 days, with a sampling time of 0.5. With the cho-
sen parameters, it can be noted the suggested strategy,
Fig. 3; by using the maximum allowed effort for the
swab test campaign in G
1
for about 93% of the control
period, it is possible to apply the control on groups
G
2
, G
3
and G
4
for about 80%, 70% and, respectively,
65% of the control period. These choices produce a
reduced increase in the trends of asymptomatic, in-
fected and hospitalized patients, as shown in Figs.4, 5,
6. It can be noted, especially for the subjects in G
2
and G
3
, an increase in the number of asymptomatic
subjects after the end of the swab test campaign, but a
Optimal Resource Allocation for Fast Epidemic Monitoring in Networked Populations
621

Table 3: Model parameters for each group i = 1..., 4.
G
1
G
2
G
3
G
4
k
i
1
6
1
6
1
6
1
6
ρ
i
10
6
10
6
10
6
10
6
p
i
0.1 0.5 0.7 0.85
ν
i
1
5
1
4
1
3
1
2
τ
i
10
4
10
4
10
4
10
4
o
i
0.1 0.4 0.6 0.8
γ
A
i
1
7
1
8
1
9
1
14
γ
H
i
1
7
1
8
1
9
1
14
γ
I
i
1
7
1
8
1
9
1
14
Table 4: Choice of the weights in the cost index.
G
1
G
2
G
3
G
4
α
A
k
0.99 0.08 0.02 0.008
α
I
k
0.04 0.05 0.08 0.1
α
H
k
0.4 0.5 0.7 0.99
general decrease, or at least not increasing trend, for
the infected patients in all the groups. To check the
effects of the application of the optimal controls u
o
i
,
i = 1, ..., 4 to the overall infectious situation, in Fig.
7 the total number of infected and infectious subjects
(that is all the infected, asymptomatic and hospital-
ized patients) is shown, both with the application of
the obtained optimal control (continuous line) and in
free evolution (dashed line). It can be noted that the
controlled spread is delayed with respect to the free
evolution; this is a positive consequence, since it al-
lows a simpler managing of the sanitary emergency.
Moreover, it can be evaluated the total number of dead
subjects in the population, both with and without the
application of the proposed surveillance control strat-
egy; the total number of deaths is equal to 8.85 × 10
4
without the determined control, whereas is 1.94 × 10
4
with the determined action that actually produces a
decrease of more than 78%. These results show the
strong sanitary impact of a suitably planned test cam-
Figure 3: Optimal control strategy.
Figure 4: Trend of the asymptomatic subjects in the 4
groups.
Figure 5: Trend of the infected subjects in the 4 groups.
paign. Finally, it is interesting to study the influence
of the total number of asymptomatic subjects on the
infected isolated and hospitalized patients. It can be
noted from the state trajectory of Fig. 8 that, in the ab-
sence of an optimal swab test campaign, the number
of infected patients (isolated and hospitalized) keeps
Figure 6: Trend of the hospitalized subjects in the 4 groups.
ICINCO 2022 - 19th International Conference on Informatics in Control, Automation and Robotics
622
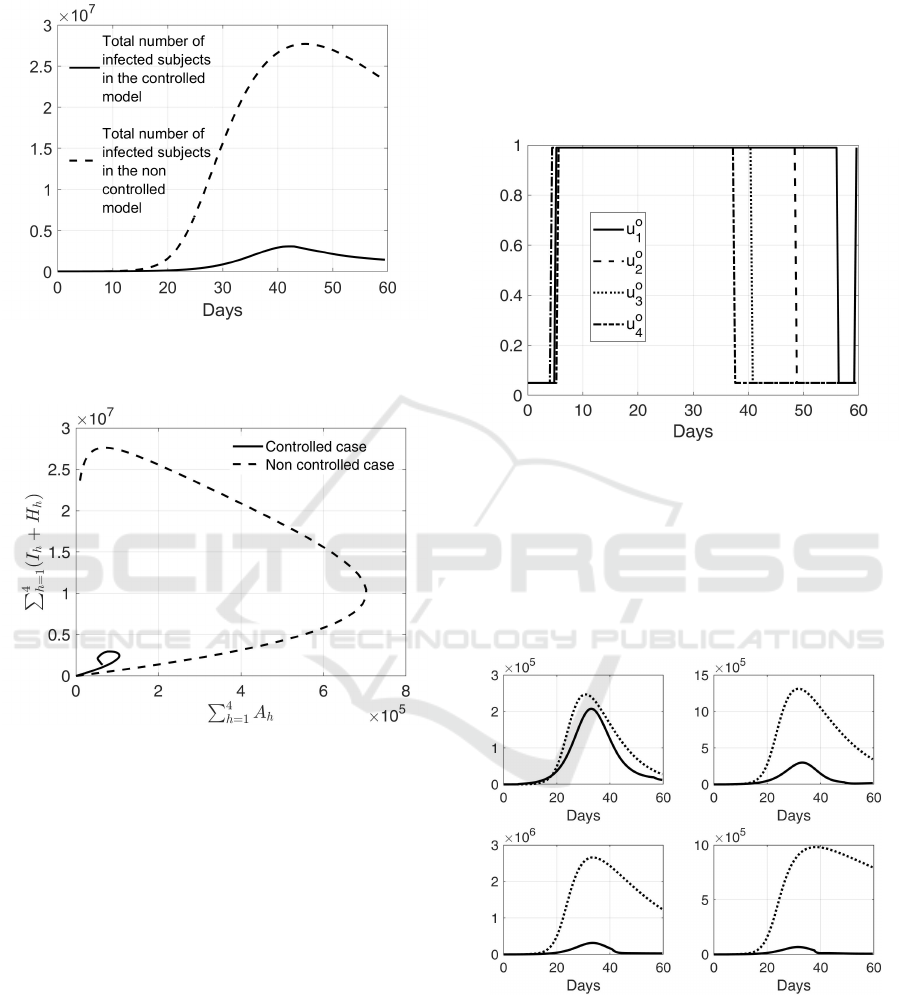
on increasing even when the number of asymptomatic
individuals has started decreasing.
Figure 7: Comparison between the trend of total number of
infected patients in the controlled and non controlled con-
ditions.
Figure 8: Asymptomatic subjects in the population (that is
∑
4
h=1
A
h
) versus the sum of infected and hospitalized pa-
tients (that is
∑
4
h=1
(I
h
+ H
h
)); in continuous line the con-
trolled case, in dashed line the non controlled one.
To stress the potentialities of the approach, it is
proposed a second case in which the subjects in G
1
are both more infectious and more susceptible to the
infection than the other groups,preserving their gen-
eral good health, as well as the weak probability of
having severe complications. The matrix β represent-
ing the new assumption on G
1
is given by
β = 10
−7
9.5 9 9 9
9.4 8 7 4
9.4 5 8 7
9.8 5 7 8
. (23)
In Fig. 9 it is shown the optimal control strategy for
the swab test campaign; all the actions start at their
maximal rate but only few days after the beginning of
the control period, that is after about 5 days, and they
maintain the maximum value for different periods: u
o
1
up to day 55, u
o
2
up to day 48, u
o
3
up to day 40, and
u
o
4
up to day 37. Using this control strategy that op-
timizes the swab test campaign, the total number of
dead people is reduced more than 79% w.r.t. the un-
controlled case, i.e. from 1.2 · 10
5
, in the absence of
any control, to 2.4 · 10
4
, with the application of the
optimal strategy.
Figure 9: Optimal control strategy for the scenario de-
scribed by the contact rate matrix (23).
In Fig. 10 it is shown a comparison of the num-
ber of infected in the four groups, with and without
the application of the swab test campaign; it is evi-
dent the strong reduction of the infected patients, es-
pecially for the subjects in groups G
2
, G
3
and G
4
.
Similar trends can be observed in Fig. 11 that shows
Figure 10: Comparison between I
o
i
, i = 1, ..., 4 (Continuous
line) and I
i
(dotted line) with the contact rate matrix (23);
first row, from left to right: infected patients in G
1
, G
2
;
second row, from left to right: infected patients in G
3
, G
4
.
the comparison between the hospitalized patients with
and without the control. The improvements are
due to the resource allocation obtained by the optimal
swab test campaign that strongly reduces the number
Optimal Resource Allocation for Fast Epidemic Monitoring in Networked Populations
623
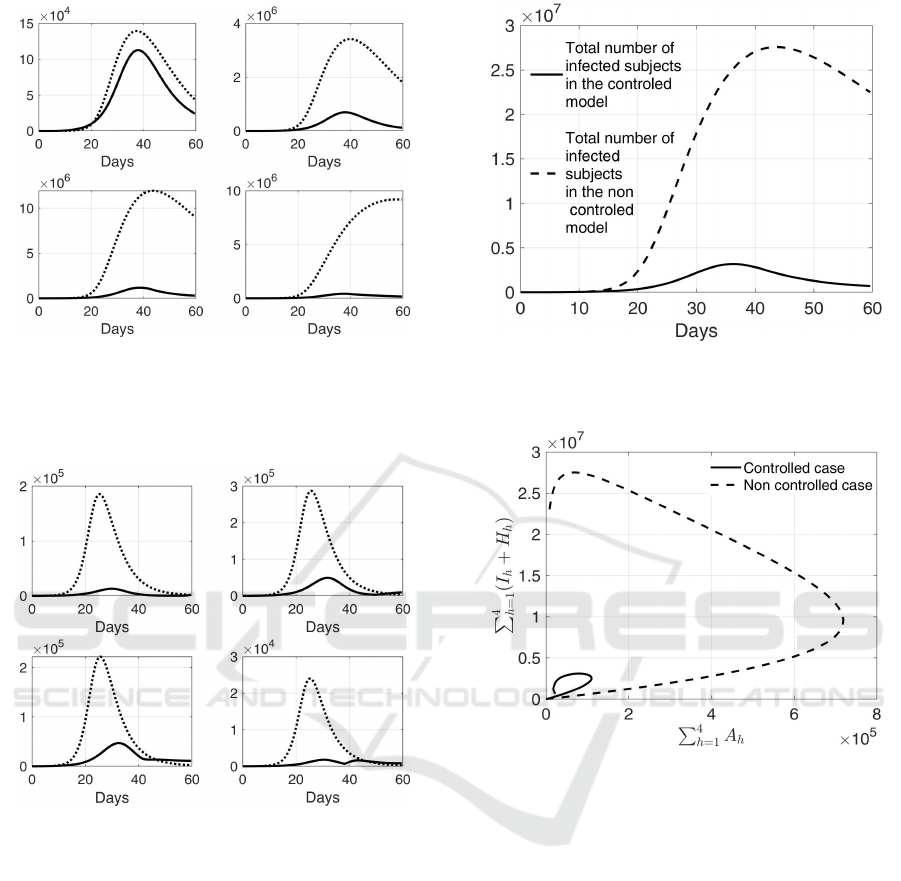
Figure 11: Comparison between H
o
i
, i = 1, ..., 4 (Continu-
ous line) and H
i
(dotted line) with the contact rate matrix
(23); first row, from left to right: hospitalized patients in
G
1
, G
2
; second row, from left to right: hospitalized patients
in G
3
, G
4
.
Figure 12: Comparison between A
o
i
, i = 1, ..., 4 (Continuous
line) and A
i
(dotted line) with the contact rate matrix (23);
first row, from left to right: asymptomatic subjects in G
1
,
G
2
; second row, from left to right: asymptomatic subjects
in G
3
, G
4
.
of asymptomatic subjects, see Fig.12. The results of
Figs. 10, 11, 12 can be summarized in Fig. 13 where
it is shown the trend of the infected and infectious
individuals both in the controlled and non controlled
case; note that there is one order of magnitude of dif-
ference in the peaks of the two curves (3.1·10
6
versus
2.7 · 10
7
patients). The effect of an effective swab test
campaign on the number of asymptomatic individu-
als, and therefore on the infected isolated patients and
on the hospitalized ones, is also highlighted by the
state trajectory reported in Fig. 14; note that in the
controlled case (continuous line), both asymptomatic
subjects and infected patients initially increase but,
after a while, they both decrease. Conversely, with-
Figure 13: Comparison between the trend of total number of
infected patients in the controlled and non controlled con-
ditions in the second case-study.
Figure 14: Asymptomatic subjects in the population (that
is
∑
4
h=1
A
h
) versus the sum of the infected and hospitalized
patients (that is
∑
4
h=1
(I
h
+H
h
)) in the second case-study; in
continuous line the controlled case, in dashed line the non
controlled one.
out any action (dashed line), the number of infected
isolated and hospitalized patients remains high even
when the number of asymptomatic subjects is actu-
ally decreasing.
4 CONCLUSIONS
The management of a pandemic, such as that due to
Sars-COV 2, must consider various aspects, as the al-
location of limited resources from different points of
view. The endemic phase also requires attention and
active surveillance. In this work, referring to COVID-
19, we propose a methodology for the definition of a
protocol for the management of swab tests in a pop-
ulation in which different groups can be identified
ICINCO 2022 - 19th International Conference on Informatics in Control, Automation and Robotics
624

based on some characteristics (age, work, social con-
dition, etc.). These groups are connected by a network
of contacts; their different susceptibility to the virus,
infectious capacity and speed of healing suggest an
optimal strategy for a swab test campaign. The anal-
ysis, supported by the numerical results, suggests a
control strategy that particularly focuses on the most
infectious individuals, allowing less surveillance on
the most fragile subjects. In future work different net-
work population characteristics could be included.
REFERENCES
Assefa, Y., Gilks, C. F., Reid, S., van de Pas, R., Gete,
D. G., and Van Damme, W. (2022). Analysis of the
COVID-19 pandemic: lessons towards a more efective
response to public health emergencies. Globalization
and Health, 18.
Borri, A., Palumbo, P., Papa, F., and Possieri, C. (2021).
Optimal design of lock-down and reopening policies
for early-stage epidemics through SIR-D models. An-
nual Reviews in control, 51:511–524.
Casares, M. and Khan, H. (2020). The timing and intensity
of social distancing to flatten the COVID-19 curve:
The case of Spain. Int J of Env Res and Pub He,
1(7283):1–14.
Contreras, S., Villavicencio, H. A., Medina-Ortiz, D.,
Biron-Lattes, J. P., and Olivera-Nappa, A. (2020). A
multi-group SEIRA model for the spread of COVID-
19 among heterogeneous populations. Chaos Solitons
Fractals, 136:109925.
Di Giamberardino, P., Iacoviello, D., Papa, F., and Sinis-
galli, C. (2021). A data-driven model of the covid-19
spread among interconnected populations: epidemio-
logical and mobility aspects following the lockdown
in italy. Nonlinear dynamics, 106(2):1239–1266.
Di Giamberardino, P., Caldarella, R., and Iacoviello, D.
(2021a). A control based mathematical model for
the evaluation of intervention lines in COVID-19
epidemic spread: The italian case study. Symmetry,
13(5):1–21.
Di Giamberardino, P. and Iacoviello, D. (2021). Evaluation
of the effect of different policies in the containment
of epidemic spreads for the COVID-19 case. Biomed
Signal Process Control, 65(102325):1–15.
Di Giamberardino, P., Iacoviello, D., Papa, F., and Sinis-
galli, C. (2021b). Dynamical evolution of COVID-
19 in Italy with an evaluation of the size of the
asymptomatic infective population. IEEE Journal
of Biomedical and Health Informatics, 25(4):1326–
1332.
Espinoza, B., Castillo-Chavez, C., and Perrings, C. (2020).
Mobility restrictions for the control of epidemics:
When do they work? PLoS One, 15(7):e0235731.
Gatto, M., Bertuzzo, E., Mari, L., Miccoli, S., Carraro,
L., Casagrandi, R., and Rinaldo, A. (2020). Spread
and dynamics of the COVID-19 epidemic in Italy:
Effects of emergency containment measures. PNAS,
117:10484–91.
Ivorra, B., Ferrandez, M. R., Vela-Perez, M., and Ramos,
A. M. (2020). Mathematical modeling of the spread of
the coronavirus diseas 2019 (COVID-19) taking into
account the undetected infections. The case of China.
Communcations in Nonlinear Science and Numerical
Simulations, 88.
Liu, M., Thomadsen, R., and Yao, S. (2020). Forecast-
ing the spread of COVID-19 under different reopening
strategies. Sci Rep., 10(1):20367.
Marziano, V., Guzzetta, G., Rondinone, B., Boccuni, F.,
Riccardo, F., Bella, A., Poletti, P., Trentini, F., Pez-
zotti, P., Brusaferro, S., Rezza, G., Iavicoli, S., Ajelli,
M., and Merler, S. (2021). Retrospective analysis of
the italian exit strategy from COVID-19 lockdown.
PNAS, 118:e2019617118.
Ndairou, F., Area, I., Nieto, J., and Torres, D. (2020). Math-
ematical modeling of covid-19 transmission dynamics
with a case study of wuhan. 135:1–6.
Pung, R., Cook, A., Chiew, C., Clapham, H. E., Sun, Y., Li,
Z., Dickens, B., Ma, S., Mak, K., Tan, C., Heng, D.,
Chen, M., and Lee, V. (2021). Effectiveness of Con-
tainment Measures Against COVID-19 in Singapore:
Implications for Other National Containment Efforts.
Epidemiology, 32(1):79–86.
Silva, C. J., Cruz, C., Torres, D. F. M., Munuzuri, A. P.,
Carballosa, A., Area, I., Nieto, J. J., Pinto, R. F., Pas-
sadouro, R., dos Santos, E., Abreu, W., and Mira, J.
(2021). Optimal control of the covid-19 pandemic:
controlled sanitary deconfinement in portugal. Scien-
tific Reports, 11(3451):1–15.
Tang, B., Wang, X., Li, Q., Bragazzi, N. L., Tang, S., Xiao,
Y., and Wu, J. (2020). Estimation of the transmission
risk of the 2019-nCoV and its implication for public
health interventions. J Clin Med, 9:462.
Van Den Driessche, P. and Watmough, J. (2002). Repro-
duction numbers and sub–threshold endemic equilib-
ria for compartmental models of disease transmission.
Mathematical Biosciences, 180:29–48.
Wang, B., Xu, S., and Mansouri, M. (2020). Modeling the
emergence of COVID-19: a system approach. In IEEE
15th International Conference of System of Systems
Engineering.
Wu, J. T., Leung, K., and Leung, G. M. (2020). Now-
casting and forecasting the potential domestic and in-
ternational spread of the 2019-nCoV outbreak origi-
nating in Wuhan, China: a modelling study. Lancet,
395:689–697.
Optimal Resource Allocation for Fast Epidemic Monitoring in Networked Populations
625
