
Students or Mechanical Turk: Who Are the More Reliable Social Media
Data Labelers?
Lisa Singh, Rebecca Vanarsdall, Yanchen Wang and Carole Roan Gresenz
Georgetown University, Washington DC, U.S.A.
Keywords:
Data Labeling, Reliability, Mechanical Turk, Social Media.
Abstract:
For social media related machine learning tasks, having reliable data labelers is important. However, it is
unclear whether students or Mechanical Turk workers would be better data labelers on these noisy, short posts.
This paper compares the reliability of students and Mechanical Turk workers for a series of social media data
labeling tasks. In general, we find that for most tasks, the Mechanical Turk workers have stronger agreement
than the student workers. When we group labeling tasks based on difficulty, we find more consistency for
Mechanical Turk workers across labeling tasks than student workers. Both these findings suggest that using
Mechanical Turk workers for labeling social media posts leads to more reliable labeling than college students.
1 INTRODUCTION
Over the last decade, crowdsourcing platforms have
been used to find people (crowds) to complete small
tasks for small amounts of money. Amazon Mechani-
cal Turk is a popular crowdsourcing platform used by
researchers and businesses to quickly collect survey
data from a large number of users.
1
Its large work-
force and user-friendly platform make it a competitive
alternative to more traditional survey sampling alter-
natives. Mechanical Turk is also used for data label-
ing tasks. In this context, Mechanical Turk workers
are asked to identify objects in images, confirm state-
ments in text, or interpret/contextualize data. This
type of evaluation can be a single question or a series
of questions. Once a reasonable amount of data is la-
beled, the labeled data can be used by researchers to
build different machine learning models. It is this sec-
ond context, a data labeling workforce, that we con-
sider in this paper.
Previous work has investigated the reliability of
Mechanical Turk workers for more traditional self-
reported survey responses (Hamby and Taylor, 2016;
Rouse, 2015), intelligence tests (Buchheit et al.,
2019), data labeling (Schnoebelen and Kuperman,
2010). The results suggest that Mechanical Turk
workers are not reliable survey respondents when sur-
veys ask personal questions or complex intelligence
questions that require domain knowledge, but are
1
https://www.mturk.com/
more reliable when the survey questions ask for more
objective judgements about data that are presented in
the survey. While these are all important findings,
none of these works investigate labeling reliability in
the context of social media data.
This research attempt to fill the gap. We con-
duct a comparative analysis between the reliability of
two different convenience sampling subpopulations:
college students and Mechanical Turk workers. We
focus on small micro-tasks where data labelers an-
swer questions of varying levels of difficulty about
anonymized Twitter posts. The design of this task
is similar to other Human Intelligence Tasks (HITs)
such as image tagging or emotion labeling. We find
that across most social media data labeling tasks, the
Mechanical Turk workers have stronger agreement
than the student workers. This result remains when
we group labeling tasks based on difficulty.
The remainder of the paper is organized as fol-
lows. Section 2 reviews related literature. Section 3
presents our methodology. This is followed by our ex-
perimental setup in Section 4. The results are shown
in Section 5, followed by conclusions and future di-
rections are presented in Section 6.
2 RELATED LITERATURE
Researchers have evaluated Mechanical Turk workers
across different dimensions, including self-reported
408
Singh, L., Vanarsdall, R., Wang, Y. and Gresenz, C.
Students or Mechanical Turk: Who Are the More Reliable Social Media Data Labelers?.
DOI: 10.5220/0011278600003269
In Proceedings of the 11th International Conference on Data Science, Technology and Applications (DATA 2022), pages 408-415
ISBN: 978-989-758-583-8; ISSN: 2184-285X
Copyright
c
2022 by SCITEPRESS – Science and Technology Publications, Lda. All rights reserved

response accuracy, intelligence testing, and data la-
beling tasks. In this section, we review literature
across these different dimensions, but focus on rele-
vant data labeling studies.
Across multiple studies that collected self-
reported behavioral data, when Mechanical Turk
workers were compared to other populations, Me-
chanical Turk workers had a lower reliability in most
cases (Hamby and Taylor, 2016; Rouse, 2015), and
higher reliability for behavioral responses when it
was integrated with attention checks (Goodman et al.,
2013). In general, when checking for attentiveness
through additional survey questions, Mechanical Turk
workers tended to be more attentive (Adams et al.,
2020; Hauser and Schwarz, 2016).
To better understand population differences across
multiple dimensions, Weigold and colleagues com-
pared a traditional convenience sample (college stu-
dents) to different Mechanical Turk samples (a gen-
eral Mechanical Turk worker and college students on
Mechanical Turk)(Weigold and Weigold, 2021). They
found that the most significant differences were their
demographic characteristics, task completion time,
and task attention to detail. Mechanical Turk workers
completed tasks more quickly than college students,
but did not sacrifice detail. The authors suggested
that researchers should use Mechanical Turk college
students for data collection because they are more di-
verse and more reliable.
Kees and colleagues compare labeling reliability
of Professional Panels, Student Subject Pools, and
Mechanical Turk workers for a survey about academic
advertising of research studies (Kees et al., 2017). La-
belers were exposed to an advertisement involving a
health-related goal and completed a survey of mostly
scale questions measuring their attitude towards the
advertisements. Again, attention checks were in-
cluded and Mechanical Turk workers performed as
well or better than the other groups in terms of at-
tention and multi-tasking measures.
Researchers have also compared different crowd-
sourced worker responses to intelligence questions.
For example, Buchheit and colleagues compared stu-
dent and Mechanical Turk workers for different ac-
counting intelligence questions, e.g. profit prediction,
risk assessment, and fluid intelligence assessments
(Buchheit et al., 2019). They found that graduate stu-
dents outperformed both undergraduate and Mechani-
cal Turk workers on common accounting related intel-
ligence questions. However, on two reasonably com-
plex tasks that did not require as much accounting
knowledge, they found that Mechanical Turk work-
ers performed similarly to undergraduate accounting
students, indicating that Mechanical Turk workers are
a reasonable option when accounting expertise is not
explicitly required.
A number of studies investigate the reliability of
using Mechanical Turk for data labeling tasks. Zhou
and colleagues compare label agreement between stu-
dents for academic credit, Mechanical Turk workers,
and Master Mechanical Turk workers (Zhou et al.,
2018). The task was to place bounding boxes around
tassels. The results indicated that Mechanical Turk
workers had significantly better labeling reliability
than the for-credit students.
For summarization tasks, Mechanical Turk work-
ers produced considerably noisier, less reliable output
than expert labelers when rating the quality of a piece
of text. In other words, when expert knowledge is
necessary, the Mechanical Turk workers have much
more variability in their responses (Gillick and Liu,
2010). This finding is similar to those related to in-
telligence questions. Finally, Mechanical Turk work-
ers were also compared to citizen scientists (volunteer
scientists) (Van Horn et al., 2015). The task involved
labeling birds (bird recognition). In this study, citizen
scientists provided significantly higher quality labels
than Mechanical Turk workers, especially when an-
notating finer grain details.
This prior literature suggests that when domain or
other specialized expertise is not required, Mechan-
ical Turk workers are fairly reliable, but if the task
requires substantial background knowledge, students
will tend to perform better. While this is an impor-
tant finding, it does not provide insight into labeling
of social media data.
3 METHODOLOGY
Understanding social media posts can be difficult
given their short length, the abbreviations used, and
the informal language. Some labeling tasks that
require less interpretation may be straightforward,
while those that attempt to summarize or judge con-
tent may be more difficult. For example, suppose we
want to label the following post. Biden is an okay
president. If the task is to determine whether or not
the post is about Biden, less background knowledge
and cognitive effort are needed to answer the ques-
tion. If the task is to determine whether or not the
post shows support for Biden, more cognitive effort
is needed since interpretation of the poster’s intent is
required. Therefore, in this analysis, we consider two
dimensions, overall reliability and reliability based on
task difficulty.
For this study, we ask Mechanical Turk workers
(MTurk labelers) and university students (student la-
Students or Mechanical Turk: Who Are the More Reliable Social Media Data Labelers?
409

Figure 1: High-level Methodology for Comparing Data Labeling Populations.
belers) to read a textual post and answer questions
about the post. Figure 1 presents the high level
methodology for the study. The first step is to design
the social media labeling tasks. This step consists of
two parts. First, given the machine learning prediction
task, we determine the data labels that would be use-
ful for building the model. We setup questions and ex-
amples. Second, we randomly select data (posts) for
labeling. The next step involves recruiting groups of
data labelers. While any crowdsourced group can be
used, this study focuses on the comparison between
two groups created using convenience sampling - Me-
chanical Turk workers and college students. The next
step involves task completion. All the data label-
ers answer the designed questions about one or more
posts. In this setting, there is no requirement that all
the data labelers label the same number of posts. Fi-
nally, we assess the reliability of each group of data
labelers overall and based on question difficulty level.
4 EXPERIMENTAL DESIGN
This section describes the specifics of our experimen-
tal design based on the methodology presented in Sec-
tion 3. We begin with a brief description of the project
and then present the details of our experimental setup.
4.1 Gun Policy Context
This study is part of a larger project that investigates
the value of using social media data to improve gun
policy.
2
There are two broad aims of this project:
1) to use social media conversation to measure gun-
related deaths in the US, and 2) to use social media
data more broadly to measure gun ownership in the
US. For both of these aims, we need to determine the
content of different posts to build machine learning
models for detecting gun-related deaths and gun own-
ership. In order to accomplish this, we need to first
determine if the content is relevant to the domain, i.e.
it is not spam, advertising, or about a topic that does
not involve firearms. We also need to determine if the
post is discussing a gun-related death or describing
the poster as a gun owner. Finally, we are interested in
determining if specific locations are being discussed.
2
Deploying Social Media Data to Inform Gun Policy
project: http://gunresearch.georgetown.domains/
4.2 Labeling Tasks
To develop models for the larger gun-related
study, we ask a series of questions about Twitter
posts/tweets. The questions are shown in Table 1. For
each question, the data labeler is typically given three
response options for each question: “Yes”, “No”, and
“Not Enough Information.” The questions range in
difficulty from one to three, with one being the eas-
iest and three being the most difficult. We deter-
mine the difficulty rating using a taxonomy proposed
by Bloom that divides survey questions into three
categories, knowledge, comprehension, and analysis
(Bloom et al., 1956). Knowledge questions can be
answered using simple recall and information that is
easily identifiable in social media posts. Comprehen-
sion requires the data labeler to understand if an idea
or concept has been described. In order to answer
a comprehension question, the data labeler must un-
derstand the basic meaning of the social media post.
Finally, analysis requires interpretation of the mean-
ing of the post, the source of the post, and/or more
specific contextual knowledge.
Table 1 contains two questions that are a difficulty
level 1, three questions that are a difficulty level 2,
and four questions that are a difficulty level 3. Or-
ganizing our questions by difficulty level allows us
to look for differences in response reliability based
on the amount of understanding labelers need about a
post and its context.
4.3 Questionnaire Design
To reduce the cognitive load of the survey, we divided
the questions into two questionnaires (Part 1 and Part
2). Both parts contained questions that ranged in cog-
nitive difficulty. To ensure consistent coding, we in-
cluded instructions, definitions, and examples. For
example, we had an operational definition for “gun-
related death” and examples of tweets that did and did
not meet that definition.
While both populations received the same instruc-
tions, definitions, examples, and questionnaire, the
student questionnaire was distributed via Qualtrics,
while the Mechanical Turk questionnaire was dis-
tributed via the Amazon Mechanical Turk platform.
All labelers received a random tweet from the pool
each time he/she completed the questionnaire, but
never received the same tweet on the same ques-
DATA 2022 - 11th International Conference on Data Science, Technology and Applications
410

tionnaire more than once. Finally, in cases where a
question seemed ambiguous or the response options
were insufficient, changes were made. This rarely oc-
curred, and will be noted during the empirical evalua-
tion when applicable.
4.4 Recruitment
Here we describe our recruitment procedure for both
the undergraduate student data labeler and the Me-
chanical Turk data labelers.
4.4.1 Student Data Labeler
The student data labelers were recruited at George-
town University. Students were recruited using club
and department email distribution lists to complete
data labeling questionnaires via Qualtrics for pay, and
the pay table was listed in the email. It ranged from
$.15 to $.30 per tweet depending on the number com-
pleted. The only requirements for participating were
that the individuals must be over 18 years old and
must be currently enrolled as an undergraduate at the
university. When students were approved for partici-
pation, they received links to both the Part 1 and Part
2 questionnaires via Qualtrics. The pay was the same
for both parts.
Recruitment took place between June, 2020 and
October, 2020. Thirty students participated and 70%
were female. The median number of tasks completed
being 33 and the maximum number of tasks allowed
per student being 500. In this context, one task maps
to one post being labeled in a Part 1 or a Part 2 ques-
tionnaire. The goal was to have each post triple-
labeled, but due to low participation by students only
Table 1: Data Labeling Questions for Twitter Posts.
Question Ease
Does the text mention guns? (Mention Guns) 1
Does text identify location of the author?
(Location) 1
Does the text describe a mass shooting?
(Mass Shooting) 2
Does the text describe a death (fatal incident)?
(Describe Death) 2
Does the text definitively identify the author
as a gun owner or NOT a gun owner? 2
(Gun Owner)
Does the text demonstrate support for gun control?
(Support Gun Control) 3
Does the text demonstrate support for gun rights?
(Support Gun Rights) 3
Is the text an advertisement? (Ads) 3
Is the text spam? (SPAM) 3
1,326 tweets were labeled twice or more for Part 1,
1,046 tweets were labeled twice or more for part 2,
and up to 1,874 tweets were labeled twice or more
for the questions that were on both parts (Spam and
Advertisement had 1,638 labels, and Mentions Guns
had 1,874). Because the reliability measures we eval-
uated require the same number of labelers per case,
in cases where 3 or more students labeled a tweet, we
randomly selected 2 of the labels for consistency.
4.4.2 Mechanical Turk Population
Mechanical Turk data labelers were recruited and paid
using the Mechanical Turk platform. Subjects were
required to be in the United States and have a Me-
chanical Turk Masters account, meaning they have
previously demonstrated a high level of success from
a large number of requesters on the platform. De-
mographics were not collected on these data label-
ers. Each task paid between $0.20 and $0.40 and
took most users 30 seconds - 4 minutes to complete.
Subjects were aware of the approximate time and the
payment of the task before choosing to participate as
the platform shows this information when an individ-
ual signs up for the labeling task. Finally, Mechan-
ical Turk workers with calculated worker agreement
of less than 50% were rejected and removed from the
participant pool.
When data labeling was complete, 8,024 tweets
were triple labeled by Mechanical Turk users. This
larger sample size was because after the 5,000 initial
tweets were labeled, we had too few tweets with ’yes’
labels to be able to train our machine learning models,
so we chose to label more data to generate a sufficient
amount of training data. For this labeler study, we
focus on the 1500 tweets that were labeled by both the
college students and the Mechanical Turk workers.
We pause to note that this project applied some
best practices for using a Mechanical Turk workforce:
only Mechanical Turk Masters were used and defini-
tions and examples for each variable were provided
(Amazon Mechanical Turk, 2011). However, this
study did not employ screening questions for labelers
before they start a task.
5 RESULTS
We divide our results into two parts, an explanation
of our reliability evaluation (Section 5.1) and the final
data labeling comparison (Section 5.2).
Students or Mechanical Turk: Who Are the More Reliable Social Media Data Labelers?
411
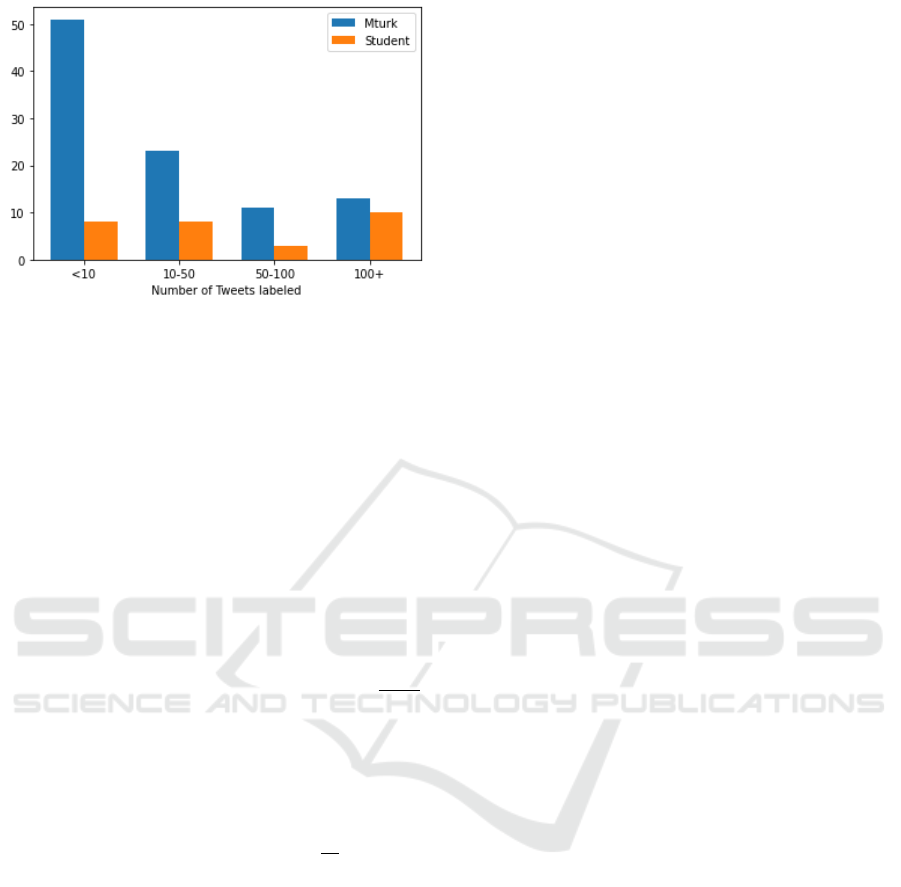
Figure 2: Distribution of Number of Posts Labeled by Stu-
dents and Mechanical Turk Workers.
5.1 Reliability Evaluation
In order to compare the reliability of these two groups
of labelers, four measures were used: Kappa score,
Alpha score, Amazon’s task-based average score and
Amazon’s worker-based average score.Because the
student population was double-labeled and the Me-
chanical Turk population was triple-labeled, the stu-
dent data set used Cohen’s Kappa (Cohen, 1960)
and the Mechanical Turk data set used Fleiss’ Kappa
(Fleiss, 1971).
Cohen’s Kappa score measures the agreement be-
tween two raters who each classify items into mu-
tually exclusive categories. It is defined as:
p
o
−p
e
1−p
e
,
where p
o
is the relative observed agreement among
raters and p
e
is the expected agreement. Fleiss’
Kappa score is an extension of Cohen’s Kappa score
for more than two raters. Krippendorff’s Alpha score
is an alternative to Kappa score that can handle var-
ious sample sizes, categories and numbers of raters.
In its general form, it is defined as: 1 −
D
o
D
e
, where D
o
is the observed disagreement among values assigned
and D
e
is the expected disagreement among values as-
signed. Task-based agreement is the ratio between the
number of tasks in which all raters agree and the to-
tal number of tasks. Worker-based agreement is ratio
between the number of tasks with mutual agreement
from all raters and number of tasks that each worker
completes. Figure 2 shows the distribution of the data
labelers. We see that most of the Mechanical Turk
workers labeled less than ten posts, while the students
tended to label more than ten posts.
5.2 Student Population Compared to
Mechanical Turk Population
The Kappa, Alpha, and Task agreement values for
the student workers and Mechanical Turk workers are
shown in Tables 2 and 3, respectively. Cohen’s sug-
gested interpretations for Kappa values are that val-
ues of ≤ 0 indicates no agreement, 0.01–0.20 as none
to slight, 0.21–0.40 as fair, 0.41– 0.60 as moderate,
0.61–0.80 as substantial, and 0.81–1.00 as almost per-
fect agreement (Cohen, 1960). Krippendorff suggests
accepting alpha values over 0.800, and where tenta-
tive conclusions are still acceptable, over 0.667 (Krip-
pendorff, 2011). We note that because our workers
only label a subset of posts as opposed to all of them,
we expect that these numbers will be lower than if
every worker had labeled every tweet in the study.
The student sample Kappa agreement ranged
from none/slight agreement for the Spam variable,
K=0.0087 (n=1639) to substantial agreement for the
Mentions Guns variable, K=0.7760 (n=1874). The
average value for Kappa across variables was 0.2657,
which is typically interpreted as “fair agreement.”
Only one variable had substantial agreement (Men-
tions Guns), and five variables fell in the category of
no agreement to slight agreement (Support Gun Con-
trol, Support Gun Rights, Gun Owner Definitive, Lo-
cation, Spam). When calculating Krippendorff’s al-
pha, student results ranged from 0.0041 to 0.7748,
with the best result being for “Mentions Guns” and
the average value being 0.2708. In the student sample,
no variables met Krippendorff’s criteria for reliabil-
ity and only Mentions Guns met Krippendorff’s tenta-
tive criteria. Finally, using Amazon’s computer task-
based averages, student results ranged from 0.8356
to 0.9762, with the best result being for “Describes a
Mass Shooting” and the average score being 0.9131.
This means that agreement for specific posts was high
among the student workers.
The Mechanical Turk sample Kappa agreement
ranged from fair agreement for the Support Gun
Control variable, K=0.2773 (n=1500) to substantial
agreement for the Advertisement variable, K=0.7871
(n=1500). The average value for Kappa across vari-
ables was 0.6212, which can be interpreted as “sub-
stantial agreement.” Only two variables had Kappa
values indicating fair agreement (Gun Owner, Sup-
port Gun Control), and all other variables had val-
ues indicating substantial agreement. When calcu-
lating Krippendorff’s alpha, Mechanical Turk results
ranged from 0.2774 to 0.7969, with the best result be-
ing “Is Advertisement” and the average score being
0.6212. No variables met Krippendorff’s criteria for
reliability and four variables (Spam, Advertisement,
Mentions Guns, Mass Shooting) met Krippendorff’s
tentative criteria. Finally, using Amazon’s computer
task-based averages, Mechanical Turk results ranged
from 0.8233 to 0.9730, with the best result being “Is
Advertisement” and the average score being 0.9211.
DATA 2022 - 11th International Conference on Data Science, Technology and Applications
412

Table 2: Reliability of Student Labels for Questions About Social Media Posts.
Variable Cohen’s Kappa Landis and Koch
Benchmark
Krippendorff’s
Alpha
Krippendorff’s
criteria met
Task Agreement
Mentions Guns
(n = 1874)
0.7760 Substantial
Agreement
0.7748 Tentative criteria
met
0.9013
Mass Shooting
(n=1326)
0.4695 Moderate
Agreement
0.4570 No 0.9382
Describes Death
(n=1326)
0.4629 Moderate
Agreement
0.4722 No 0.8431
Support Gun Control
(n=1046)
0.1042 Slight Agreement 0.1177 No 0.5889
Support Gun Rights
(n=1046)
0.1398 Slight Agreement 0.1255 No 0.5707
Gun Owner
(n=1046)
0.0484 Slight Agreement 0.0860 No 0.7505
Location
(n=1046)
0.1626 Slight Agreement 0.1814 No 0.8585
Advertisement
(n = 1639)
0.2193 Fair Agreement 0.2185 No 0.8181
Spam
(n = 1639)
0.0087 None/Slight
Agreement
0.0041 No 0.6252
Table 3: Reliability of Mechanical Turk Labels for Questions About Social Media Posts.
Variable Fleiss’ Kappa Landis and Koch
Benchmark
Krippendorf’s
Alpha
Krippendorf’s
criteria met
Task Agreement
Mentions Guns
(n=1500)
0.7422 Substantial
Agreement
0.7422 Tentative criteria
met
0.9391
Mass Shooting
(n=1500)
0.6921 Substantial
Agreement
0.6921 Tentative criteria
met
0.9542
Describes Death
(n=1500)
0.6348 Substantial
Agreement
0.6348 No 0.8233
Support Gun Control
(n=1500)
0.2773 Fair Agreement 0.2774 No 0.9422
Support Gun Rights
(n=1500)
0.6560 Substantial
Agreement
0.6560 No 0.8260
Gun Owner
(n=1500)
0.3439 Fair Agreement 0.3439 No 0.9622
Location
(n=1500)
0.6605 Substantial
Agreement
0.6605 No 0.9494
Advertisement
(n=1500)
0.7969 Substantial
Agreement
0.7969 Tentative criteria
met
0.9730
Spam
(n=1500)
0.7871 Substantial
Agreement
0.7871 Tentative criteria
met
0.9540
Finally, we note that there was a slight change to the
gun ownership question during the study. After the
change, there were slight changes in the Kappa and
Alpha values that do not impact the interpretation.
For the Task agreement, the impact was significant
for Mechanical Turk workers, from 0.7509 to 0.9622.
We also computed worker-based averages for the
student sample using Mechanical Turk’s formula for
this measure. During data collection for the Mechan-
ical Turk sample, we received this reliability data as
workers were labeling and we would reject Mechan-
ical Turk workers with scores lower than 0.5. If we
followed the same procedure for the student work-
ers, this would eliminate three student workers who
labeled a total of 104 tweets. Students ranged from
scores of 0.4412 to 0.7333 using this measure, and if
Students or Mechanical Turk: Who Are the More Reliable Social Media Data Labelers?
413
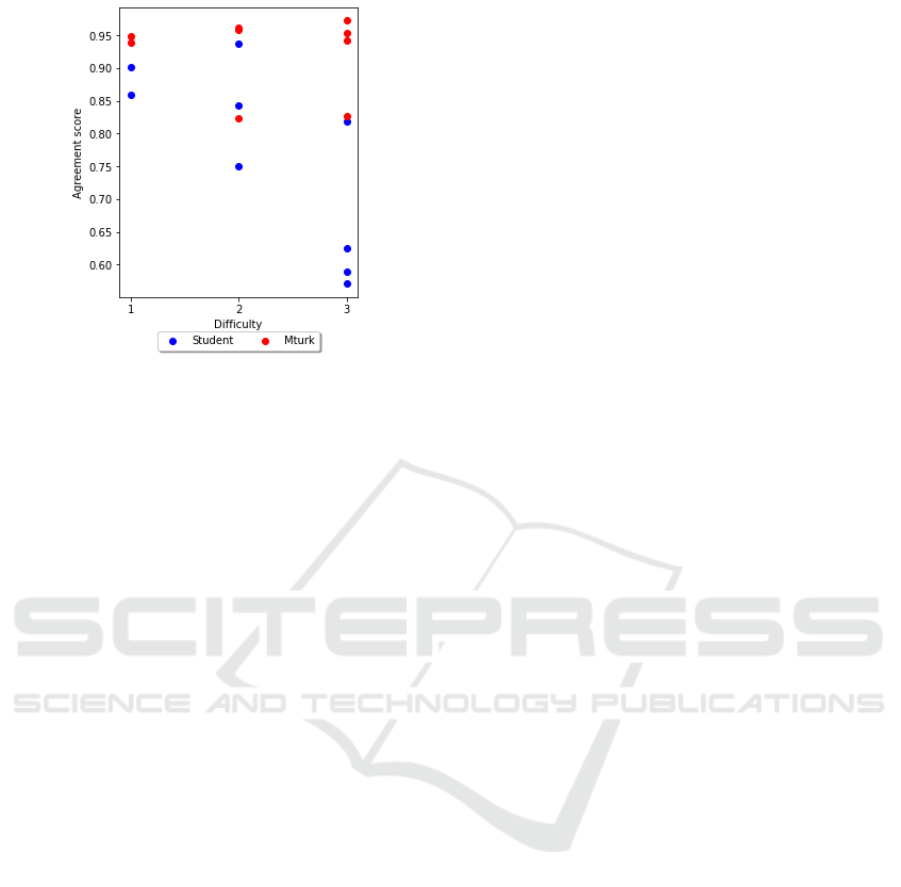
Figure 3: Reliability based on Difficulty of Question.
we focused on students who completed over 50 sur-
veys, students ranged from scores 0.4528 to 0.6422
and the average score was 0.5645.
5.3 Discussion
Overall, the Mechanical Turk labeled dataset had
comparable or higher levels of reliability for all vari-
ables. There are a number of reasons this may have
occurred. First, we only used Mechanical Turk Mas-
ters for this study. These are workers who have per-
formed well on other labeling tasks. Our student
workers were not required to have prior labeling ex-
perience. Another likely source of this difference is
the higher number of labelers in the Mechanical Turk
dataset. It was much quicker to recruit labelers on
Mechanical Turk as almost all users logging into the
platform are looking for work to do, as opposed to
the student population where not necessarily every or
even most of the students on our email distribution list
were looking for paid work. At any given time there
are over 2,000 active Mechanical Turk workers from
a pool of over 100,000 workers (Difallah et al., 2018),
while the Georgetown undergraduate student popula-
tion is only about 7,500, many of whom may not be
necessarily be interested in paid work, or may expect
more pay for the work they do.
For some variables, this difference in reliability
was notably higher and indicates the potential use of
Mechanical Turk as a useful source of labeling data
beyond its ability to gather results quickly. For Sup-
port Gun Rights, Location, Advertisement and Spam,
the student labeled data set had Kappa values indicat-
ing no agreement to fair agreement, and the Mechani-
cal Turk labeled data set had Kappa values indicating
substantial agreement. These consistently high relia-
bility values for Mechanical Turk labels indicate that
Mechanical Turk may be both an efficient and reliable
source of labeling data for training a machine learning
model. For Mass Shooting and Describes Death, stu-
dent results had moderate agreement and Mechanical
Turk results had substantial agreement, and for Sup-
port Gun Control and Gun Owner Definitive, student
results had slight agreement while Mechanical Turk
results had fair agreement.
Figure 3 organizes the task-based average reliabil-
ity scores based on difficulty of the question. We see
that the Mechanical Turk workers have higher scores
across the difficulty levels. We see all the workers per-
form better on the easiest questions, and higher levels
of variability in reliability scores as the question diffi-
culty increases. We believe that this finding suggests
the importance of attention checks to ensure that the
quality of coding remains high throughout. Because
of the modest size of the study, a larger study with
five coders and more questions across difficulty levels
for each post would improve our understanding of the
differences that occurred.
6 CONCLUSIONS
The goal of this paper was to compare the reliability
of university students and Mechanical Turk workers
for labeling tasks involving social media posts. We
found that for most of the labeling tasks, the Me-
chanical Turk workers had stronger agreement than
the student workers. Mechanical Turk workers also
maintained higher levels of reliability for more diffi-
cult questions. These results indicate that Mechanical
Turk can be a useful resource for quickly gathering
reliable training data for machine learning models.
There are practices that are recommended that we
did not use. However, we anticipate that the reliability
across both groups would have improved if we used
them. First, we could have added screening ques-
tions at the start of the task to ensure users under-
stood the directions before labeling began. Second,
we had to change one question slightly in the middle
of the study. Better testing of the questions prior to the
study could have helped avoid this situation. Third,
attention testing has been shown to improve reliabil-
ity. While these are very short, micro-tasks, for those
who complete more than ten, having attention tests
may be important. Ultimately, labeling social media
posts was a task that did not require experts, but did
require some care. For tasks that fit into this category,
Mechanical Turk is a reasonable platform for larger-
scale data labeling efforts. Finally, while this is a first
step toward understanding the reliability of data la-
beling for tasks involving social media, future work
DATA 2022 - 11th International Conference on Data Science, Technology and Applications
414

is necessary to understand the minimum number of
workers for each task, the difference in reliability be-
tween labels involving fewer vs more choices, and the
impact of compensation on worker quality.
ACKNOWLEDGEMENTS
This research was supported in part by National Sci-
ence Foundation awards #1934925 and #1934494,
the National Collaborative on Gun Violence Research
(NCGVR), and the Massive Data Institute (MDI) at
Georgetown University. We thank our funders and the
MDI technical team for supporting this research.
REFERENCES
Adams, T. L., Li, Y., and Liu, H. (2020). A replication
of beyond the turk: Alternative platforms for crowd-
sourcing behavioral research–sometimes preferable to
student groups. AIS Transactions on Replication Re-
search, 6(1):15.
Amazon Mechanical Turk (2011). Requester best practices
guide. Amazon Web Services.
Bloom, B., Englehart, M., E., F., Hill, W., and Krathwohl,
D. (1956). Taxonomy of educational objectives: The
classification of educational goals. Handbook I: Cog-
nitive domain.
Buchheit, S., Dalton, D. W., Pollard, T. J., and Stinson,
S. R. (2019). Crowdsourcing intelligent research par-
ticipants: A student versus mturk comparison. Behav-
ioral Research in Accounting, 31(2):93–106.
Cohen, J. (1960). A coefficient of agreement for nominal
scales. Educational and psychological measurement,
20(1):37–46.
Difallah, D., Filatova, E., and Ipeirotis, P. (2018). Demo-
graphics and dynamics of mechanical turk workers. In
Proceedings of the ACM International Conference on
Web Search and Data Mining, page 135–143.
Fleiss, J. L. (1971). Measuring nominal scale agree-
ment among many raters. Psychological bulletin,
76(5):378.
Gillick, D. and Liu, Y. (2010). Non-expert evaluation of
summarization systems is risky. In Proceedings of the
NAACL HLT Workshop on Creating Speech and Lan-
guage Data with Amazon’s Mechanical Turk, pages
148–151.
Goodman, J. K., Cryder, C. E., and Cheema, A. (2013).
Data collection in a flat world: The strengths and
weaknesses of mechanical turk samples. Journal of
Behavioral Decision Making, 26(3):213–224.
Hamby, T. and Taylor, W. (2016). Survey satisficing in-
flates reliability and validity measures: An experimen-
tal comparison of college and amazon mechanical turk
samples. Educational and Psychological Measure-
ment, 76(6):912–932.
Hauser, D. J. and Schwarz, N. (2016). Attentive turkers:
Mturk participants perform better on online attention
checks than do subject pool participants. Behavior re-
search methods, 48(1):400–407.
Kees, J., Berry, C., Burton, S., and Sheehan, K. (2017). An
analysis of data quality: Professional panels, student
subject pools, and amazon’s mechanical turk. Journal
of Advertising, 46(1):141–155.
Krippendorff, K. (2011). Computing krippendorff’s alpha-
reliability.
Rouse, S. V. (2015). A reliability analysis of mechanical
turk data. Computers in Human Behavior, 43:304–
307.
Schnoebelen, T. and Kuperman, V. (2010). Using amazon
mechanical turk for linguistic research. Psihologija,
43(4):441–464.
Van Horn, G., Branson, S., Farrell, R., Haber, S., Barry,
J., Ipeirotis, P., Perona, P., and Belongie, S. (2015).
Building a bird recognition app and large scale dataset
with citizen scientists: The fine print in fine-grained
dataset collection. In Proceedings of the IEEE Con-
ference on Computer Vision and Pattern Recognition,
pages 595–604.
Weigold, A. and Weigold, I. K. (2021). Traditional and
modern convenience samples: an investigation of col-
lege student, mechanical turk, and mechanical turk
college student samples. Social Science Computer Re-
view.
Zhou, N., Siegel, Z. D., Zarecor, S., Lee, N., Camp-
bell, D. A., Andorf, C. M., Nettleton, D., Lawrence-
Dill, C. J., Ganapathysubramanian, B., Kelly, J. W.,
et al. (2018). Crowdsourcing image analysis for
plant phenomics to generate ground truth data for
machine learning. PLoS computational biology,
14(7):e1006337.
Students or Mechanical Turk: Who Are the More Reliable Social Media Data Labelers?
415
