
Blanket Clusterer: A Tool for Automating the Clustering in
Unsupervised Learning
Konstantin Bogdanoski
a
, Kostadin Mishev
b
and Dimitar Trajanov
c
Faculty of Computer Science and Engineering, Ss. Cyril and Methodius University,
Rugjer Boshkovikj 16, Skopje, North Macedonia
Keywords:
Unsupervised Learning, Clustering, Hierarchical Clustering, Data Visualization, Machine Learning,
Algorithm Optimisation, Machine Learning Tools, Blanket Clusterer, Silhouette Score.
Abstract:
We propose a generic hierarchical clustering algorithm - named Blanket Clusterer, which allows researchers
to examine their data and verify the results gained from other machine learning techniques. We also integrate
a three-dimensional visualization plugin that provides better understanding of the clustering results. We verify
the tool on a specific use-case, i.e., measuring the clustering techniques performances on a textual dataset
based solely on ICD-9 descriptions encoded using the Word2Vec distributed representations. The verification
shows that Blanket Clusterer provides an efficient pipeline for evaluating and interpreting the most frequently
used clustering methods in unsupervised learning.
1 INTRODUCTION
Clustering is one of the most popular machine learn-
ing techniques regarding unsupervised learning meth-
ods. The idea behind them is to use mathematical
equations to successfully divide the dataset into sub-
sets. These algorithms allow the user to automatically
divide the set into subsets, perchance gaining previ-
ously unknown facts about it(Bhardwaj et al., 2019).
The effort to execute the clustering algorithms and de-
termine the best one is often a time-consuming and
exhaustive task that depends on the dataset format and
characteristics. This paper presents a tool that encom-
passes multiple clustering techniques, named Blan-
ket Clusterer. Blanket Clusterer, in terms of prob-
lems revolving around clustering data, automates the
complex process of dataset preparation, execution,
and evaluation of different families of clustering al-
gorithms based on dataset metadata and algorithm re-
quirements. Furthermore, it implements advanced 3D
visualization plots to better interpret the algorithms’
results and aid the algorithms assessment and verifi-
cation process. Blanket Clusterer currently incorpo-
rates multiple clustering algorithms which we discuss
in this paper. They vary from bottom-up to top-down
a
https://orcid.org/0000-0003-4879-9870
b
https://orcid.org/0000-0003-3982-3330
c
https://orcid.org/0000-0002-3105-6010
approaches, from hierarchical to non-hierarchical al-
gorithms. Furthermore, regarding the hierarchy seg-
ment of our algorithm, due to the fact that not all clus-
tering algorithms are hierarchical algorithms and our
use-case has a dataset which needs hierarchy, we im-
plement a custom hierarchical algorithm, which di-
vides the set into subsets, thus implementing this fea-
ture in clustering algorithms which did not have it.
In this study, we perform verification of the clus-
tering tool on a specific use-case scenario. All claims
submitted by physicians to the Medical Services Plan
(MSP) must include a diagnostic code. This informa-
tion allows MSP to verify claims and generate statis-
tics about causes of illness and death. The Interna-
tional Classification of Disease (ICD) coding system
divides diseases and health conditions into similar
categories based on body systems and health condi-
tions. More specifically, ICD-9 diagnostic codes are
based on the ninth revision of the coding standard.
The ICD-9 codes are organized into 19 chapters, and
a specific code range identifies each chapter. Each di-
agnosis is presented by ICD-9 code and description.
First, we leverage these textual descriptions to build a
dataset that we are using to verify the tool we propose.
Next, we use Word2Vec to encode these descriptions
into a distributed vector representation. The results,
the sequence of real-valued vectors, are given as in-
put to our Blanket Clusterer tool to perform clustering
using the implemented clustering algorithms. Finally,
Bogdanoski, K., Mishev, K. and Trajanov, D.
Blanket Clusterer: A Tool for Automating the Clustering in Unsupervised Learning.
DOI: 10.5220/0011276000003277
In Proceedings of the 3rd International Conference on Deep Learning Theory and Applications (DeLTA 2022), pages 125-131
ISBN: 978-989-758-584-5; ISSN: 2184-9277
Copyright
c
2022 by SCITEPRESS – Science and Technology Publications, Lda. All rights reserved
125

we assess the category label for each diagnosis ob-
tained from the clustering algorithms’ output by com-
paring it to the ICD-9 chapter, thus measuring their
effectiveness to categorize the texts using only the di-
agnosis descriptions.
Lastly, we develop a three-dimensional visualiza-
tion tool, which works with the results in visually rep-
resenting them for ease of use. The main tool which
was used for the hierarchical representation is Carrot-
Search’s FoamTree
1
, as described in Section 3 Blan-
ket Clusterer.
As a short summary of our work, we:
• propose a generic hierarchical clustering module
that integrates the most common used clustering
algorithms;
• provide three-dimensional representation of the
obtained clusters, with various color-coded val-
ues, for easier interpretation of the results;
• provide statistical information about performance
(time, number of clusters) related to the differ-
ent types of covered clustering algorithms, while
also offering a foundation for future implementa-
tions of new clustering algorithms - either by im-
plementing an already existing one, or building a
brand new one from scratch, as long as it handles
the specific object type which we already cover in
the algorithm.
• validate clustering results with silhouette scores
for each algorithm used
The Blunket Clusterer tool and code is available on:
• Docker, though their DockerHub library, on
docker.hub/kbogdanoski/blanket-clusterer
• GitHub, available at git.com/Blanket-Clusterer
2 RELATED WORK
We previously stated that Blanket Clusterer is an al-
gorithm which covers different clustering algorithms,
hence the word ”blanket” in the name. K-Means is
one of the algorithms which is being broadly used
in various Machine learning studies(Govender and
Sivakumar, 2020). K-Means is an algorithm which
exists for at least 60 years and although there have
been a couple of algorithms which have had a proof
of concept after it, k-means has remained as one
of the most widely used algorithms due to it’s sim-
plicity, ease of implementation and efficiency(Jian,
2009)(Govender and Sivakumar, 2020). Aside from
1
FoamTree is available at https://www.carrotsearch.
com/foamtree/
work with datasets extracted from textual informa-
tion, through a natural language processing technique,
k-means has shown that it does not make any differ-
ence when it comes to using datasets when they come
from different industries, such as using data in studies
related to spatial-temporal characteristics of air pol-
lution, pollutant behavior in terms of space and so
on(Govender and Sivakumar, 2020). De facto, the au-
thors of the paper(Govender and Sivakumar, 2020),
focus on the problem with applying k-means and hier-
archical clustering techniques for analysis of air pol-
lution, since clustering has been widely applied to at-
mospheric science data, climate and meteorological
data.
Clustering algorithms work with mathematical
equations, thus they need numerical values for the cal-
culations. Although words, sentences, can be trans-
formed into numeric vectors, while at the same time
containing much valuable information, the same can
be said with processing images, as they, on the bottom
side, are an array of numerical values representing
the pixels and position of them. Re-identification is
a sub-task in the field of image processing problems,
as the main goal is to match pictures of the same per-
son that appears in different cameras, commonly used
as a tool in the identification of pedestrian crossings
around the world in the feat to identify pedestrian in-
formation(Zeng et al., 2020), allowing the officials to
maintain control without being present at the said in-
tersection.
The authors in (Glielmo et al., 2021) propose an
overview of all algorithms currently used to extract
simplified models from molecular simulations to un-
derstand the simulated systems on a physical level.
More precisely, they discuss feature representation of
molecular systems and present state-of-the-art algo-
rithms, divided in five sections: dimensional reduc-
tion, density estimation and clustering, and kinetic
models. Figure 1 shows possible steps that can be per-
formed to analyze data from a molecular simulation
with an indication of the particular section in which
they are used - Density estimation and Clustering.
According to the research done with the paper
”Combining hierarchical clustering algorithms using
the PCA method”(Jafarzadegan et al., 2019), it was
confirmed that the performance of the various unsu-
pervised learning techniques, specifically clustering
and classification designs, depends on the problem at
hand, as well as the pertinent method used to solve
said problem. Additionally, using the same, or simi-
lar, method for contrasting problems, might and most
likely will, produce unreliable results. For this rea-
son, Blanket Clusterer allows the researchers to try
out different types of clustering algorithms, in an ef-
DeLTA 2022 - 3rd International Conference on Deep Learning Theory and Applications
126

Figure 1: Unsupervised learning methods for molecular
simulation.
fort to find the best one, while testing out different
possibilities at the same time.
Even though a clustering algorithm is selected
for the task at hand, researchers still might not be
pleased with the results. Further optimization is pos-
sible through the use of Principal Component Anal-
ysis - PCA, as shown in the research paper: ”Opti-
mization of fuzzy c-means clustering algorithm with
combination of minkowski and chebyshev distance
using principal component analysis”(Surono and Pu-
tri, 2021), where it was shown that reducing the num-
ber of dimensions for each entry in the dataset, while
using PCA as a technique, the clustering accuracy ob-
tained had an accuracy score of 1.6468(Surono and
Putri, 2021). PCA, or principal component analysis,
is an analysis method which aims to transform a high-
dimensional dataset into a low-dimensional space,
while not losing any of the features which are impor-
tant to the knowledge of the model. PCA uses alge-
braic equations to reduce dimensions that are inter-
connected with other dimensions within the dataset,
into new data with unrelated dimensions named prin-
cipal components(Farjo et al., 2013).
Aside from using PCA as a tool to optimize cus-
tom clustering algorithms, it can also be used in
already-known algorithms. As shown by the re-
search of Abdulhafedh(Abdulhafedh, 2021), using
PCA alongside the K-Means clustering algorithm in
the aim to divide a dataset containing customers into
segments, so plausible marketing strategies may be
used for the customers with whom the possibility of
them accepting the offer, is greater than before.
We mention PCA as it is a valuable tool in unsu-
pervised learning techniques, as it is a feature which
will be developed to work alongside Blanket Clus-
terer, to further provide assistance and recommenda-
tions to the researchers who do use this tool.
In recent years, data scientists have become very
hard to find, due to the high demand. AutoML, sim-
ilar to Blanket Clusterer, is a tool which aims to re-
move the need of having a data scientist to anal-
yse, preprocess, process, extract knowledge from a
dataset, with providing a tool to allow other users,
such as domain experts, to automatically create ma-
chine learning applications, without the prerequisite
of having statistical and machine learning knowl-
edge.(He et al., 2021). As shown in Figure 2, Au-
toML extracts features from the dataset, it generates
a model for said dataset, and estimates the model,
prior to providing it to the user. In contrast to Au-
toML which provides tools for supervised learning,
using the benefits of techniques such as Convolu-
tional Neuron Networks (CNNs), and Recurrent Neu-
ral Networks (RNNs), Blanket Clusterer is a tool
which handles tasks related to unsupervised learning,
mainly clustering algorithms for unlabeled and/or la-
beled data, using the benefits of the simple to un-
derstand techniques, their efficiency and efficacy (as
shown in Figure 3). There are various implementa-
tions of AutoML, including Google’s Cloud AutoML.
Figure 2: AutoML execution pipeline.
Figure 3: Blanket Clusterer execution pipeline.
EfficientDet is a tool in the AutoML segment(Tan
et al., 2020), which aims to increase the efficiency
and scalability, while also providing optimizations
for further improvement. As an important note Ef-
ficientDet’s algorithm operates in supervised learn-
ing manor, especially object detection in provided
datasets. Blanket Clusterer on the other hand, pro-
vides results for whatever task, as long as the dataset
conforms to the requirements of the tool in terms of
the format. GIT(Gao et al., 2021) is another cluster-
ing algorithm, based on graph clustering which aims
to increase the performance related to graph cluster-
ing. This contrasts our tool which can handle datasets
from different sources, as previously stated.
HypHC(Chami et al., 2020) is a hierarchical clus-
tering algorithm, with a goal to compare different al-
gorithms, measure their quality and explain their suc-
cess or failure, similar to our tool. The main differ-
ence between these two algorithms, is that HypHC
utilizes the discrete cost function over space proposed
by Dasgrupta(Dasgupta, 2016), while Blanket Clus-
terer does not, in its current state.
Blanket Clusterer: A Tool for Automating the Clustering in Unsupervised Learning
127
3 BLANKET CLUSTERER
3.1 Goal
Blanket Clusterer is a Python module which aims to
provide a straightforward generic hierarchical cluster-
ing algorithm, alongside a clean 3D
2
visualization, to
better understand the received results.
The tool integrates the most commonly used clus-
tering algorithms in one place:
• K-Means
• Agglomerative
• Birch
• DBSCAN
As an important side note, DBSCAN due to its im-
plementation, does not provide the preferred results,
compared to the other algorithms, thus this algorithm
was not part of our testing and validation segment.
Additionaly, Blanket Clusterer adds another level
of functionality in allowing to hierarchically clus-
ter data with said algorithms, as well as adding
a visualization functionality, using CarrotSearch’s
FoamTree
TM
library, and measuring their perfor-
mance through Silhouette scores.
3.2 Implementation
As previously stated, Blanket Clusterer works with
other types of clustering algorithms. Aside from us-
ing these algorithms, it also eases the process in using
them, with automating the whole process. Addition-
ally, Blanket Clusterer provides a three-dimensional
visualization of the results and provides a Silhouette
metric of the clustering results for each algorithm.
Figure 4: Blanket Clusterer classes.
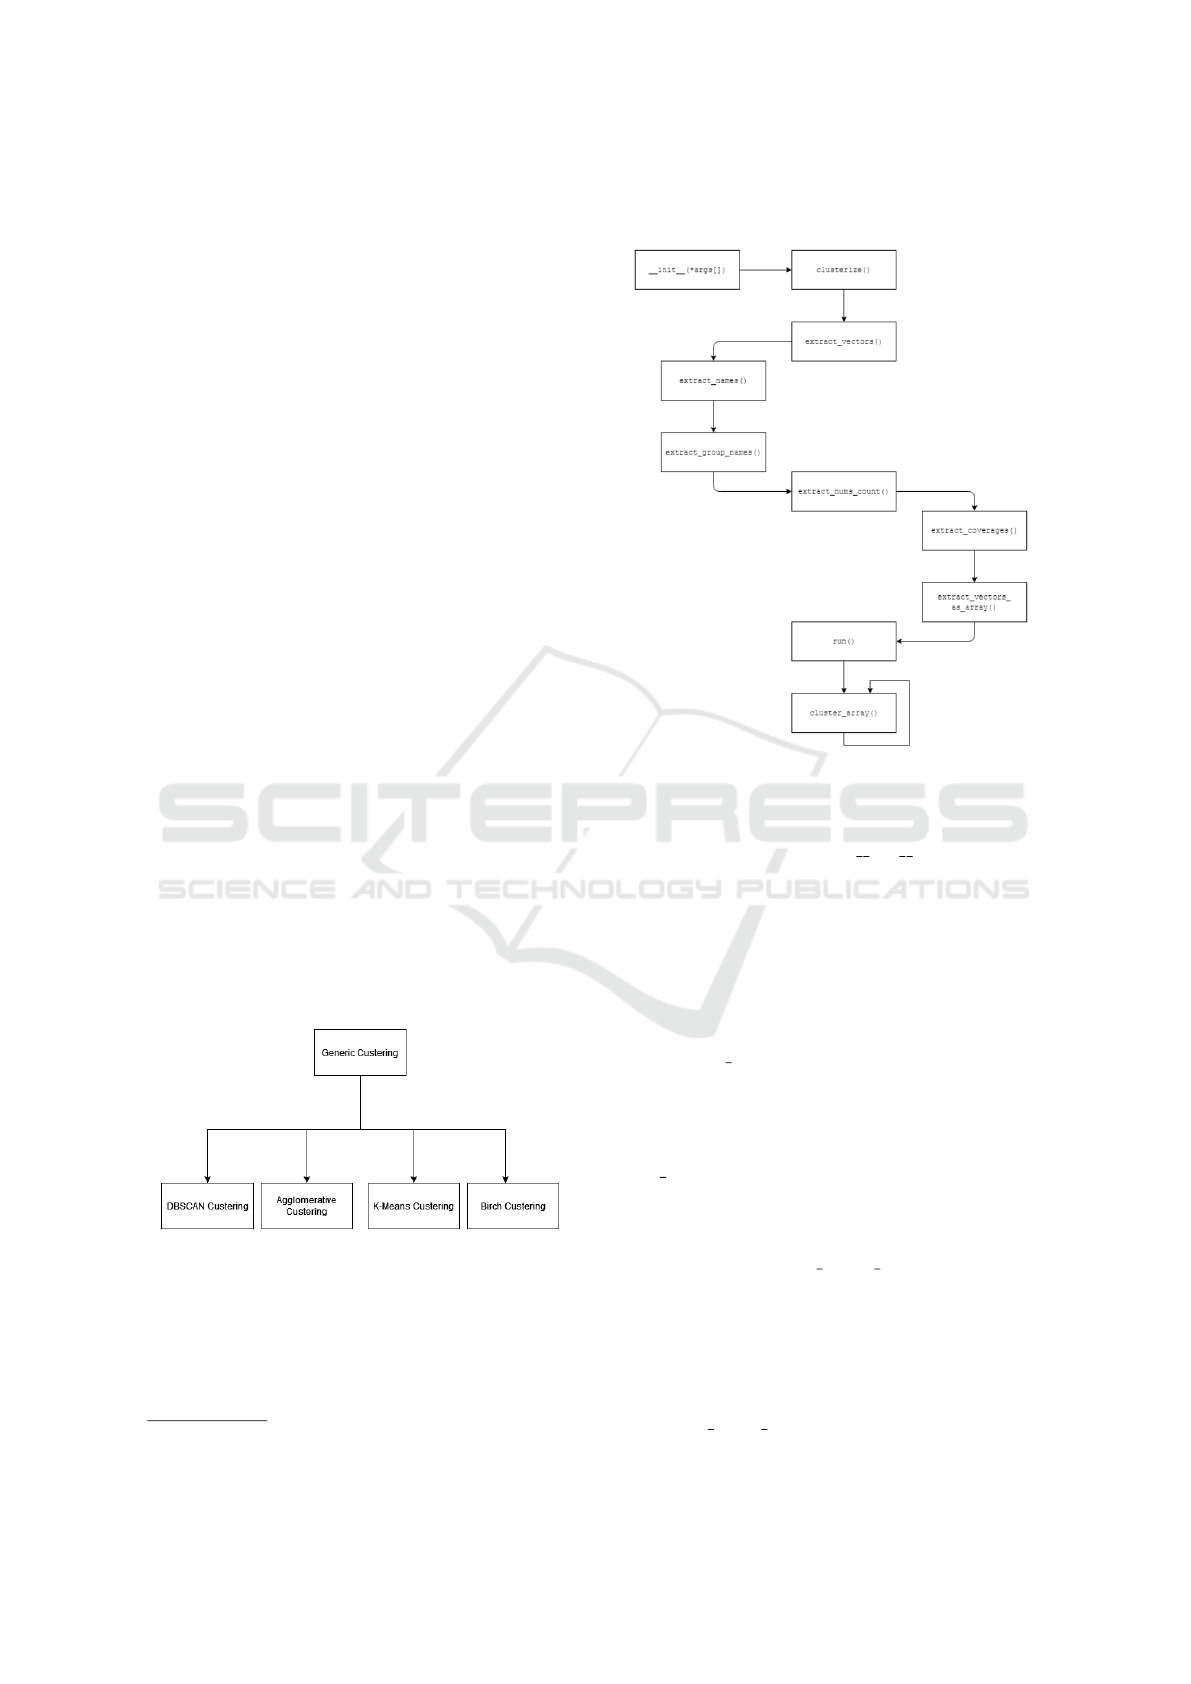
The pipeline (shown in Figure 5) implemented
in the Blanket Clusterer, consists of multiple steps.
All of the classes are built upon a predefined class
(Generic Clusterer, as shown in Figure 4), in which
we have defined those methods that are needed for
each algorithm.
2
3D - Three dimensional representation
3.3 Pipeline
Figure 5: Execution pipeline.
As previously stated, the execution pipeline of the al-
gorithm is shown in Figure 5. The pipeline starts
with the constructor, or the init () method. This
method sets up the object which will be used to clus-
ter the data. It fills the necessary attributes with the
needed data.
As we initialize the Object, when creating a new
variable, the constructor is called. After creating the
object, we need only to call the method clusterize()
which will inherently call other methods in the class.
The first method in the pipeline after clusterize()
is the extract vectors() which will extract the vectors
into the required format. The vectors are stored in a
dictionary in a key-value format.
After extracting the vectors, we extract the keys
so we can have them in a dictionary, with the ex-
tract names() method. This method is needed for
evaluation purposes to compare the cluster predic-
tions to the ground-truth clusters.
Next, we need to extract the group names, if pro-
vided, using the extract
group names(). It is quite
similar to the name extraction process, but we will
talk about it more in the next section.
The embeddings, names and group-names are not
the only attributes necessary for our algorithm. We
also need to extract the number of times a key is seen
in the cluster and in which group it belongs to. Using
the extract nums count() does that for us, and this is
DeLTA 2022 - 3rd International Conference on Deep Learning Theory and Applications
128
needed for a better presentation of the results.
Alongside the number of times a code occurs in a
cluster, are the coverage values, which are extracted
with extract coverages(). Those coverage values
provide the color for our entities in the cluster, and the
whole cluster overall. This is also not necessary, just
like the group-names and the number of occurrences.
The color is produced with a simple mathematical
equation, because the color format is HSL
3
, we can
divide the number 360 by the number of groups there
are. With this simple math equation, we give a cer-
tain group, a certain color, which in return provides
us with a better visualization in the end.
Until now, we have extracted the vectors in
a dictionary, and the code they represent in the
key position of the dictionary, but the algorithms
need numerical arrays to operate. The method ex-
tract vectors as array() does that for us, and stores
the numerical values as arrays, making them ready for
clustering.
After all these methods, comes the run() method,
which checks if everything was okay up until this
point, and starts the process of hierarchically cluster-
ing the data. If everything passes okay to this point
and all the data entered was valid, the process should
provide results without any setbacks.
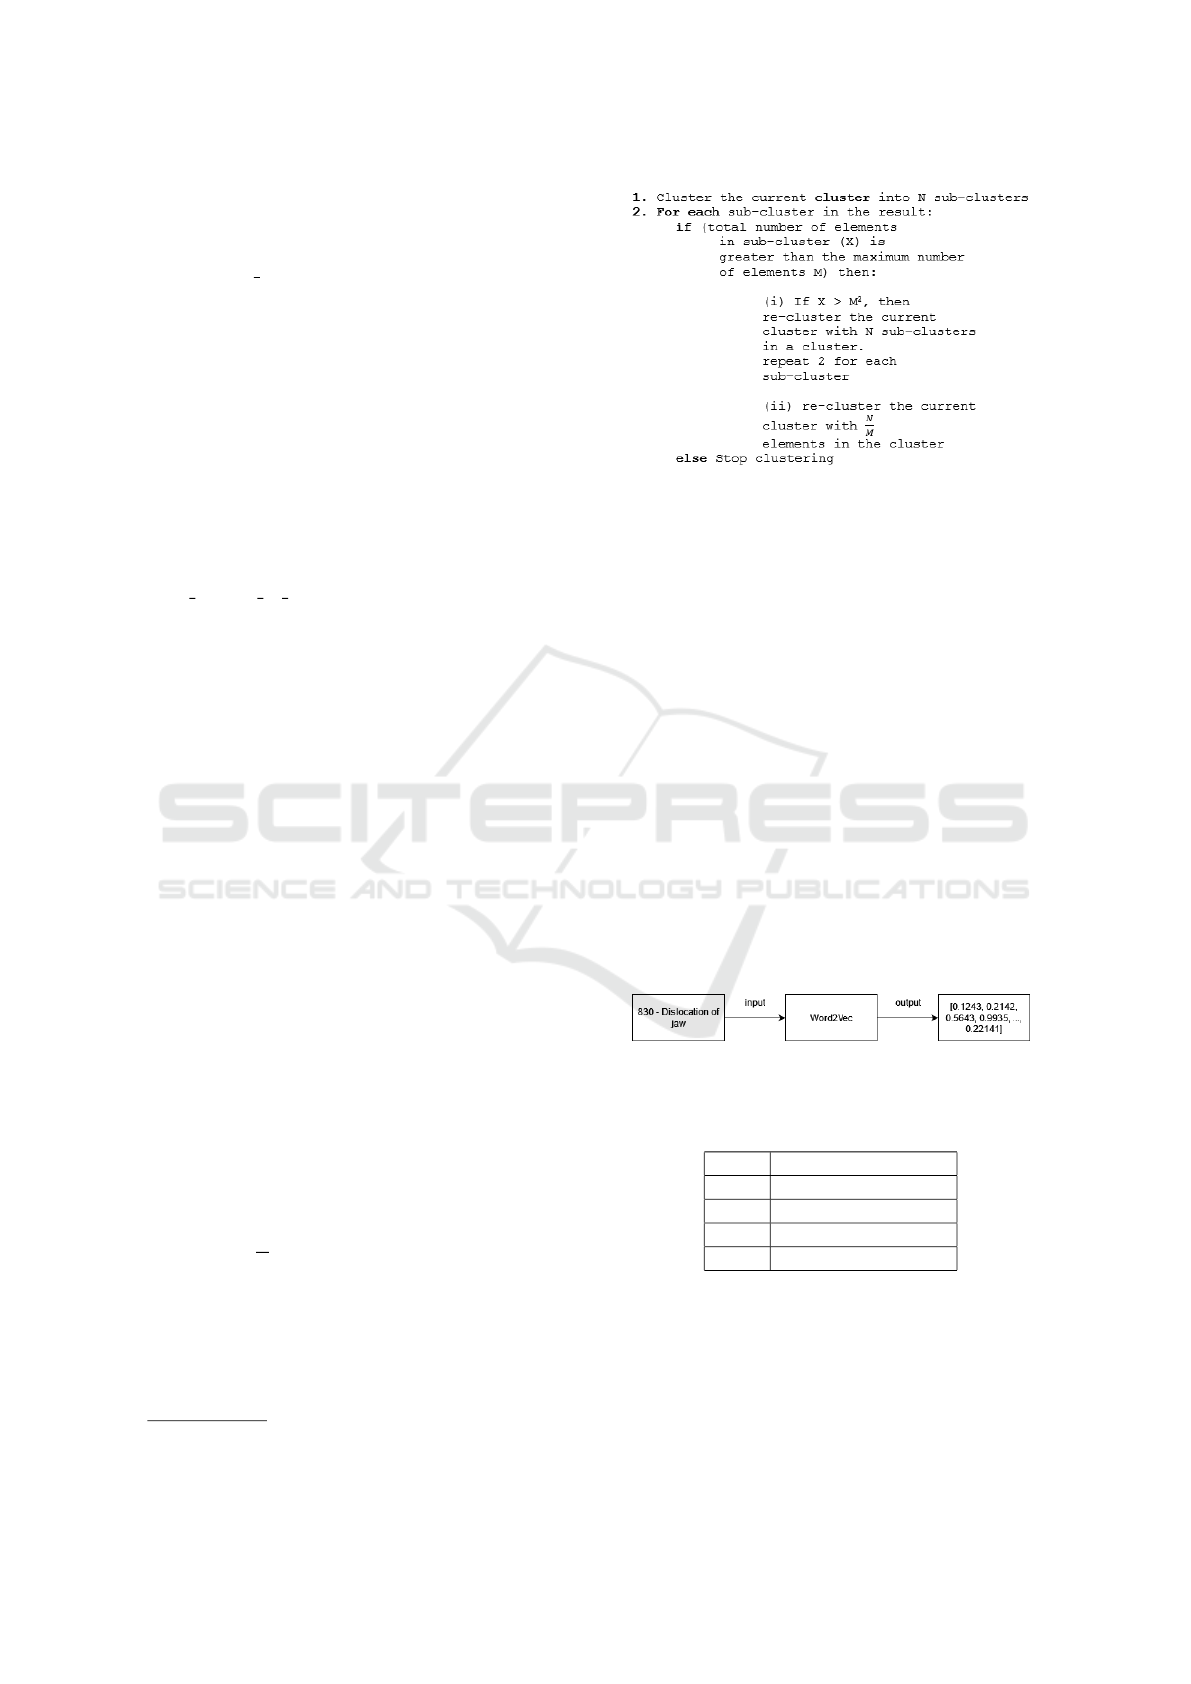
3.3.1 Hierarchical Algorithm
The crucial part of our tool is having hierarchical re-
sult of the datasets. Our hierarchical algorithm is cus-
tom made, displayed with the pseudo code shown in
Figure 6.
The pseudo code is straight-forward. Initially we
give the tool a huge cluster of data. The tool then
clusters the bigger cluster into smaller sub-clusters
(the number of sub-clusters - N, is provided by the
user). Afterwards, for each sub-cluster, there is a sim-
ple check: If the total number of elements in the clus-
ter (X), does not exceed the maximum allowed num-
ber of elements in a cluster (M), clustering for the cur-
rent level is completed. Otherwise if X is greater than
M, another check is needed to see how big the differ-
ence is. If X is greater than M squared (M
2
), then the
cluster is divided into sub-clusters with N elements
in each one, otherwise the cluster is divided into sub-
clusters with
N
M
elements in the cluster.
3
HSL - H-hue, S-saturation, L-luminance, color format
Figure 6: Hierarchical algorithm pseudo-code.
4 USE-CASE EVALUATION
SCENARIO
4.1 Dataset
To validate Blanket Clusterer, a specially designed
dataset comprised with ICD-9 descriptions of the di-
agnoses is used. The Word2Vec word vectors are used
for encoding these descriptions. We took the word
embeddings from Word2Vec and applied clustering
techniques with our tool.
The final input for the Blanket Clusterer is com-
posed of a dictionary, whose key is the ICD-9 code,
and value is the diagnosis description represented as
a list of word vectors, as shown in Figure 7. We use
Blanket Clusterer to cluster the vectors (shown in Ta-
ble 1), hierarchically and validate the results after-
ward.
Figure 7: Example of ICD-9 to vector transformation.
Table 1: Key - Value of word embeddings in Word2Vec
model.
Key Value
001 [0.11, 0.22, ..., 0.99]
002 [0.22, 0.33, ..., 0.88]
... ...
E999 [0.99, 0.99, ..., 0.99]
To better understand the clustering results, aside
from using the model’s embeddings, we also pro-
vide a dataset consisting of human readable names of
the ICD-9 codes, so Blanket Clusterer can hierarchi-
cally name the clusters accordingly. This allows us to
further validate our tool, with comparing the perfor-
mance. As shown in Table 2, each ICD-9 code corre-
Blanket Clusterer: A Tool for Automating the Clustering in Unsupervised Learning
129
sponds to a specific human readable name.
Table 2: Key - Value of names.
Key Value
001 Cholera
004 Shigellosis
... ...
E999 Late effect of injury due to
war operations and terrorism
Similar to the previous dataset, the second dataset,
aside from our Word2Vec model and key-names
dataset, consists of specific names depicting groups
of ICD-9 codes, as shown in Table 3. This dataset
contains information about sets of ICD-9 codes, cor-
responding to a certain group in the ICD-9 naming
scheme.
Table 3: Key - Value of group-names.
Key Value
001-009 Intestinal Infectious Diseases
010-018 Tuberculosis
... ...
E990-E999 Injury Resulting From
Operations Of War
After providing the algorithm with the datasets,
we review the results through the 3D representation
tool which we implement in Blanket Clusterer, and
through the Silhouette score.
4.2 Results
All tests were done with the following parameters
(shown in Table 4):
Table 4: Parameters and values used in test run.
Parameter Value
Number of diagnoses 16,728
Number of clusters in a hierarchy level 19
Number of entities in a cluster 19
Maximum depth of hierarchy 6
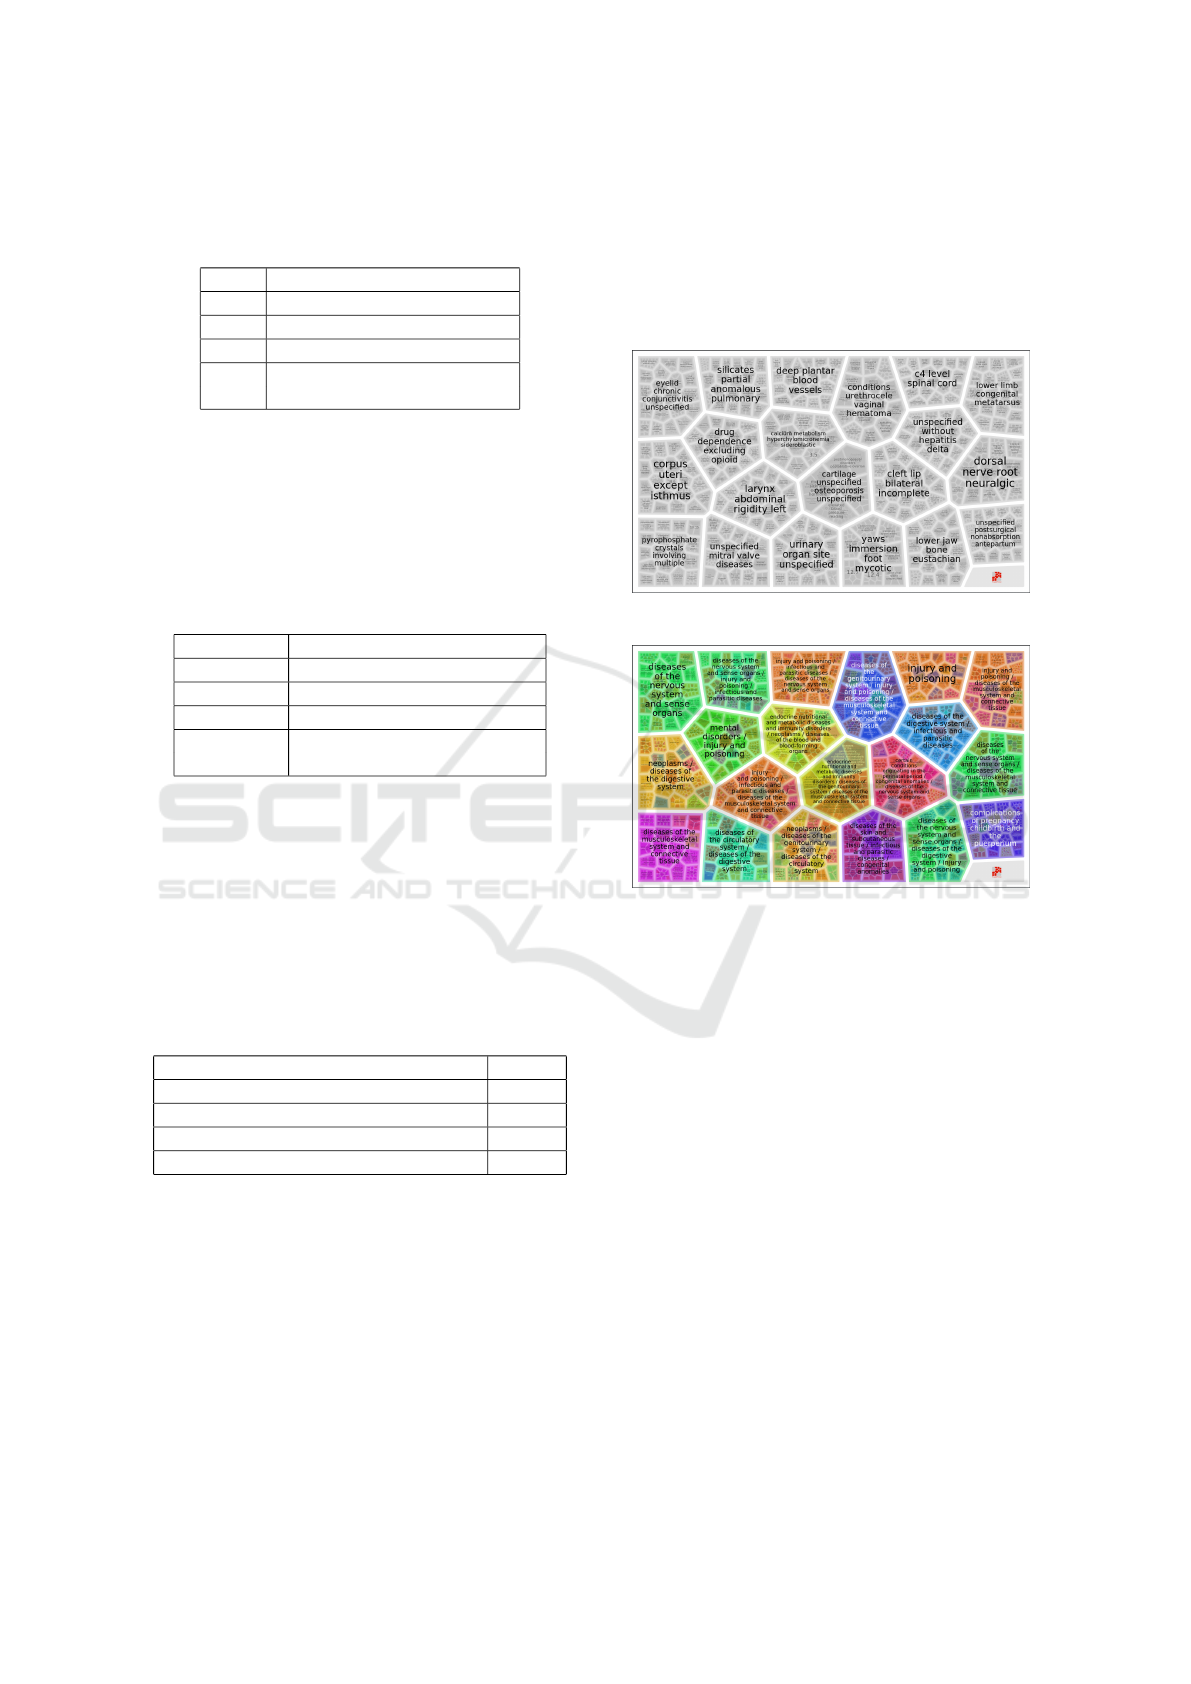
4.2.1 Visualization
As shown in Figure 8 and Figure 9, there is a clear
distinction between the results, regarding the color-
coding of clusters. As previously stated, in the re-
sults shown in Fig. 9, with the test run we provided
a dataset containing the names of groups with codes,
hence each color represents a certain group of ICD-9
codes. Each color represents one specific chapter of
the ICD-9 taxonomy, thus proving that the algorithm
has successfully clustered the diagnoses to a particu-
lar chapter as declared in the ICD-9 taxonomy.
Aside from the color, the names of the main clus-
ters also vary between the figures. Because we have a
custom naming scheme for them. It is easier to under-
stand and validate the results when all features, which
Blanket Clusterer provides, are used.
Figure 8: Visualization without group-names.
Figure 9: Visualization with group-names.
4.2.2 Cross-algorithm Performance
We measured the cross-algorithm performance
through the Silhouette score(Shahapure and Nicholas,
2020), which represents the overall quality of the
clusters in terms of the similarity between the vectors
in each cluster, including the hierarchical groups of
clusters. The score ranges from 0 to 1, where:
• 0 means the elements between the clusters are
similar to one another
• 1 means that the elements between the clusters are
very well separated
Having a higher score, means the clustering algo-
rithm successfully separates the elements into clus-
ters, filled with similar values, while the opposite is a
fact with lower scores.
The Silhouette algorithm, since we have a hi-
erarchical clustering tool, was calculated hierarchi-
cally and comparatively between clusters, meaning
elements belonging to a certain cluster on certain level
in the hierarchy are compared to elements belonging
DeLTA 2022 - 3rd International Conference on Deep Learning Theory and Applications
130
to the other clusters on the same level in the hierarchy.
This score showed that the clusters, although not per-
fect, are close to the groups provided with the ICD-9
standard.
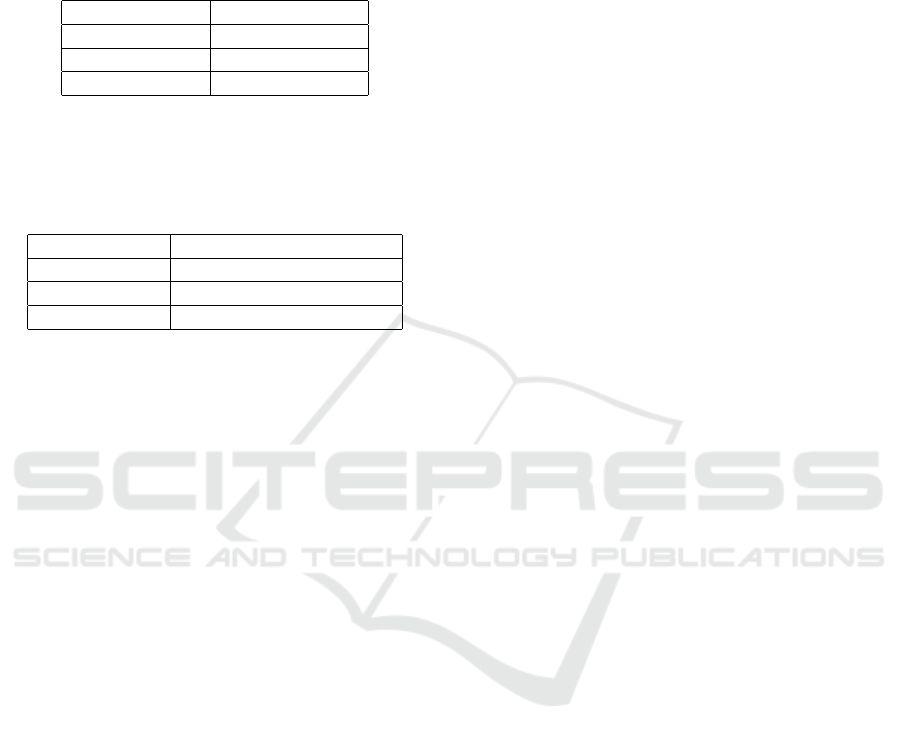
Table 5: Overall Silhouette score by algorithm.
Algorithm Silhouette score
K-Means 0.7151
Birch 0.7059
Agglomerative 0.7257
The amount of clusters generated is shown in Ta-
ble 6, and for each algorithm, the average Silhouette
score is depicted by Table 5.
Table 6: Total number of clusters.
Algorithm Total number of clusters
K-Means 2200
Birch 1895
Agglomerative 2160
As shown by our tests, Agglomerative clustering
outperforms the other algorithms, K-Means by 1%,
while Birch by 2%. As previously stated, even though
DBSCAN can be used in the algorithm, the hierarchi-
cal aspect could not be used, due to it’s implementa-
tion. Ergo, this clustering algorithm is not part of the
research.
5 CONCLUSION
This paper presents a novel tool named Blanket Clus-
terer, which unifies the most widely used cluster-
ing techniques in Machine Learning and facilitates
their application to various numeric representations of
texts, sounds, and videos. We successfully validated
Blanket Clusterer by a dataset comprised of ICD-9 de-
scriptions. The tool proved its efficiency in applying
different clustering methods to the dataset and provid-
ing a detailed report. Furthermore, Blanket Clusterer
provides a valuable interpretation of the best cluster-
ing results through a three-dimensional visualization
plot. In our specific use-case, the Agglomerative clus-
tering offers the best results, compared to the other
algorithms, with a higher Silhouette score than the
rest, with a value of 0.7257. This research proves that
Blanket Clusterer is a valuable tool for measuring the
efficiency of clustering algorithms on a specific task.
Lastly, the code and its interfaces are publicly avail-
able and open-sourced, thus incentivizing researchers
to further enhance and expand its functionalities.
REFERENCES
Abdulhafedh, A. (2021). Incorporating k-means, hierarchi-
cal clustering and pca in customer segmentation. Jour-
nal of City and Development, 3(1):12–30.
Bhardwaj, K. K., Banyal, S., and Sharma, D. K. (2019).
Chapter 7 - artificial intelligence based diagnostics,
therapeutics and applications in biomedical engineer-
ing and bioinformatics. In Balas, V. E., Son, L. H.,
Jha, S., Khari, M., and Kumar, R., editors, Internet
of Things in Biomedical Engineering, pages 161–187.
Academic Press.
Chami, I., Gu, A., Chatziafratis, V., and R
´
e, C. (2020).
From trees to continuous embeddings and back: Hy-
perbolic hierarchical clustering. 33:15065–15076.
Dasgupta, S. (2016). A cost function for similarity-based
hierarchical clustering. pages 118–127.
Farjo, J., Abou Assi, R., Masri, W., and Zaraket, F. (2013).
Does principal component analysis improve cluster-
based analysis? pages 400–403. IEEE.
Gao, Z., Lin, H., Tan, C., Wu, L., Li, S., et al. (2021). Git:
Clustering based on graph of intensity topology. arXiv
preprint arXiv:2110.01274.
Glielmo, A., Husic, B. E., Rodriguez, A., Clementi, C.,
No
´
e, F., and Laio, A. (2021). Unsupervised learning
methods for molecular simulation data. Chemical Re-
views, 121(16):9722–9758.
Govender, P. and Sivakumar, V. (2020). Application of k-
means and hierarchical clustering techniques for anal-
ysis of air pollution: A review (1980–2019). Atmo-
spheric Pollution Research, 11(1):40–56.
He, X., Zhao, K., and Chu, X. (2021). Automl: A sur-
vey of the state-of-the-art. Knowledge-Based Systems,
212:106622.
Jafarzadegan, M., Safi-Esfahani, F., and Beheshti, Z.
(2019). Combining hierarchical clustering approaches
using the pca method. Expert Systems with Applica-
tions, 137:1–10.
Jian, A. K. (2009). Data clustering: 50 years beyond k-
means, pattern recognition letters. Corrected Proof.
Shahapure, K. R. and Nicholas, C. (2020). Cluster quality
analysis using silhouette score. pages 747–748. IEEE.
Surono, S. and Putri, R. D. A. (2021). Optimization of
fuzzy c-means clustering algorithm with combination
of minkowski and chebyshev distance using principal
component analysis. International Journal of Fuzzy
Systems, 23(1):139–144.
Tan, M., Pang, R., and Le, Q. V. (2020). Efficientdet:
Scalable and efficient object detection. pages 10781–
10790.
Zeng, K., Ning, M., Wang, Y., and Guo, Y. (2020). Hier-
archical clustering with hard-batch triplet loss for per-
son re-identification. pages 13657–13665.
Blanket Clusterer: A Tool for Automating the Clustering in Unsupervised Learning
131
