
Generation and Quality Evaluation of a 360-degree View from Dual
Fisheye Images
Mar
´
ıa Flores
1 a
, David Valiente
2 b
, Juan Jos
´
e Cabrera
1 c
, Oscar Reinoso
1 d
and Luis Pay
´
a
1 e
1
Department of Systems Engineering and Automation, Miguel Hernandez University, Elche, Spain
2
Department of Communications Engineering, Miguel Hernandez University, Elche, Spain
{m.flores, dvaliente, juan.cabreram, o.reinoso, lpaya}@umh.es
Keywords:
Dual Fisheye Images, 360-degree View, Stitching Process.
Abstract:
360-degree views are beneficial in robotic tasks because they provide a compact view of the whole scenario.
Among the different vision systems to generate this image, we use a back-to-back pair of fisheye lens cam-
eras by Garmin (VIRB 360). The objectives of this work are twofold: generating a high-quality 360-degree
view using different algorithms and performing an analytic evaluation. To provide a consistent evaluation and
comparison of algorithms, we propose an automatic method that determines the similarity of the overlapping
area of the generated views as regards a reference image, in terms of a global descriptor. These descriptors are
obtained from one of the Convolutional Neural Network layers. As a result, the study reveals that an accurate
stitching process can be achieved when a high number of feature points are detected and uniformly distributed
in the overlapping area. In this case, the 360-degree view generated by the algorithm which employs the cam-
era model provides more efficient stitching than the algorithm which considers the angular fisheye projection.
This outcome demonstrates the wrong effects of the fisheye projection, which presents high distortion in the
top and bottom parts. Likewise, both algorithms have been also compared with the view generated by the
camera.
1 INTRODUCTION
In recent years, 360-degree imaging systems have be-
come increasingly popular in the fields of computer
vision and robotics. Their ability to provide a view of
the whole scenario by means of a single shot is very
useful in mobile robot navigation tasks such as visual
localization and mapping (Cebollada et al., 2019; Ji
et al., 2020; Flores et al., 2022).
There are different vision system configurations
for generating panoramic images or videos (Scara-
muzza, 2014). For instance, the catadioptric cameras
are the result of combining a standard camera with a
convex shaped mirror (Rom
´
an et al., 2022). Other al-
ternative is a vision system which incorporates multi-
ple cameras combined with ultra-wide field of view
(FOV) or fisheye lenses pointing towards different
directions with overlapping FOVs (Ishikawa et al.,
a
https://orcid.org/0000-0003-1117-0868
b
https://orcid.org/0000-0002-2245-0542
c
https://orcid.org/0000-0002-7141-7802
d
https://orcid.org/0000-0002-1065-8944
e
https://orcid.org/0000-0002-3045-4316
2018). The images provided by each camera in this
configuration should be stitched together in order to
obtain a 360-degree view. Given that fisheye lenses
have hemispherical FOV, only a pair of back-to-back
fisheye lens cameras are needed to obtain full spher-
ical panoramas. The fisheye cameras have several
interesting advantages, such as the fact that they are
small, cheap, lightweight, and it is possible to capture
high-quality full-view panorama images, as stated be-
fore. Moreover, the combination of a conventional
projective camera and a fisheye lens provides some
advantages with respect to catadioptric cameras: the
images captured by this vision system do not present
dead areas in the centre of the image (Courbon et al.,
2012) and they can provide a horizontal/vertical field
of view of 360 degrees/180 degrees, respectively (De-
hghan Tezerjani et al., 2015).
In spite of these facts, there are several challenges,
caused by the distortion of the images captured with
such lenses and the usually limited overlapping area
between both images, during the generation of a full
spherical 360x180 deg. panorama from dual-fisheye
cameras. Notwithstanding that, this vision system
configuration is attractive due to the advantages enu-
434
Flores, M., Valiente, D., Cabrera, J., Reinoso, O. and Payá, L.
Generation and Quality Evaluation of a 360-degree View from Dual Fisheye Images.
DOI: 10.5220/0011275900003271
In Proceedings of the 19th International Conference on Informatics in Control, Automation and Robotics (ICINCO 2022), pages 434-442
ISBN: 978-989-758-585-2; ISSN: 2184-2809
Copyright
c
2022 by SCITEPRESS – Science and Technology Publications, Lda. All rights reserved

merated in the previous paragraph.As a matter of fact,
there are different methods proposed in the literature
to generate the optimal 360 degrees image from dual-
fisheye images, that is, minimizing the discontinuities
in the overlapping zone.
For instance, Ho and Budagavi (2017) proposed a
two-step algorithm to align two unwarped fisheye im-
ages: (1) minimize the geometric misalignment by es-
timating an affine matrix and (2) propose to use tem-
plate matching to maximize the similarity in the over-
lapped areas. Upon this work, Ho et al. (2017) pro-
pose an improved method also composed of two steps.
First, they generate interpolation grids to deform the
image based on the rigid moving least squares (MLS)
approach and then, they achieve a refined alignment
consisting of a fast template matching. Lo et al.
(2018) present another method where both images are
stitched using a local mesh warping. This step mini-
mizes a weighted sum of two terms that yields a de-
formed mesh. This way, this term represents the en-
ergy of deforming the mesh to align the features. The
objective of this technique is to preserve the geomet-
ric structure of the scene. Ni et al. (2017) present a
method that consists of firstly a correction of fisheye
lens error. Furthermore, they perform an estimation
of the centre and the radius of the effective area since
it is not at the centre of the fisheye image due to the
radial distortion. Then, to correct the stitching error,
the authors propose finding a rotation matrix through
SVD (Singular Value Decomposition) using the coor-
dinates on the sphere corresponding to a set of SIFT
matching points.
In this paper, a dual-fisheye camera, concretely
the Garmin VIRB 360, is used. The objective of the
present work is twofold. First, to generate a 360-
degree view from the dual-fisheye images. Second,
to automatically evaluate the quality of the result-
ing panorama, focusing on the most challenging area
(overlapping pixels), without need of human super-
vision. Concerning the first objective, we propose
two procedures to unwarp the fisheye images. The
main difference between both methods lies in how
the fisheye image pixels are projected onto the unit
sphere. Regarding the second objective, this paper
proposes two approaches to evaluate the correctness
of the overlapping zone: the first one is based on the
detection of ArUco markers and the second algorithm
is based on a distance between two description vec-
tors obtained from the first fully connected layer of
two VGG16 (Simonyan and Zisserman, 2015) CNN
(Convolutional Neural Network) architectures. This
distance is used to evaluate the quality of the 360-
degree view and study in which situations the algo-
rithms described in this paper generate a high-quality
360-degree view. Then, the inputs to the two net-
works, which compose this algorithm and have the
same architecture and weights, are one part of a 360-
degree view for evaluation, which corresponds to one
of the overlapping regions and the corresponding zone
on a reference image (without stitching effects).
The remainder of the paper is structured as fol-
lows. Section 3 explains the algorithm to generate
the 360-degree panorama and the two methods to un-
warp the fisheye image into equirectangular format.
In this section, the automatic evaluation method for
the stitching process is also explained. In Section 4,
the results of the different experiments are shown. Fi-
nally, Section 5 presents the conclusions and future
works.
2 360-DEGREE VIEW
GENERATION
A full-view panorama can be obtained from a pair of
images captured by a camera composed of two fish-
eye lenses situated back-to-back. Considering how
the environment is projected on a fisheye image, the
stitching algorithm cannot be directly applied to this
type of image that contains severe geometric distor-
tion (Souza et al., 2018). Consequently, a prior step to
unwarp the fisheye image is required. Therefore, the
algorithm to obtain a 360-degree view from dual fish-
eye images can be mainly decomposed into the fol-
lowing stages: mapping to equirectangular projection,
image registration, aligning and blending. In Figure
1, the main steps of this algorithm are shown. The first
stage, whose outputs are the dual equirectangular im-
ages, is thoroughly described in Section 2.1. Since the
centres of the two cameras are displaced, the equirect-
angular images cannot be directly stitched. Therefore,
the next stage consists in calculating the necessary
transformation in such a way that both images are re-
ferred to the same coordinate system. The quality of
image stitching considerably depends on the accuracy
of this stage (Qu et al., 2015).
The method employed in this paper consists in
extracting ORB features (Rublee et al., 2011) from
each equirectangular image, and estimating the affine
transformation matrix which is the output of this
stage. Once one equirectangular image has been reg-
istered with respect to the other image, the next stage
consists in selecting how to optimally blend them in
order to create the final 360-degree panorama mini-
mizing visible seams, blur, and ghosting (Mehta and
Bhirud, 2011). The image blending technique used in
this paper is based on a ramp function (Ho and Buda-
gavi, 2017).
Generation and Quality Evaluation of a 360-degree View from Dual Fisheye Images
435

DUAL FISHEYE
IMAGES
CALCULATE
AFFINE
MATRIX
FIND
MATCHING
FEATURES
APPLY GEOMETRIC
TRANSFORMATION
0 0
1
1
EQUIRECTANGULAR
TRANSFORMATION
BLENDING
360-DEGREES IMAGE
FRONT
REAR
Figure 1: Block diagram corresponding to the generation of a 360-degrees image.
2.1 Mapping to Equirectangular
Projection
As mentioned above, the fisheye images must be un-
warped into an equirectangular map projection before
obtaining the 2D to 2D transformation matrix. This
unwarping consists of a first mapping from the fish-
eye image to the surface of a unit sphere (2D to 3D)
and a second mapping to an equirectangular projec-
tion (3D to 2D).
Focusing on the first mapping, two possible ap-
proaches have been implemented in this paper: (1)
the first one is based on the angular fisheye projection
and (2) the second method employs the sphere camera
model proposed by Scaramuzza et al. (2006).
In the first approach, given a point (u, v) in the
fisheye image, it is normalized and expressed in po-
lar coordinates (r, θ). In the angular fisheye projec-
tion model (Shouzhang and Fengwen, 2011), the ra-
dial distance (r) from the point in the fisheye image
to its centre is directly proportional to the angle (φ)
from the optical axis of the camera to the ray defined
from the camera centre point to the projected point on
the sphere (X, Y, Z). This angle varies from 0 degrees
to the half of the angle of view of the fisheye lens
FOV/2. Therefore, according to the definition of the
angular fisheye projection, the 3D point coordinates
on the sphere corresponding to a fisheye pixel point
(x, y) is given by:
X
Y
Z
=
sinφ cos θ
sinφ sin θ
cosφ
(1)
In the second approach, the 3D vector from the
origin of the camera coordinate system to the pro-
jected point on the sphere, corresponding to a pixel
on the fisheye image (u, v), can be defined as follows:
X
Y
Z
=
u
′
v
′
f (r
′
)
(2)
where f (r
′
) is a polynomial function that depends
on the radial distance r
′
=
√
u
′2
+ v
′2
to the centre
(x
c
, y
c
) and (u
′
, v
′
) is the corresponding point in an
idealized sensor plane, whose coordinates can be cal-
culated by an affine transformation from the point in
the fisheye image (u, v):
u
′
v
′
=
c d
e 1
·
u
v
+
x
c
y
c
(3)
2.2 Automatic Evaluation of Stitching
Process
The objective of the algorithm described in the pre-
vious subsection is to minimize the discontinuity in
the overlapping regions of both equirectangular im-
ages. After observing the algorithm output, we can
determine the quality of the generated 360-degree
panorama. However, it would be interesting that this
process is automatic, without the supervision of a per-
son.
The overlapping region is the most challenging
zone of this type of image; this is the area where
the effects corresponding to the stitching process ap-
pear. Thus, the proposed automatic method only eval-
uates both overlapping areas (corresponding to right
and left sides), each one in an independent way. It
is important to highlight the fact that this method
requires of a reference image to evaluate the stitch-
ing. This reference image (one for each overlapping
zone) should contain the same visual information cor-
responding to this zone but without the associated ef-
fects produced by the stitching process.
As a solution to this, we suggest rotating the cam-
era 90 degrees (keeping it in the same position) to ob-
tain this reference image (ground truth). After doing
it, the scene information which was previously pro-
jected on the overlapping zone (at -90 and 90 degrees
of longitude), is now situated at the middle (at 0 lon-
gitude degrees) and both sides (at -180 and 180 lon-
gitude degrees) of the equirectangular image. This is
graphically represented in Figure 2a, where the up-
per image shows the overlapping areas of the origi-
nal panorama, whose quality must be evaluated. The
bottom image shows the new panorama obtained after
ICINCO 2022 - 19th International Conference on Informatics in Control, Automation and Robotics
436
(a)
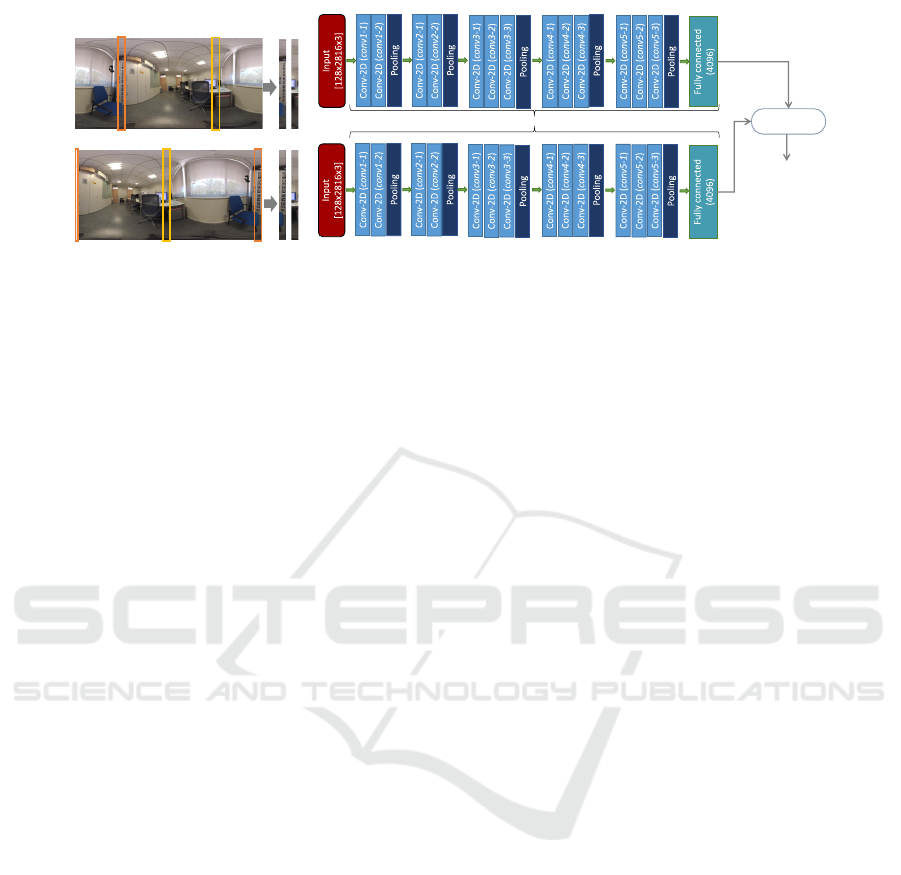
SHARED WEIGHTS
Ԧ
𝑑
0
Ԧ
𝑑
1
𝑑𝑖𝑠𝑡 = (
Ԧ
𝑑
0
,
Ԧ
𝑑
1
)
MEASURE OF
DIFFERENCE
BETWEEN
INPUT IMAGES
(b)
Figure 2: (a) The procedure to obtain the reference image. (b) Algorithm to evaluate the result of the stitching process
(overlapping zone).
rotating the camera 90º and the reference areas, which
does not coincide with the overlapping area. This au-
tomatic evaluation method consists in comparing the
two global appearance descriptors associated to each
overlapping region of the image with each equivalent
region of the reference image. This comparison is
based on the correlation distance measure whereas the
descriptors are obtained through a CNN.
To obtain the descriptor of each area of inter-
est, we use two Convolution Neural Networks, which
share weights. The architecture of both networks is
VGG16 (Simonyan and Zisserman, 2015) which is
composed of 13 convolutional layers, 5 max-pooling
layers, and 3 fully connected layers. Nevertheless, in
this approach we only make use of the convolutional
layers up to the first fully connected layer according to
previous works (Cabrera et al., 2021; Cebollada et al.,
2021), which established this procedure to better de-
scribe images, concentrating on relevant features. On
the contrary, the final layers are useful for classifica-
tion tasks rather than for image description. Then the
output of this first fully connected layer is the descrip-
tor of the input image, whose size is 1 by 4096.
Taking all the above information into account, the
proposed automatic evaluation method consists of the
following steps, which can be visualized in Figure 2b.
Given an interest zone of the generated 360-degree
view, which corresponds to one of the overlapping ar-
eas, and the corresponding zone of the reference im-
age, firstly, their sizes are scaled to 2816x128x3.
After that, each of these two images are input to
each of the two neural networks, obtaining a descrip-
tor for each one, which is the output of the first fully
connected layer. Finally, the correlation distance be-
tween both descriptor vectors can be interpreted as a
measure of the difference between the two input im-
ages, in such a way that the lower its value is, the
better the stitching is.
3 EXPERIMENT RESULTS
3.1 Imaging System
The camera employed in this paper is a Garmin VIRB
360, and its configuration is composed of two fisheye
lenses, each with a FOV of 201.8 degrees, in a back-
to-back position. This camera can capture spheri-
cal 360-degree photos and videos. There are three
lens modes to configure the camera: 360, RAW and
Front/Rear Only. The mode determines which lens or
lenses the camera uses and the field of view size. If
the 360 lens mode is selected, the camera provides a
spherical 360-degree panorama using both lenses. In
this case, the camera performs the stitching automat-
ically from the two lenses into one 360-degree view
using an algorithm that the manufacturer incorporates
into the camera. On the contrary, if the camera is set
with the RAW lens mode, it captures separate 200-
degree hemispherical images from each lens, whose
dimensions are 3000x3008 pixels. Finally, with the
last option, the camera captures images with only one
lens.
3.2 Dataset
To test the validity of the methods proposed in the
present work, a dataset with different kind of images
is needed. Therefore, we define a set of positions
on the floor plane in a variety of environments and
capture three types of images from these positions:
(1) two spherical images captured by the front and
the back fisheye lens simultaneously (Figure 3a and
Figure 3b), (2) an equirectangular image (Stitched-In-
Camera) (Figure 3c), and (3) a equirectangular image
rotating the camera 90 degrees at the same position
(Figure 3d).
Generation and Quality Evaluation of a 360-degree View from Dual Fisheye Images
437
The image dataset employed in this paper to evalu-
ate the 360-degree views contains these three types of
images captured from 32 different positions in two of
office-like and laboratory scenarios. Therefore, tak-
ing into account that the first type contains two im-
ages, the dataset is composed of a total of 128 images.
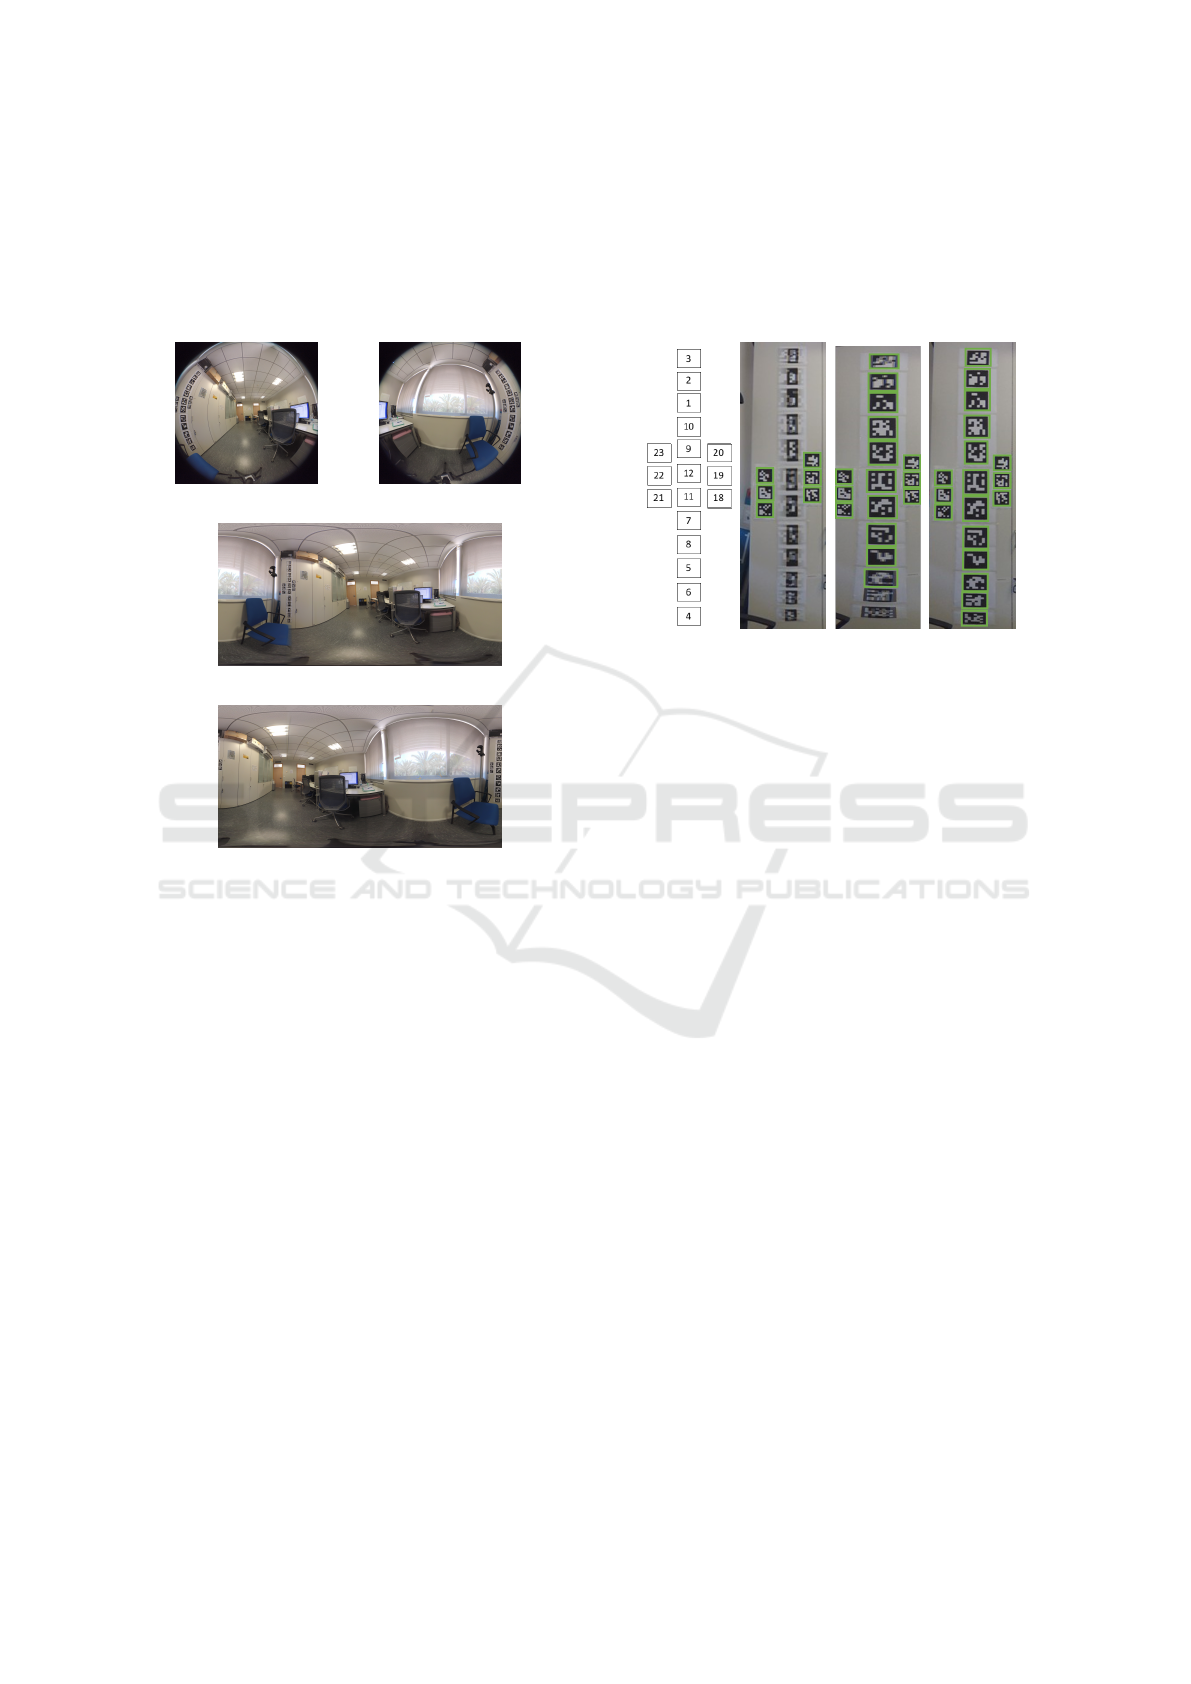
(a) (b)
(c)
(d)
Figure 3: Types of images provided by Garmin VIRB 360:
(a) and (b) dual fisheye images, front and back respectively;
(b) 360-degree view; and (c) 360-degree view provided by
Garmin VIRB 360 rotated 90 degrees.
3.3 Initial Experiment
As an initial evaluation, the camera has been posi-
tioned so that several ArUco markers with different
identifiers are captured in the overlapping zone. The
identifiers of these markers and how they are dis-
tributed can be seen in Figure 4a. In addition, the
camera has been set to obtain the dual-fisheye images
and the equirectangular image provided by its own
firmware.
Initially, the 360-degree view has been obtained
from the dual fisheye images employing the two
methods that are proposed in Section 2.1. After-
wards, a detection process was carried out, intend-
ing to know how many ArUco markers were recog-
nized. The higher this number is, the better is the
final 360-degree view since it means that the dual-
equirectangular images have been correctly aligned in
the area corresponding to these markers.
Figure 4 shows the overlapping region for each
360-degree view. Figure 4b is extracted from the im-
age provided by the camera (VIRB); Figure 4c from
the image generated using the angular fisheye projec-
tion (AFP) (eq. (1)); and Figure 4d by means of the
camera model (CM) (eq. (2) and (3)).
(a) (b) (c) (d)
Figure 4: Results of the initial evaluation: (b) VIRB, (c)
AFP and (d) CM. The ArUco markers detected have been
highlighted in green color.
In the case of the image provided by the camera
(Figure 4b), only six markers have been detected, but
these are not actually in the problematic zone. In the
second image (Figure 4c), as a result of employing the
angular fisheye projection (AFP), sixteen markers are
detected. In this case, the markers that have not been
detected are those that are in the superior and inferior
parts of the image (the poles of the sphere), thus in
the areas with more distortion. Finally, in the third
image (Figure 4d), projecting the pixel points on the
unit sphere by the unified camera model, made that all
the markers are recognized. Considering the results
of this initial experiment, the conclusion is that better
stitching is obtained through the camera model (in-
trinsic parameters) and, by contrast, the worst stitch-
ing is provided by the firmware of the camera.
However, it is not enough to determine that the
equirectangular image has been improved with the
proposed methods, since they are based on local fea-
tures to calculate the transformation matrix and most
of them are associated with these ArUco markers.
Likewise, this situation may not be general, and it is
necessary to study other cases in which the overlap-
ping area is not rich in details. Thus, an additional
evaluation method has been employed. Although with
this experiment we have an initial conclusion, the fol-
lowing evaluation method permits studying its perfor-
mance with larger number of images captured from
different scenarios.
ICINCO 2022 - 19th International Conference on Informatics in Control, Automation and Robotics
438
3.4 Evaluation
As mentioned at the beginning of this section, this
paper proposes an automatic evaluation of the 360-
degree views, described Section 2.2, which is focused
on the overlapping area. This algorithm has been ap-
plied for each overlapping zone (right and left) corre-
sponding to the pair of the reference image and each
type of 360-degree view: (1) generated employing the
camera model (CM) (eq. (2) and (3)); (2) provided by
the camera (VIRB) and (3) generated by means of the
angular fisheye projection (AFP) (eq. (1)). The re-
sults are shown and studied based on different aspects
in this section.
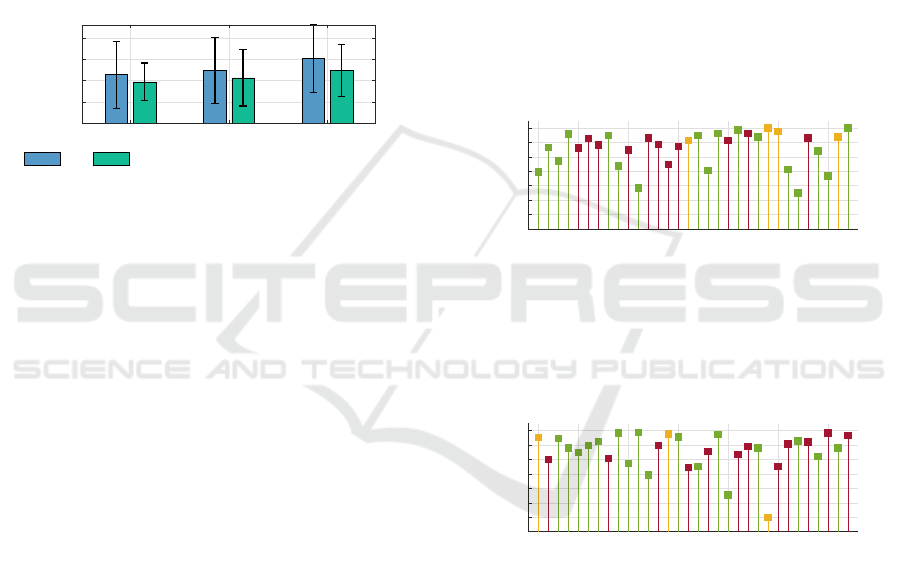
Comparison
CM VIRB AFP
360 image
0
0.025
0.05
0.075
0.1
Distance measure
Left Right
Figure 5: The mean value of the distance between descrip-
tors for each 360-degree view.
Figure 5 shows the mean of the distance between
descriptors obtained with this evaluation method for
each type of 360-degree view as well as the overlap-
ping zone. After observing Figure 5, the conclusion
is that the worst results have been achieved for the
third 360-degree view, which was generated by us-
ing the angular fisheye projection model (AFP). This
was initially expected since this approach is based on
global appearance information. In other words, the
description vector describes the whole image. Any-
way, this not implies a issue, provided that the images
to compare have similar features. However, as Figure
4 shows, the projection of the image calculated by the
camera and the generated by the camera model (CM)
are similar. By contrast, this fact does not occur with
the panorama generated by means of the angular fish-
eye projection (AFP). The input of the automatic eval-
uation approach is a pair of images of the same size.
Even so, as a consequence of this difference for the
angular fisheye projection (scale), the image associ-
ated with this generated 360-degree view (AFP) con-
tains less visual information from the reference im-
age, considering that it was captured by the camera.
Then, when calculating the distance between images,
the image calculated with the proposed method will
be at a disadvantage unless the areas of the two other
images are more different from the reference due to a
significant incorrect alignment.
Focusing on the values, the lowest distance mea-
sure has been obtained with the camera model (CM)
and on the right overlapping zone.
In the following figures, different features are
shown for each image. To begin with, Figure 6 and
Figure 7 show the ratio between the lowest and the
second lowest correlation distance. To calculate this
ratio, in the case of Figure 6, for every position (the
indices of the positions are shown in the horizontal
axis), the distances between the left overlapping area
of the (a) VIRB, (b) CM and (c) AFP panoramas and
the corresponding area of the reference panorama are
calculated. The lowest and the second lowest dis-
tances are retained and the quotient between them is
calculated. Figure 7 shows the same results but us-
ing the right overlapping areas. In addition to this, the
most similar type of 360-degree view is marked with
a different color: (a) red for the camera (VIRB), (b)
green for the camera model (CM) and (c) yellow for
the angular fisheye projection (AFP).
1 5 10 15 20 25 30
Index of image
0.4
0.5
0.6
0.7
0.8
0.9
1
Ratio
Ratio (Left)
Figure 6: Ratio of the lowest distance between the left over-
lapping area and the reference area over the second lowest
distance between the left overlapping area and the reference
area. CM ■, VIRB ■ and AFP ■.
1 5 10 15 20 25 30
Index of image
0.4
0.5
0.6
0.7
0.8
0.9
1
Ratio
Ratio (Right)
Figure 7: Ratio of the lowest distance between the right
overlapping area and the reference area over the second
lowest distance between the right overlapping area and the
reference area. CM ■, VIRB ■ and AFP ■.
Analyzing both figures, we can state that the most
similar and, as a consequence, the best alignment
has been achieved more times with the camera model
(CM). A significant aspect is that in both, Figure 6
as in Figure 7, the method based on the angular fish-
eye projection (AFP) provides the best ratio only a
few times. Besides, the lowest ratio values have been
obtained with the equirectangular projection based on
the camera model (CM). In these cases, the difference
with the second-best image is considerable.
Generation and Quality Evaluation of a 360-degree View from Dual Fisheye Images
439
0.4
0.6
0.8
1
1.2
1.4
1.6
1.8
2
ratio
Camera model (Left)
1 5 10 15 20 25 30
Index of image
0
250
500
750
1000
1250
1500
Number of points
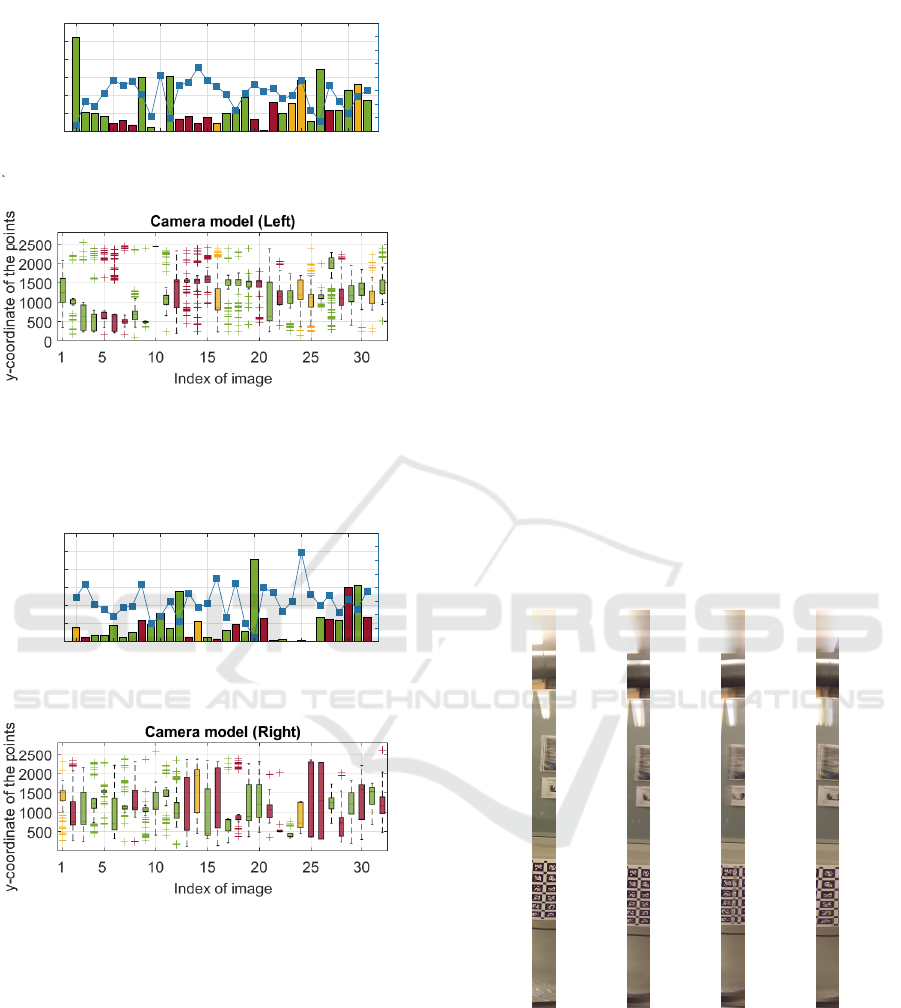
(a)
(b)
Figure 8: For each 360-degree view employing the camera
model in the left overlapping zone, (a) the number of match-
ing features and (b) their distribution along the vertical axis
of the image. CM ■, VIRB ■ and AFP ■.
0.4
0.6
0.8
1
1.2
1.4
1.6
1.8
2
ratio
Camera model (Right)
1 5 10 15 20 25 30
Index of image
0
250
500
750
1000
1250
1500
Number of points
(a)
(b)
Figure 9: For each 360-degree view employing the cam-
era model in the right overlapping zone, (a) the number of
matching features and (b) their distribution along the verti-
cal axis of the image. CM ■, VIRB ■ and AFP ■.
Figure 8 and Figure 9 are related to the 360-degree
view employing the camera model (CM), each for an
overlapping region. Figure 8a shows in the left y-axis,
through bars, the number of points used to estimate
the transformation between both equirectangular im-
ages. Besides, the color of the bar indicates the type
of 360-degree view with the lowest correlation dis-
tance. The right y-axis represents the ratio between
the distance obtained for this type of 360-image and
the distance returned for the camera image. In Figure
8b, boxplots are employed to represent the distribu-
tion of the points represented in Figure 8a along the
vertical axis of the image.
Concerning the number of points, we can high-
light that the generation of the 360-degree view em-
ploying the camera model is good when the over-
lapping zone is rich in visual information, that is, a
high number of matching features are found. In these
cases, the ratio is lower, and it implies a consider-
able difference regarding the distance measure with
the image provided by the camera. Therefore, this al-
gorithm improves the 360-degree view if the number
of features is high enough. It can be observed in some
images, such as in the one captured from position in-
dex 27-th (Figure 10). Analyzing both plots of Figure
8, the worst case is associated with the images corre-
sponding to position index 10-th, where the number
of matching points is low, and they are not distributed
along the vertical axis of the image but they are con-
centrated in the top part of the image (north pole).
As Figure 11 shows, in these cases, where the over-
lapping zone captures a door or wall (poor in visual
information) and there is a uniform region (without
shear, only shift as it occurs in the camera image) the
incorrect alignment is not perceptible.
(a) (b) (c) (d)
Figure 10: 360-degree views associated to the 27-th index:
(a) reference, (b) CM, (c) VIRB and (d) AFP.
In Figure 9, we can observe the same facts. If we
study jointly both overlapping zones (Figure 8 and
Figure 9), that is, the 360-degree view as a whole,
when more matching features have been found in an
overlapping zone than in the other, the ratio is good
for the first zone and poor for the second zone. For
ICINCO 2022 - 19th International Conference on Informatics in Control, Automation and Robotics
440
instance, it can be seen in the results related to the
27-th index image.
(a) (b) (c) (d)
Figure 11: 360-degree views associated to the 10-th index:
(a) reference, (b) CM, (c) VIRB and (d) AFP.
4 CONCLUSIONS
One of the purposes of this paper is to generate the
360-degree view from the dual fisheye images taken
by a Garmin VIRB 360 camera. This camera can be
set to provide an image of this type. However, some-
times the stitching performed by the camera is incor-
rect, which can produce errors when these images are
used in several robotic tasks, such as solving the lo-
calization problem. Therefore, this paper studies and
evaluates two algorithms to obtain a 360-degree view
from the two RAW images as captured by each of the
fisheye cameras. The main difference between both
methods is the model employed to map from the fish-
eye image to the unit sphere, in the first stage of the
algorithm: employing the camera model proposed by
Scaramuzza et al. (2006) or through the angular fish-
eye projection.
The evaluation of the quality of a 360-degree view
obtained from dual fisheye images is focused on the
overlapping zones since it is where the fusion between
both images occurs so if the transformation between
them is not accurate, the change from one image to
another will be noticeable in these zones. In other
words, the effects associated with an incorrect stitch-
ing process (blur, ghosting, artifacts, etc.) appear
there. This evaluation is usually performed in a vi-
sual manner, even so a method to obtain an analytic
evaluation is proposed in this paper. Taking it into ac-
count, the other purpose of this paper is to evaluate
and then to study the quality of the overlapping zones
of the 360-degree view. To that end, two experiments
have been carried out in this work. The first one is
based on the detection of ArUco markers. This initial
experiment concludes that the most accurate stitch-
ing has been obtained with the 360-degree view as a
consequence of employing the camera model. In this
case, all markers have been recognized. Although not
so many marks have been detected for the image ob-
tained by the angular fisheye projection, the result is
also good, whereas the worst result has been produced
by the image provided by the camera.
The second experiment is more exhaustive and
the evaluation is based on the distance between two
descriptor vectors extracted from the first fully con-
nected layer of VGG16 architecture.
As for this proposed automatic method, we have
observed that it is a suitable solution. However, con-
sidering that the camera has taken the reference im-
age and this method is based on a global appearance
similarity measure, for similar 360-degree views, this
method benefits the provided by the camera (VIRB) if
we use this measure to compare the three types of im-
ages (VIRB, CM, AFP). On the contrary, it sometimes
puts the 360-degree view generated using the angular
fisheye projection (AFP) at a disadvantage since the
behaviour of this equirectangular image is different to
the other two images with which it is compared.
Concerning the analytic evaluation and compari-
son of the three different 360-degree views, the pro-
posed algorithms generate a high-quality image when
the overlapping area is rich in visual information. In
other words, the stitching is more accurate when a
huge amount of feature points are detected and they
are uniformly distributed in the overlapping zone. We
can relate this conclusion with the results achieved in
the initial experiment, given that this fact occurs in the
images used in that experiment.
As future work, we propose finding an alternative
of the reference image, which is more general and
that, in this way, none of the images is benefited in
the comparison. Furthermore, we will try to improve
the proposed algorithms to obtain a high-quality 360-
degree view even if the overlapping area is poor in
visual information.
ACKNOWLEDGEMENTS
This work is part of the project PID2020-116418RB-
I00 funded by MCIN/AEI/10.13039/501100011033,
of the project PROMETEO/2021/075 funded by Gen-
eralitat Valenciana, and of the grant ACIF/2020/141
Generation and Quality Evaluation of a 360-degree View from Dual Fisheye Images
441

funded by Generalitat Valenciana and Fondo Social
Europeo (FSE).
REFERENCES
Cabrera, J., Cebollada, S., Pay
´
a, L., Flores, M., and
Reinoso, O. (2021). A Robust CNN Training Ap-
proach to Address Hierarchical Localization with Om-
nidirectional Images:. In Proceedings of the 18th
International Conference on Informatics in Control,
Automation and Robotics, pages 301–310, Online
Streaming. SCITEPRESS.
Cebollada, S., Pay
´
a, L., Jiang, X., and Reinoso, O. (2021).
Development and use of a convolutional neural net-
work for hierarchical appearance-based localization.
Artificial Intelligence Review.
Cebollada, S., Pay
´
a, L., Mayol, W., and Reinoso, O. (2019).
Evaluation of Clustering Methods in Compression of
Topological Models and Visual Place Recognition Us-
ing Global Appearance Descriptors. Applied Sciences,
9(3):377.
Courbon, J., Mezouar, Y., and Martinet, P. (2012). Evalu-
ation of the Unified Model of the Sphere for Fisheye
Cameras in Robotic Applications. Advanced Robotics,
26(8-9):947–967.
Dehghan Tezerjani, A., Mehrandezh, M., and Paranjape,
R. (2015). Optimal Spatial Resolution of Omnidi-
rectional Imaging Systems for Pipe Inspection Appli-
cations. International Journal of Optomechatronics,
9(4):261–294.
Flores, M., Valiente, D., Gil, A., Reinoso, O., and Pay
´
a, L.
(2022). Efficient probability-oriented feature match-
ing using wide field-of-view imaging. Engineering
Applications of Artificial Intelligence, 107:104539.
Ho, T. and Budagavi, M. (2017). Dual-fisheye lens stitching
for 360-degree imaging. In 2017 IEEE International
Conference on Acoustics, Speech and Signal Process-
ing (ICASSP), pages 2172–2176, New Orleans, LA.
IEEE.
Ho, T., Schizas, I. D., Rao, K. R., and Budagavi, M. (2017).
360-degree video stitching for dual-fisheye lens cam-
eras based on rigid moving least squares. In 2017
IEEE International Conference on Image Processing
(ICIP), pages 51–55, Beijing. IEEE.
Ishikawa, R., Oishi, T., and Ikeuchi, K. (2018). LiDAR
and Camera Calibration Using Motions Estimated by
Sensor Fusion Odometry. In 2018 IEEE/RSJ Interna-
tional Conference on Intelligent Robots and Systems
(IROS), pages 7342–7349. ISSN: 2153-0866.
Ji, S., Qin, Z., Shan, J., and Lu, M. (2020). Panoramic
SLAM from a multiple fisheye camera rig. IS-
PRS Journal of Photogrammetry and Remote Sensing,
159:169–183.
Lo, I.-C., Shih, K.-T., and Chen, H. H. (2018). Image Stitch-
ing for Dual Fisheye Cameras. In 2018 25th IEEE In-
ternational Conference on Image Processing (ICIP),
pages 3164–3168, Athens. IEEE.
Mehta, J. D. and Bhirud, S. G. (2011). Image stitching tech-
niques. In Pise, S. J., editor, Thinkquest˜2010, pages
74–80. Springer India, New Delhi.
Ni, G., Chen, X., Zhu, Y., and He, L. (2017). Dual-fisheye
lens stitching and error correction. In 2017 10th In-
ternational Congress on Image and Signal Process-
ing, BioMedical Engineering and Informatics (CISP-
BMEI), pages 1–6, Shanghai. IEEE.
Qu, Z., Lin, S.-P., Ju, F.-R., and Liu, L. (2015). The
Improved Algorithm of Fast Panorama Stitching for
Image Sequence and Reducing the Distortion Errors.
Mathematical Problems in Engineering, 2015:1–12.
Rom
´
an, V., Pay
´
a, L., Cebollada, S., Peidr
´
o, A., and
Reinoso, O. (2022). Evaluating the Robustness of
New Holistic Description Methods in Position Esti-
mation of Mobile Robots. In Gusikhin, O., Madani,
K., and Zaytoon, J., editors, Informatics in Control,
Automation and Robotics, volume 793, pages 207–
225. Springer International Publishing, Cham.
Rublee, E., Rabaud, V., Konolige, K., and Bradski, G.
(2011). ORB: An efficient alternative to SIFT or
SURF. In 2011 International Conference on Com-
puter Vision, pages 2564–2571. ISSN: 2380-7504.
Scaramuzza, D. (2014). Omnidirectional Camera. In
Ikeuchi, K., editor, Computer Vision, pages 552–560.
Springer US, Boston, MA.
Scaramuzza, D., Martinelli, A., and Siegwart, R. (2006). A
Toolbox for Easily Calibrating Omnidirectional Cam-
eras. In 2006 IEEE/RSJ International Conference
on Intelligent Robots and Systems, pages 5695–5701.
ISSN: 2153-0866.
Shouzhang, X. and Fengwen, W. (2011). Generation of
Panoramic View from 360 Degree Fisheye Images
Based on Angular Fisheye Projection. In 2011 10th
International Symposium on Distributed Computing
and Applications to Business, Engineering and Sci-
ence, pages 187–191.
Simonyan, K. and Zisserman, A. (2015). Very Deep Con-
volutional Networks for Large-Scale Image Recogni-
tion. arXiv:1409.1556 [cs]. arXiv: 1409.1556.
Souza, T., Roberto, R., Silva do Monte Lima, J. P., Te-
ichrieb, V., Quintino, J. P., da Silva, F. Q., Santos,
A. L., and Pinho, H. (2018). 360 Stitching from Dual-
Fisheye Cameras Based on Feature Cluster Match-
ing. In 2018 31st SIBGRAPI Conference on Graph-
ics, Patterns and Images (SIBGRAPI), pages 313–320,
Parana. IEEE.
ICINCO 2022 - 19th International Conference on Informatics in Control, Automation and Robotics
442
