
A Novel Real-Time Wear Detection System for the Secondary Circuit
of Resistance Welding Guns
D. Ibáñez
1a
, E. García
2b
, J. Martos
1c
and J. Soret
1d
1
Dept. of Electrical and Electronic Engineering, University of Valencia, Burjassot, Valencia, Spain
2
Ford Valencia, 46440, Valencia, Spain
Keywords: Resistance Spot Welding, Predictive Maintenance, Secondary Circuit, Welding Gun.
Abstract: Currently, many resources are invested in high-production automotive factories to correct quality defects
caused in the bodywork due to secondary circuit wear. In the same way, energy losses are generated due to
the increase in resistance caused by secondary wear, thus reducing efficiency and increasing the final cost of
the product. This happens because, at present, there is no method that allows the predictive detection of
problems in the secondary and the arms of the welding gun. Consequently, a solution must be developed to
carry out predictive maintenance applicable to the automotive industry to detect this defect. This research
provides an answer by proposing a method to detect variations in the state of the secondary of the welding
gun using existing data in the welding process, specifically, the evolution of the angle of degassing of the
IGBTs of the welding control. To validate the relationship between the control shift angle and the increase in
wear, an electronic simulation software was used to simulate the behaviour of the real welding control.
1 INTRODUCTION
The resistance welding process is one of the most
widely used in the automotive industry for joining the
metal parts of the bodywork, representing around
90% of all welded joints in a bodywork (Koskimäki
et al., 2007; Yu et al., 2014; Hwang et al., 2013). As
the name of the process indicates, it is the resistance
to the current flow of the metals to be welded that
causes the localized increase in heat and the
formation of the nugget welding. For this process, it
is also necessary to exert pressure on the parts to be
welded for a specific welding time. Ultimately,
therefore, welding is generated by a combination of
heat, pressure, and time.
Despite being able to summarize the resistance
welding process as the combination of heat, pressure
and time, this process is highly complex, since it
involves different fields of study such as
electromagnetism, electronics, thermodynamics,
materials and mechanics. (Li et al., 2007)
a
https://orcid.org/0000-0002-3917-9875
b
https://orcid.org/0000-0002-4210-9835
c
https://orcid.org/0000-0002-8455-6369
d
https://orcid.org/0000-0001-8695-6334
Throughout different investigations, it has been
described how the different welding parameters can
influence the quality of the welded joint, such as
pressure (Zhou et al., 2014; Sun et al., 2007; Ibáñez
et at., 2021 ), the current (Aslanlar et al., 2007;
Hwang et al., 2011), the welding time (Aslanlar et al.,
2008) or the misalignment of the welding electrodes
(Ibañez et al., 2020). From all these studies it can be
concluded that either due to external factors or due to
welding parameters, there are many factors that
directly or indirectly affect the final quality of the
welded joint.
To achieve adequate welding quality, it will
therefore be necessary to guarantee that the
parameters influencing welding quality remain stable
over time. One of the defects that can cause variations
in the application of the correct parameters in
welding, especially in the application of current, is
the mechanical state of the electrical circuit of the
welding gun, specifically, of the secondary circuit of
the gun. , that is, the arms of the welding gun.
Ibáñez, D., García, E., Martos, J. and Soret, J.
A Novel Real-Time Wear Detection System for the Secondary Circuit of Resistance Welding Guns.
DOI: 10.5220/0011274300003271
In Proceedings of the 19th International Conference on Informatics in Control, Automation and Robotics (ICINCO 2022), pages 185-192
ISBN: 978-989-758-585-2; ISSN: 2184-2809
Copyright
c
2022 by SCITEPRESS – Science and Technology Publications, Lda. All rights reserved
185
Over time, the way of applying the current to the
welding points has been changing to achieve the
highest quality with the best possible efficiency and
power consumption. If the behavior of a single-phase
alternating welding machine is observed, it can be
determined that there are inherent losses in the
alternating voltage supply (Zhou et al. 2001). For this
reason and to guarantee the optimum quality of the
welding, three-phase welding machines are used. The
three-phase voltage is rectified to convert it from
single-phase to direct current. This rectified current
results in lower power losses and higher quality
welding (Munesada et al.2010).
In this type of converter-based welding machines,
the three-phase voltage of the industrial mains line,
typically 440V and 50/60Hz, is converted to single-
phase direct voltage and stored in a capacitor bank to
smooth the voltage.
The capacitor bank is connected to the inverter
circuit formed by an IGBTS bridge that modulates the
wave at a higher frequency than the line. Usually, to
achieve higher welding quality and greater control
over the welding current, the wave is modulated at a
frequency of 1000Hz, this type of machine being
known as mid frequency direct current (MFDC).
The alternating wave produced at the output of the
inverter feeds the single-phase transformer of the
welding gun. (Saleem et al. 2011). This will allow to
have a continuous current in the secondary of the
transformer. This working mode prevents the welding
current from having zero crossings that would cool
the part, allowing faster heating of the welding gun.
In addition, by working with direct current, inductive
power losses or problems with the magnetic material
of the machine are avoided (Wei, 2004; Nagasathya
et al 2013,).
In MFDC machines, the secondary voltage is
determined by the primary voltage, which, as
mentioned, is modified by the inverter controlled by
the IGBTS. If a constant IGTS control shift angle is
maintained, the secondary voltage should remain
constant. Starting from this point, it can be stated that
the welding current, according to Ohm's law, will be
determined by the resistance of the secondary, that is,
the resistance of the welding arms and the resistance
of the metal to be welded. As the total resistance of
the secondary circuit increases, the current flowing
between the electrodes decreases (Arslan et al 2020).
This makes it essential to guarantee the maintenance
of the resistance of the welding arms in such a way
that the way in which the current is applied to the
metal to be welded is not affected.
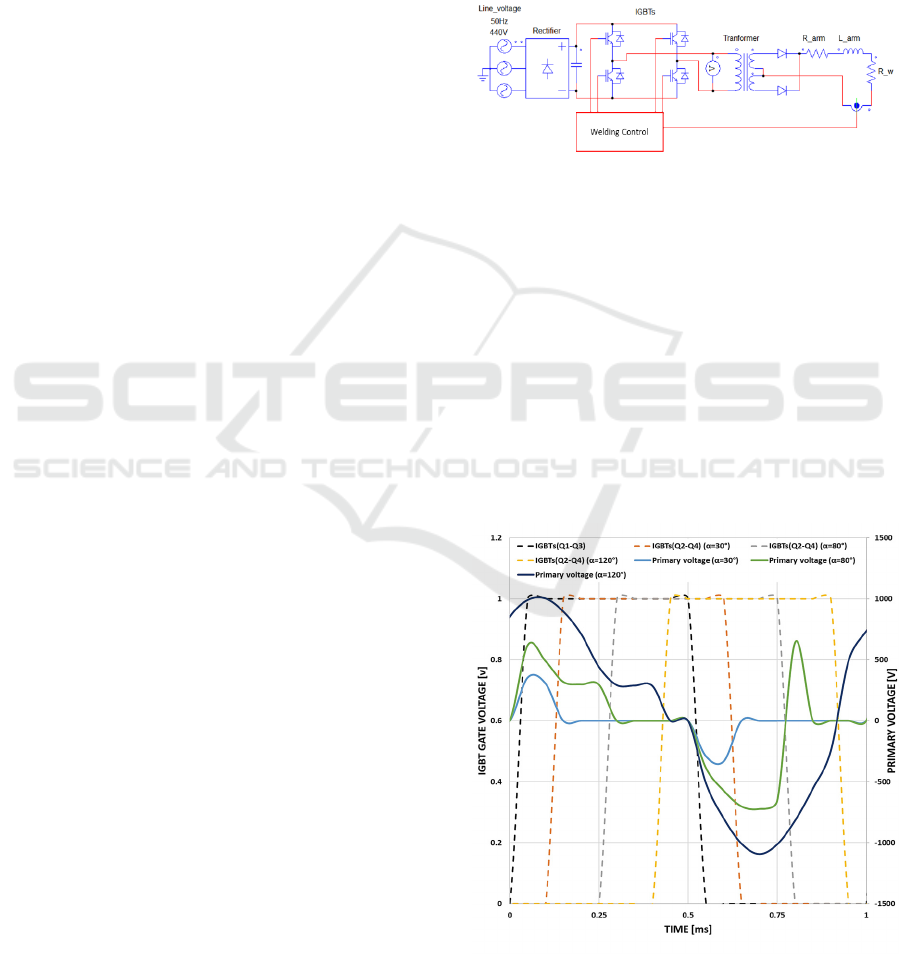
2 MFDC MACHINE AND
SECONDARY LOAD
The welding current is a fundamental component to
chieve optimal welding quality. In the electronic
diagram of Figure 1, the stages of the power circuit
can be observed differently from the three-phase line
of the electrical network to the continuous single-
phase line of the welding electrodes.
Figure 1: Welding machine electrical schematic.
Modern welding machines have a current control
system, in such a way that it is guaranteed that the
current established by parameters is being applied to
the metal to be welded. The welding machine
analyzes the secondary current every millisecond and
modifies the control shift angle of the IGBTs firing to
modify the primary voltage, as it can be seen in the
results obtained from the simulation in figure 2 for the
different angle s of shot (α=30°, α=80° and α=105°).
As the control angle between the control signals of
the IGBTs increases, the effective primary voltage
decreases, thus decreasing the secondary voltage and
current (Zhou & Cai,2014).
Figure 2: Response of the primary voltage as a function of
the control shift angle of the IGBTS.
ICINCO 2022 - 19th International Conference on Informatics in Control, Automation and Robotics
186
From Figures 1 and 3, the behavior of the IGBT
rectifier can be divided into six segments in one
period. These six segments can be summarized as:
• State 1: In this state, the IBTS Q1 and Q4 are
conductive, therefore it is in active mode
with positive output voltage and output
current i.e., the DC side power is converted
to the load.
• State 2: At this point Q1 and D3 go on,
freewheeling mode with zero and positive
output voltageoutput current.
• State 3: Diodes D2 and D3 then conduct in
feedback mode with negative and positive
output voltage and output current. Power
from the load is sent back to the DC side.
• State 4: returns to active mode with Q2 and
Q3 conducting with negative output voltage
and output current. The DC side power is
converted to the load. State 5: Return to
freewheeling mode with Q2 and D4
conducting with zero and negative output
voltage and output current.
• State 6. Finally, Q1 and D4 conduct in
feedback mode with positive voltage and
negative output current. Power from the load
is sent back to the DC side.
According to this description, the output voltage
will depend on the period that it is in each of the
states, that is, on the control shift (. Therefore, by
adjusting the control shift, the output voltage can be
adjusted.
The Fourier series of the output voltage can be
obtained as follows:
𝑉
=
4𝑉
𝑛𝜋
sin
𝑛𝛼
2
cos(𝑛𝜔𝑡)
,,…
(1)
Where V
d
represents the output voltage at the
rectifier and α is the control shift.
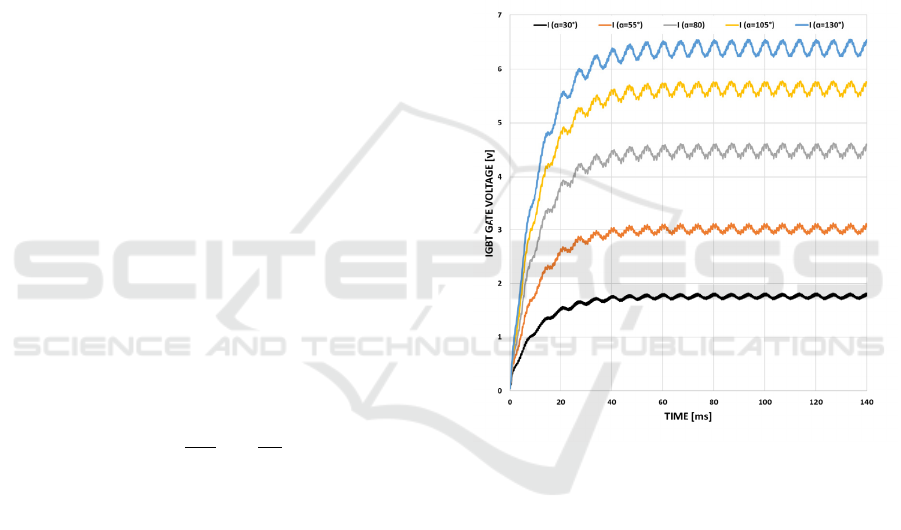
In this way, the secondary voltage can also be
related to the control shift angle of the IGBTs, as the
welding control increases the control shift angle
between the signals, the secondary voltage is reduced.
In a similar way and due to the power conservation
law, the secondary current will also be influenced by
the primary power, therefore, as the control shift
angle between the control signals increases, the
welding current decreases, considering constant
resistance, can be obtained from the simulation figure
3, in which the relationship between the control shift
angle and the final welding current is observed.
Following Ohm's law, the welding current is
determined not only by the secondary voltage but will
also be influenced by the resistance of the secondary
circuit. This resistance of the circuit can be divided
into two blocks: The first load can be defined as those
elements that do not directly participate in welding,
that is, joints between the copper elements of the gun,
cooled braids, welding arms, etc. If the welding gun
is in an optimal state of maintenance, this resistance
should remain constant. In the second load block are
those elements that have an active role in welding,
that is, this resistance is made up of the electrode
holders, the electrodes, the connection between the
electrode and the metal, the resistance of the metal
and the resistance of the union between the metals to
be welded. This resistance will depend on the type of
material, the type of electrodes and the wear of the
electrodes.
Figure 3. Response of the secondary current as a function
of the control shift angle of the IGBTs.
Due to this variability of the welding points and
to guarantee the energy supplied to the joint and
therefore the quality of the joints, the welding
machines regulate the control shift angle of the
IGBTs in such a way that the current supplied does
not depend on resistance, but this will depend solely
on the control of the welding machine.
3 SECONDARY CIRCUIT WEAR
Eventually, mainly due to the erosion caused by the
fatigue of the work cycles of the welding guns, the
secondary circuit begins to show wear. Specifically,
these wears appear in the first block of the load
defined in the previous section.
A Novel Real-Time Wear Detection System for the Secondary Circuit of Resistance Welding Guns
187
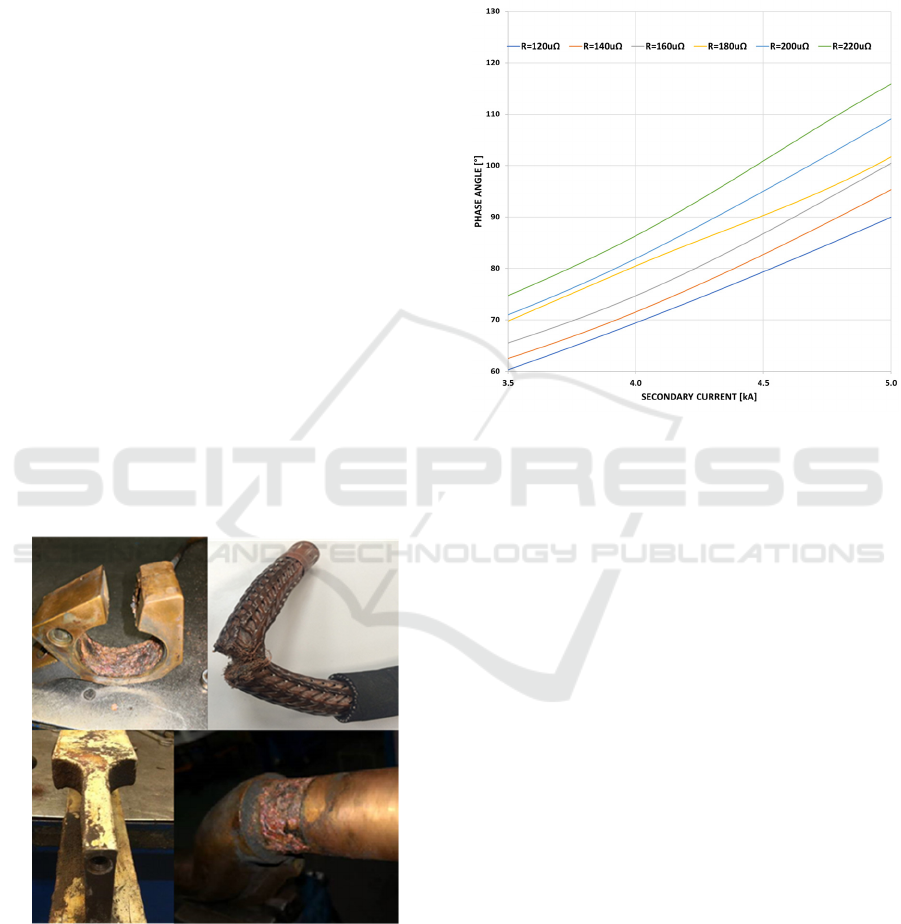
The wear that can appear in the secondary is very
diverse, since, based on the definition of this load
block, it is made up of different components and
joints, as shown in figure 4. The main worn elements
that can occur in a secondary are:
• Corrosion on welding arms caused by water
leaks at welding gun joints or caused by
changing electrodes.
• Transformer pins worn or fired due to poor
cooling or lime scale.
• Cracked arms caused by metal fatigue over
time.
• Clogged refrigerated braids.
• Cracked or missing weld strips.
All these wears contribute notably to the increase
in the resistance of the first load-bearing block. This
first block does not initially have a direct influence on
the weld if the welding machine control can reach the
optimum welding current. However, as these wears
become more noticeable, typical welding problems
begin to appear, such as sparks, inconsistent weld
joints, or even missing welds.
On the other hand, an increase in secondary
resistance means an increase in the power consumed
during welding. If this increase in resistance is caused
by wear, the power supplied to the welding point will
be the same, however, the power consumed during
the process will increase, causing greater energy
consumption.
Figure 4: Real cases of wear in the secondary circuit.
Figure 5 shows the control shift angle necessary
to reach each of the currents. Each of the curves
represents a parasitic resistance value of the
secondary corresponding to the simulated resistance
value of the first block, keeping the second block with
a constant load. In this way, it can be verified that as
the resistance of the secondary caused by wear
increases, the angle necessary to achieve the desired
current also increases, that is, the voltage of the
primary increases and therefore the energy consumed
during welding.
Figure 5: Evolution of the control shift angle depending on
the resistance of the secondary.
4 SECONDARY WEAR
DETECTION
Due to the implications of this defect in both welding
quality and energy consumption, its early detection is
essential.
Specifically, a method is presented for the
predictive detection of secondary circuit wear by
monitoring the control shift angle of the IGBTs. The
method bases its operation on the collection of
welding data in real time from the welding guns
during their normal work cycle.
The welding cycle of a welding gun in a real
welding line can be described as: the new electrodes
are placed on the electrode holder and welding points
begin to be made on the metal to be welded, in the
specific case of the manufacture of the car body, the
characteristics of the metals to be welded vary
depending on the piece, so each specific welding joint
needs its own parameterization to achieve the
required welding quality. After making a series of
welding points, usually between 150-200 joints, the
electrodes are milled to return them to their initial
geometry and remove any dirt that might remain
attached.
ICINCO 2022 - 19th International Conference on Informatics in Control, Automation and Robotics
188
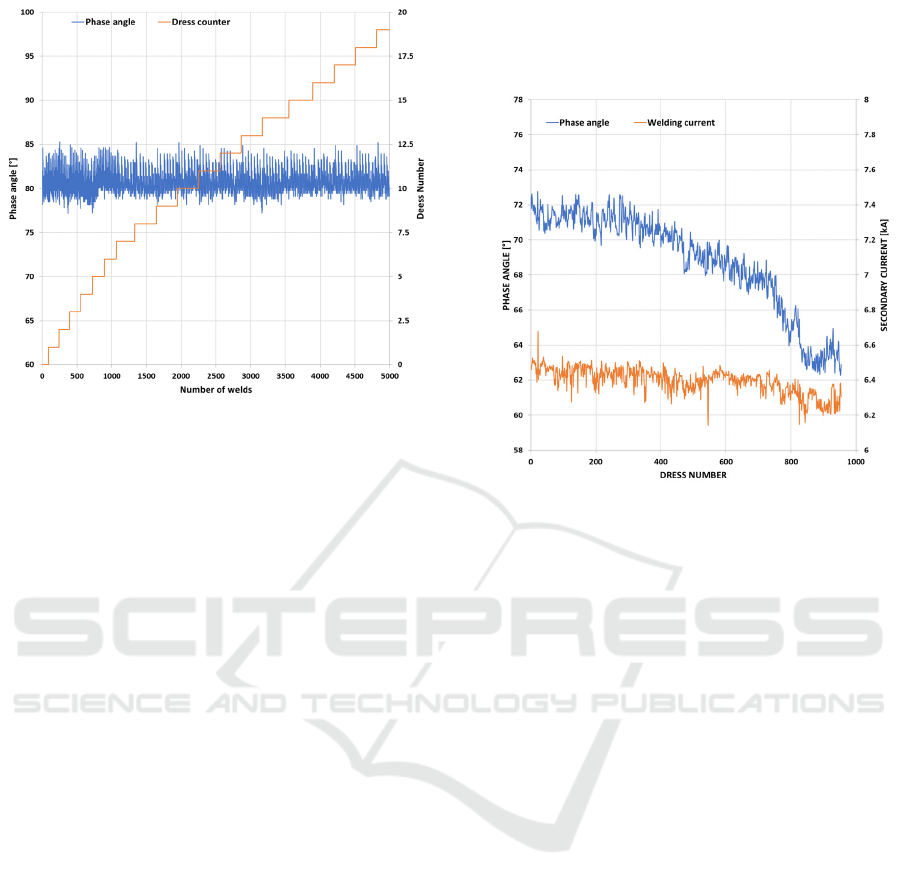
Figure 6: Control shift angle along the electrode life.
Within this work cycle, there is a variation of the
welding current and the control shift angle of the
IGBTs. This variation is given both by the differences
in the metal to be welded and by the degradation of
the electrode. It can be considered that this variation
remains constant when passing from one duty cycle
to another, so if the entire cycle is reduced to a single
value, it could be stated that the average current and
the control shift angle should remain constant.
Figure 5 shows the control shift degrees for a
welding gun together with the evolution of the
number of joints made. It can be seen how despite the
variation between each of the points represented, the
trend remains stable.
After observing that the usual behaviour of the
work cycle between milling is stable, the hypothesis
can be raised since when the secondary circuit begins
to show wear, a distortion will be observed in the
wear data due to the correction of the welding
machine to guarantee the desired current.
Figure 6 shows the actual data of a welding gun
that shows a beginning of degradation. In this case, it
is observed how it goes from a stable behaviour to a
behaviour with a downward trend. This means that for
the same welding current, the welding machine needs
a higher electrical consumption and therefore the
parasitic resistance of the secondary circuit has
increased.
From the comparison of figures 6 and 7, it can be
determined that by carrying out continuous
monitoring of the control shift angle of the IGBTs, it
is possible to detect changes in the parasitic resistance
of the secondary circuit. In other words, the
hypothesis of the analysis of the evolution of the
control shift angle for the determination of the
increase in wear in the secondary circuit of the
welding machine is confirmed.
Figure 7: Evolution of the control shift angle with the wear
of the secondary circuit.
5 REAL-TIME MONITORING
SYSTEM
This method is designed to be applied in real welding
lines, specifically, for this study, ARO type C and X
welding guns controlled by means of the BOS6000
welding timer have been analysed.
First, a protocol is established for the acquisition
of welding data in real time. This first step notably
reduces the amount of data that is handled, since, as
shown in the previous sections, each of the control
shifts of each welding point is not analysed, but rather
it is analysed based on the average control shift of all
weld joints made throughout a milling cycle.
Therefore, this first step collects the data from the
welding database, performs the average by cycles and
indexes the data in the database on which the alarms
are generated.
𝑊=𝑄
1.5𝐼𝑄𝑅 (2)
For the generation of alarms, a simple method of
detecting changes in behaviour is established. As
shown in equation 1, the warning limit is established
by calculating the sum of the third quartile plus 1.5
times the interquartile of the data series. Similarly, the
alarm level is established as the sum of the third
A Novel Real-Time Wear Detection System for the Secondary Circuit of Resistance Welding Guns
189
quartile plus 3 times the interquartile as describe in
equation 3.
𝐴
=𝑄
3𝐼𝑄𝑅 (3)
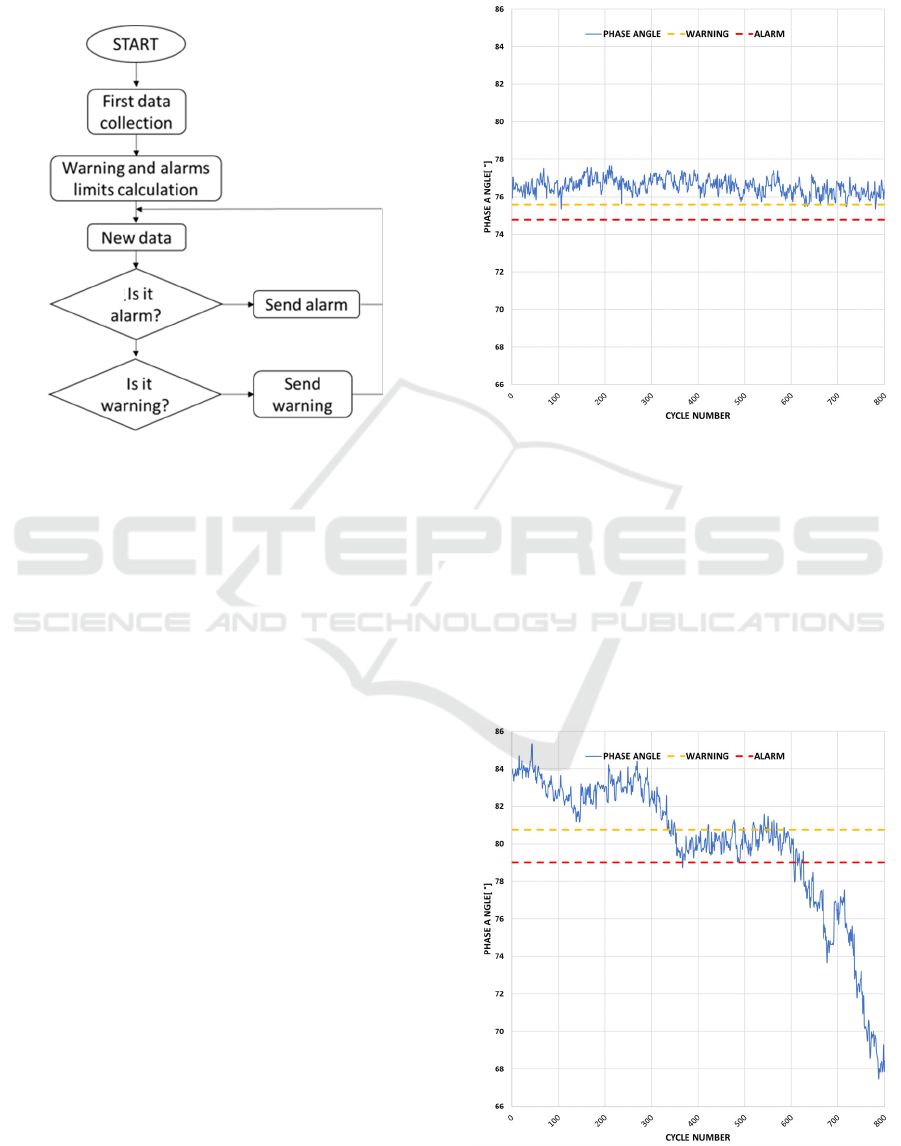
Figure 8: Alarm system.
Therefore, initially, an initial amount of data is
needed to calculate the quartiles and thus establishing
the warning and alarm limits, that is, an amount of
data is needed to make an initial calibration.
In this way, when new data arrives from a specific
welding gun, the data is labelled according to whether
it is within the established warning and alarm
thresholds. When a welding gun begins to show wear,
the data will go from being in the good working group
to the warning or alarm group, thus being able to carry
out the necessary actions to reduce and minimize the
quality problems associated with this defect.
In short, this entire system can be described
according to the flow chart in Figure 8.
This programming has been carried out for validation
on 450 welding guns installed on a real welding line.
Usually, a welding gun installed on a high production
line can do around 10,000 welding points per day,
which would mean working with around 450,000 data
per day. With the simplification of the average
between milling cycles, this amount of data can be
reduced to about 2500 daily data, which significantly
reduces the number of resources needed for their
management and analysis.
Figures 9 and 10 show two real graphs of
behaviour for two different welding guns in a period
of two months.
Figure 9, corresponding to what has been called
gun A, shows the behaviour for a welding gun in good
condition. The offset angle data oscillates within a
range of two degrees but rarely reaches the warning
threshold, so it is not necessary to carry out any
maintenance on the welding gun.
Figure 9: Evolution of the control shift angle gun A.
However, looking at Figure 10, the data shown
presents three behaviour zones. In the first zone, or
initial zone, the data is above the warning threshold
but shows a variable behaviour. In the second zone,
the data exceeds the warning threshold, and the value
remains stable over a certain time, finally, and as no
maintenance action is performed, the offset angle data
increases significantly, which means that the
resistance of the secondary is increasing
exponentially.
Figure 10: Evolution of the control shift angle gun B.
ICINCO 2022 - 19th International Conference on Informatics in Control, Automation and Robotics
190

Similarly, comparing both figures it can be seen
how the energy consumption, as described in the
previous sections, remains constant over time for gun
A, however, to perform the same welding cycle gun
B needs each time a greater contribution of energy,
which is lost in the parasitic resistance of the
secondary.
In short, from the comparison of figures 9 and 10
it can be determined that the method chosen for
setting the warning and alarm thresholds seems to be
the right one to carry out predictive maintenance.
6 CONCLUSION
Throughout this paper, an effective method for
detecting wear in the secondary circuit of resistance
welding guns has been shown. This defect causes a
decrease in welding quality and also an increase in
energy consumption in resistance welding processes.
Electronic simulation has shown how the relationship
between current and control shift angle is easily
demonstrable. From this relationship it has been
assumed that if an analysis of the history of the data
is carried out, an increase in the wear of the secondary
welding circuit can be determined.
This method has been applied in a real factory,
adapting the study for data reduction, and simplifying
the analysis and sending of alarms to those
responsible for maintenance.
From the real data acquired in the production
lines, it has been possible to validate that this method
is viable and reliable for the detection of wear
problems in the welding lines through the analysis of
the shift angle control.
ACKNOWLEDGEMENTS
This study was supported by the Universidat de
València, Ford Spain S.L. and Fundación para el
Desarrollo y la Innovación (FDI), Spain, which the
authors gratefully acknowledge.
REFERENCES
Koskimäki, P. Laurinen, E. Haapalainen, L. Tuovinen, and
M. Juha Röning, “Application of the extended knn
method to resistance spot welding process
identification and the benefits of process information,”
IEEE Trans. Indus. Electron. 54(5), 2823–2830 (2007).
J. Yu, D. Choi, and S. Rhee, “Improvement of weldability
of 1 GPa grade twin-induced plasticity steel,” Welding
J. 93(3), 78s–84s (2014).
G. Hwang, P. Podrzaj, and H. Hashimoto, “Note:
Resistance spot welding using a microgripper,” Rev.
Sci. Instrum. 84(10), 106105-1–3 (2013).
Y. B. Li, Z. Q. Lin, S. J. Hu, and G. L. Chen, “Numerical
analysis of magnetic fluid dynamics behaviors during
resistance spot welding,” J. Appl. Phys. 101(05),
053506 (2007)
Zhou, Kang, and Lilong Cai. "Study on effect of electrode
force on resistance spot welding process." Journal of
applied physics 116.8 (2014): 084902.
Sun, H. T., et al. "Effect of variable electrode force on weld
quality in resistance spot welding." Science and
Technology of Welding and Joining 12.8 (2007): 718-
724.
Ibáñez, D.; García, E.; Martos, J. and Soret, J. (2021). A
Novel Method for the Real-time Force Losses
Detection in Servo Welding Guns. In Proceedings of
the 18th International Conference on Informatics in
Control, Automation and Robotics - ICINCO, ISBN
978-989-758-522-7; ISSN 2184-2809, pages 669-676.
DOI: 10.5220/0010549006690676 (2021)
Saleem, Jawad & Majid, Abdul & Haller, Stefan &
Bertilsson, Kent. (2011). A study of IGBT rupture
phenomenon in medium frequency resistance welding
machine. 236-239. 10.1109/ACEMP.2011.6490602.
Aslanlar, Salim, et al. "Effect of welding current on
mechanical properties of galvanized chromided steel
sheets in electrical resistance spot welding." Materials
& Design 28.1 (2007): 2-7
Hwang, In Sung, Mun Jin Kang, and Dong Cheol Kim.
"Expulsion reduction in resistance spot welding by
controlling of welding current waveform." Procedia
Engineering 10 (2011): 2775-2781.
Aslanlar, S., et al. "Welding time effect on mechanical
properties of automotive sheets in electrical resistance
spot welding." Materials & Design 29.7 (2008): 1427-
1431.
Ibáñez, D.; García, E.; Martos, J. and Soret, J. (2020). Real-
time Electrode Misalignment Detection Device for
RSW Basing on Magnetic Fields. In Proceedings of the
17th International Conference on Informatics in
Control, Automation and Robotics - ICINCO, ISBN
978-989-758-442-8; ISSN 2184-2809, pages 142-149.
DOI: 10.5220/0009820801420149
Y. Zhou,S.J. Dong And K.J. Ely, “Weldability of Thin
Sheet Metals by Small-Scale Resistance Spot Welding
using High-Frequency Inverter and Capacitor-
Discharge Power Supplies,” in Journal of Electronic
Materials, Vol. 30, No. 8, 2001.
T.Munesada, Y.Takasaki, T.Sonada “Spot Welding current
control with a frequency controlled inverter power
supply.” 16th International Conference on Electrical
Engineering” July 11-14, 2010 Busan Korea
Li, Wei .Energy consumption in AC and MFDC resistance
spot welding, XI the Sheet Metal Welding Conference,
Heights, Michigan. p. 1-12. 2004.
A Novel Real-Time Wear Detection System for the Secondary Circuit of Resistance Welding Guns
191

Nagasathya N., Boopathy S. R., Santhakumari A. MFDC-
An energy efficient adaptive technology for welding of
thin sheets, IEEE Energy Efficient Technologies for
Sustainability Conference (ICEETS),2013, Nagercoil,
India, p. 901-906.
Arslan, Serdal & Tarimer, İlhan & Güven, Mehmet & Oy,
Sibel. (2020). A medium frequency transformer design
for spot welding machine using sizing equation and
finite element analysis. Engineering review. 40. 42-51.
10.30765/er.40.3.05.
Zhou, K. and Cai, L. (2014), Study of safety operation of
AC resistance spot welding system. IET Power
Electronics, 7: 141-147. https://doi.org/10.1049/iet-
pel.2013.0094
Gao, David (Zhiwei) (2016). Electric Renewable Energy
Systems || DC–AC inverters, (), 354–381.
doi:10.1016/B978-0-12-804448-3.00016-5
ICINCO 2022 - 19th International Conference on Informatics in Control, Automation and Robotics
192
