
Towards Indoor Radon Analytics: An OLAP-based
Multidimensional Approach
Rolando Azevedo
1,2 a
, Joaquim P. Silva
1b
, Nuno Lopes
1c
, António Curado
3d
,
Leonel J. R. Nunes
3e
and Sérgio Ivan Lopes
2,4 f
1
2Ai – School of Technology, IPCA, 4750-810 Barcelos, Portugal
2
CiTin – Centro de Interface Tecnológico Industrial, 4970-786 Arcos de Valdevez, Portugal
3
proMetheus, Instituto Politécnico de Viana do Castelo, Rua Escola Industrial e Comercial Nun’ Álvares,
4900-347 Viana do Castelo, Portugal
4
ADiT-Lab – Instituto Politécnico de Viana do Castelo, 4900-347 Viana do Castelo, Portugal
Keywords: Data Warehouse, ETL, Indoor Radon, IoT, OLAP, Data Analytics.
Abstract: Indoor radon represents a known hazard to public health, namely, its relationship with lung cancer. The
adoption of data analytics tools for indoor radon human exposure risk assessment is crucial for building
management decision-making and is a fundamental requirement for the implementation of remediation
measures. This work presents the implementation of a data warehouse and an OLAP cube as components of
a more comprehensive IoT-based system, which has been developed for continuous indoor radon gas
management in public buildings. The proposed data warehouse consists of a three-tier data storage structure
to store historical measurements. Although the adopted approach has been tested with a small number of IoT
sensors, the operation of the data warehouse and OLAP server assures that the system is viable and highly
scalable. The increase in the number of active IoT sensors deployed in new buildings, cities, and districts will
increase the richness of the data, which will help to foster even better models.
1 INTRODUCTION
Radon is a naturally occurring and chemically inert
radioactive gas that is produced from the natural
decay of uranium (
238
U) which can be found in rocks
and soil. Radon has no color, smell, or taste. It
accumulates in enclosed spaces as it easily escapes
from the ground into the indoor air. When the most
stable isotope of radon (
222
Rn) decays, it emits alpha
particles, beta particles, and gamma rays (Darby et
al., 2005). Due to its radioactive nature, it represents
the second cause of lung cancer after smoking
worldwide (WHO, 2017). Radon enters the body
mainly through inhalation and it is in the lungs that its
decay can cause damage in lung tissues. Radon and
its decay products have been classified as
a
https://orcid.org/0000-0001-7860-0039
b
https://orcid.org/0000-0002-0138-2456
c
https://orcid.org/0000-0001-8897-5061
d
https://orcid.org/0000-0002-5828-6086
e
https://orcid.org/0000-0001-5404-8163
f
https://orcid.org/0000-0001-6944-7757
carcinogenic since 1988 by the International Agency
for Research on Cancer (IARC) (Gaskin et al., 2018).
A study has shown that the risk of contracting lung
cancer increases by 16% for every increase of 100
Bq.m
-3
in radon concentration (Darby et al., 2005).
Worldwide, inhalation of radon contributes to more
than 40% of the annual dose of all ionizing radiation
(APA, 2010). Since Radon is a hazardous air
pollutant, when high concentrations are reached
inside buildings, European Commission issued in
1990 the recommendation 90/142/Euratom to
propose concentration limit values of 400 Bq.m
-3
for
old dwellings and 200 Bq.m
-3
for new dwellings (The
Commission of the European Communities, 2001).
The Directive 2013/59/EURATOM, issued in 2013,
forcing all member states to prepare a plan to limit
Azevedo, R., Silva, J., Lopes, N., Curado, A., Nunes, L. and Lopes, S.
Towards Indoor Radon Analytics: An OLAP-based Multidimensional Approach.
DOI: 10.5220/0011272800003269
In Proceedings of the 11th International Conference on Data Science, Technology and Applications (DATA 2022), pages 361-369
ISBN: 978-989-758-583-8; ISSN: 2184-285X
Copyright
c
2022 by SCITEPRESS – Science and Technology Publications, Lda. All rights reserved
361

exposition to radon gas and sets a concentration limit
of 300 Bq.m
-3
(European Commission, 2014).
Portugal transposed this directive into national law
effectively since April 3, 2019, through Decree-Law
No. 108/2018 (Curado et al., 2019).
Given the existing risk and the legislation in force,
it is important to develop methodologies to evaluate
and quantify the effective accumulated dose for the
occupants of a building during a given period to
implement remediation measures if necessary. Radon
assessment campaigns can also be used to understand
which factors, (internal and external), may impact
indoor radon concentration. This has been the case in
several studies conducted in the northern region of
Portugal, which is a high-risk area (Curado et al.,
2017). In the study, the authors used handheld meters
to analyze the indoor radon concentration in three
houses during two distinct year seasons. The results
showed that human occupation along with passive
ventilation strategies directly affected radon
concentration. Similar results were also found in
another study conducted in nine public buildings in
the Alto Minho region (Curado & Lopes, 2016).
However, while measurement campaigns are useful
to assess the problem, they cannot implement real-
time mitigation measures. To implement real-time
mitigation is necessary to have systems that are
continuously measuring radon concentration inside
buildings. Since society is also increasingly
concerned with energy-saving and energy efficiency,
these systems can integrate other indoor air quality
parameters and information on building occupancy to
dynamically adapt remediation measures that will
keep the balance between radon concentration and
thermal comfort. When a building is occupied, radon
levels should be at an acceptable level keeping
atmospheric conditions within a comfortable range,
but outside occupancy intervals energy savings can be
maximized without adversely affecting radon levels
in periods of occupancy.
Thus, the RnMonitor project (Online Monitoring
Infrastructure and Active Mitigation Strategies for
Indoor Radon Gas in Public Buildings in Nothern
Region of Portugal) developed a system capable of
online monitoring and actively mitigate radon
concentration (Martins et al., 2020). The
methodology described by Martins et al. corresponds
to one of the RnMonitor platform modules that
aggregates and displays the data collected in a set of
critical buildings selected after an assessment
campaign, during the first stage of the RnMonitor
project execution. As there was no commercially
available sensor to support the project requirements,
an IoT-based multi-parameter sensor was developed
for online monitoring of radon gas and other indoor
air quality parameters. The measurements taken
inside each compartment are transmitted hourly via
radio communications to a local server. The proposed
architecture uses a time-series InfluxDB database that
records short-term measurements. Furthermore, it
was implemented a data warehouse capable of storing
long-term measurements and providing advanced
analysis capabilities was yet to be implemented.
This paper presents the development and
implementation of a multidimensional data
warehouse that enables the RnMonitor platform not
only to store long-term measurements but also to
offer the possibility of using OLAP cubes to explore
the data in a multidimensional way. Moreover, this
work also presents the modelling and implementation
of the ETL process for the creation of a data
warehouse. It was coupled an OLAP server that will
make use of the data warehouse. This document is
structured as follows: Section 2 presents continuous
monitoring systems for radon or air quality; section 3
presents the methodology to develop de data
warehouse; results are presented and discussed in
section 4; and, in section 5, conclusions are
summarized.
2 RELATED WORKS
Over the years, several techniques have been
developed for the measurement of radon
concentration in air. Some of the best known are
activated charcoal detectors, alpha-track detectors,
and continuous radon detectors. Many campaigns are
done with activated carbon detectors because they are
easy to use and do not require electrical power during
a collection campaign that lasts from two days to
about a week. During the sampling period, the radon
gas is absorbed by the activated charcoal following
Van Der Wall’s basic principle. The radon
concentration is later determined in the laboratory by
counting the gamma-ray emissions of lead (
214
Pb) and
bismuth (
214
Bi), which are decay products of radon.
Andreas C. George (1984) describes the use of this
type of detector for the measurement of radon
concentration.
Martín Sánchez et al. (2012) used an activated
charcoal canister to identify 130 workplaces to
perform a long-term study in Extremadura (Spain).
The authors used this type of device since the
exposure time required was only two days. Although
these detectors are affordable and easy to install, they
can only determine the average concentration. When
it is necessary to measure the radon evolution over
DATA 2022 - 11th International Conference on Data Science, Technology and Applications
362

time, the use of portable electronic sensors is an
advantage. In addition to being able to collect data
over longer periods, some devices allow one to
download the measurements for analysis. Using 13
portable radon monitor Airthings Corentium Plus in
13 rooms of a school in Viana do Castelo, Azevedo et
al. (2020) & (2021), analyzed the evolution of radon
concentration in the rooms over 41 days.
These equipment do not allow for active
mitigation as the measurements are not processed in
real-time by the device or sent to a cloud server for
viewing, alerting, or activating a mitigation system.
Zheng et al. (2016) developed a system for air quality
monitoring using IoT techniques and Low Power
Wide-Area (LPWA) wireless technology to transmit
the data to the cloud where it is processed. Although
this air quality monitoring system does not include
radon measurement, the data transmission technology
is interesting because it can cover a wide area. It was
with this aim that a system that combines the use of IoT
technologies and Low Power Wide-Area (LPWA)
network communications has been developed (Sérgio
I. Lopes et al., 2019). This continuous monitoring
system, which the authors have called RnMonitor,
makes use of IoT technologies and uses a license-free
sub-gigahertz bidirectional LoRa communication to
send the measurements. In a test using three
LoRaWAN Gateways, the authors successfully
covered the center of Viana do Castelo city with signal
always below -100 dB while LoRa has an input
sensibility of -148 dB (Sergio I. Lopes et al., 2019).
The reader should notice that the development of the
data warehouse presented in this paper is part of the
RnMonitor platform. On the client-side, RnMonitor
offers a front-end application that allows you to view
the measurement sites with cartography-based
navigation and a dashboard that makes use of Grafana
to visualize the measurements over the last 24 hours, 1
week or 3 months. Additionally, Pereira et al. (2020)
developed the RnProbe which is an IoT Edge device
capable of measuring radon concentration,
temperature, relative humidity, atmospheric pressure,
and CO
2
.
In the literature review, we did not find any online
radon monitoring work combining the use of a data
warehouse and OLAP. García-Tobar (2020) used an
assessment campaign of two dwellings of a
residential building in Madrid to build two OLAP
cubes from the data. In other research domains, it is
possible to find online monitoring systems that
implement data warehouses. Soares et al. (2018)
developed a data warehouse to store the water
consumption of the municipality of Esposende in
Nothern Portugal and thus monitor and analyze the
water consumption to reduce water losses and
improve water consumption management. Tshering
et al. (2021) has created an IoT-based platform, using
Apache Hadoop and Apache Kylin analytics engine,
for continuous air quality monitoring to measure air
pollution using a PM
2.5
particulate sensor.
3 SYSTEM IMPLEMENTATION
The proposed system allows the record of
measurements in a multidimensional data warehouse
and the use of OLAP cubes to explore the data using
MDX queries. The data warehouse thus created
allows keeping the historical data and pre-calculated
measurements beyond the 2 years limit of the
InfluxDB time series database.
3.1 RnMonitor Data Source
The data warehouse has two data sources provided by
the RnMonitor platform: the application database
(AppDB) and the time series database (TSDB). The
data contained in these two databases can be accessed
through a RESTful API providing several endpoints.
The endpoints are protected using JSON Web Tokens
(JWT) that must be sent in the header of each request
made by the user.
The AppDB database is an open-source
document-oriented NoSQL database MongoDB.
Unlike relational databases, that store information in
columns and rows, this type of database stores
separate documents within a collection. The TSDB
database is also an open-source database widely used
in real-time monitoring applications, designed to be
able to handle a high volume of queries and writes per
second. Figure 1
shows the data model of the two
databases of the RnMonitor platform.
The raw measurement data generated by the
sensors are stored in the TSDB database in the
“
Measurements” table. There are ten attributes
"fieldn" which correspond to the various air quality
parameters measured where "n" corresponds to the
"field_id" of the table “Field”, a table that contains
information about each of the parameters. Currently,
the parameters analyzed are radon, temperature, CO
2
,
atmospheric pressure, and relative humidity.
In the AppDB database, one of the main tables is
the table "Polygon", which can have four different
types: compartment, building, county, and district.
This table contains a parent-child relationship
through an attribute indicating the parent polygon.
Note that a compartment has always a building as a
parent, a building has always a county as a parent and
Towards Indoor Radon Analytics: An OLAP-based Multidimensional Approach
363
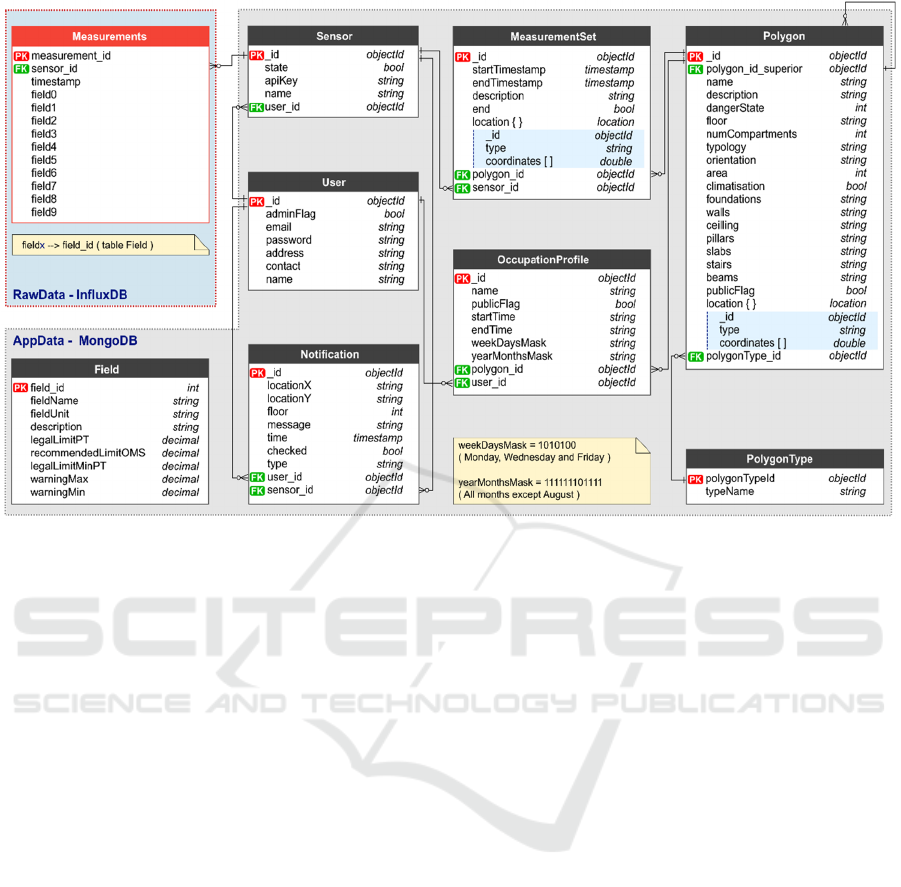
Figure 1: RnMonitor Databases model.
a county has always a district as a parent. The only
polygon that has no parent is the so-called district
because it is the highest order polygon. The
“MeasurementSet” table is used to record the
location of each of the sensors, as the same sensor
may be used to take measurements in one room inside
a building and later be removed to take measurements
in a room inside another building in a different
county.
The sensor has no GPS locator, so its current
location is only possible by looking at the
"MeasurementSet" table.
The table "OccupationProfile" allows the
creation of different occupation profiles for the same
room or building for different users. This can be used
to calculate the accumulated radon exposure dose for
different workers depending on the time they spend
in the compartment. The "Notification" and “User”
tables, although implemented, do not contain useful
information for the implementation of the data
warehouse.
3.2 Data Warehouse
The data warehouse was implemented considering
the AppDB and TSBD data models and the data
analysis goals. The data warehouse model uses a star
schema for easier understanding and faster queries.
The model shown in Figure 2 is composed of three-
dimensional tables and a fact table and two support
tables. The "Dim_Polygon" dimension is the most
important dimensional table. This table contains a
parent-child relationship, where each polygon
references its parent polygon through a foreign key
that corresponds to the id of the parent polygon.
The fact table “fact_measurement” contains
three calculated measures: “radon_kpi_pt” which
corresponds to the value of radon/300 being 300
Bq.m
-3
the radon limit in the Portuguese legislation;
“radon_kpi_oms/100” being 100 Bq.m
-3
the limit
value advised by the WHO; “thi_value” which
corresponds to the Temperature-Humidity Index
(THI) value. This last attribute corresponds to the THI
index, which represents the combination of
temperature and humidity to measure the degree of
thermal comfort experienced by an individual
indoors. This index, developed originally by Thom
(1959), combines the wet and dry bulb temperatures
on a scale to mimic the thermal sensation of the
human being. The Nieuwolt's (1977) modified THI
correlates air temperature and relative humidity,
allowing a more straightforward approach to rapidly
assess indoor thermal discomfort based on the
measurement of hygrothermal parameters. The
Nieuwolts THI is defined by the following formula:
THI = 0.8×T+(T×RH)/500
where T corresponds to indoor air temperature and
RH to the indoor relative humidity.
DATA 2022 - 11th International Conference on Data Science, Technology and Applications
364
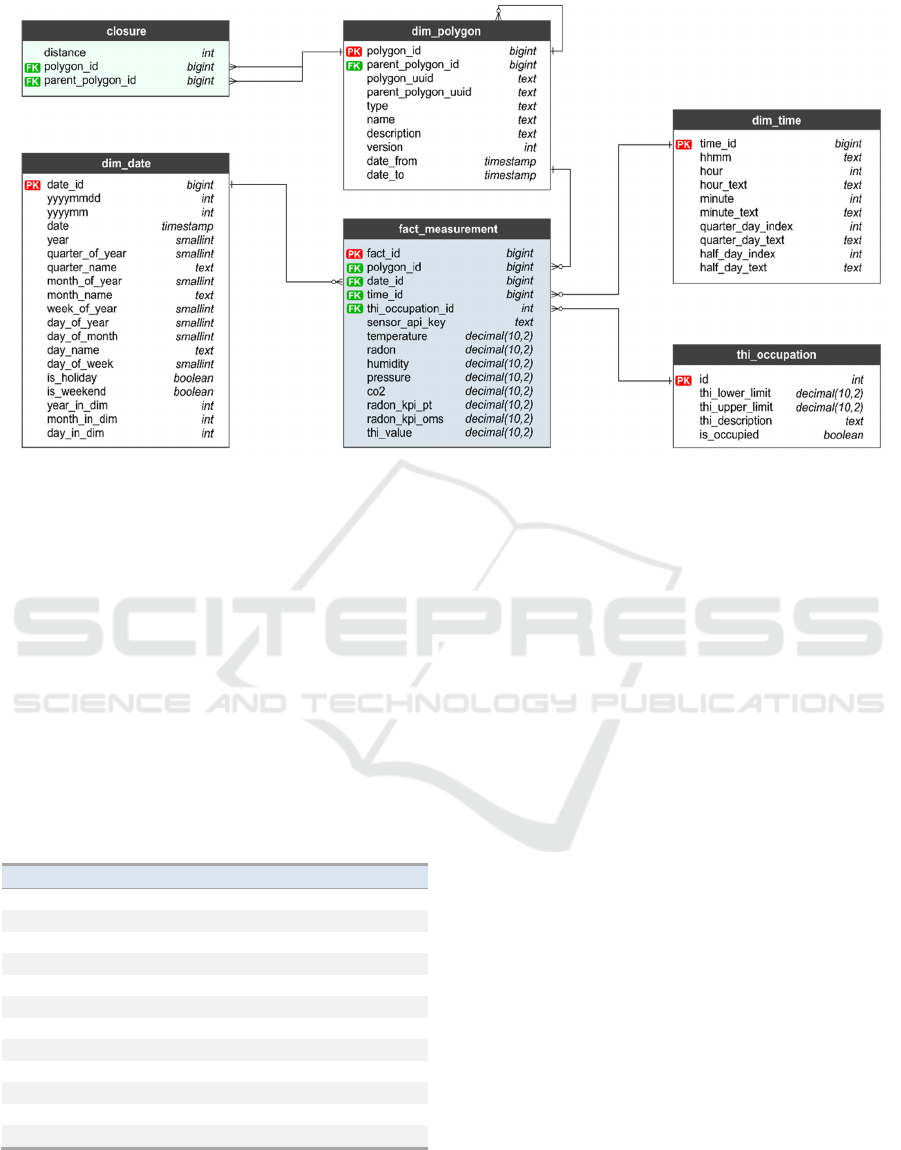
Figure 2: Data Warehouse Model.
The “Closure” table allows keeping the transitive
closures of the parent-child relationships of
“Dim_polygon”. The hierarchy between parent and
child is kept by the distance attribute that determines
the distance between parent and child tuples. This
table is necessary to the hierarchy definition in OLAP
cube schemas when implemented on Mondrian
OLAP Server. The table “thi_occupation” is used to
normalize the non-quantitative attributes by
removing them from the fact table and creating a table
to register the different combinations. The
combinations of the thi_occupation are defined in
Table 1.
Table 1: Thi_occupation table content.
_
id thi_description thi_lower thi_uppert Is_occupied
1
Too cold 0 8 false
2
Too cold 0 8 true
3
Need for heating 8 21 false
4
Need for heating 8 21 true
5
Comfortable 21 24 false
6
Comfortable 21 24 true
7
Need for ventilation 24 26 false
8
Need for ventilation 24 26 true
9
Too hot 26 99 false
10
Too hot 26 99 true
11
No THI data 0 0 false
12
No THI data 0 0 true
The range values for THI are defined by “thi_lower”
and “thi_upper.” For each “thi_description” that
corresponds to a different THI interval, we have two
possibilities for the compartment occupation
represented by the “is_occupied” column.
3.3 ETL Process
The ETL process allows the creation of the data
warehouse by extracting data from the two databases
of the RnMonitor platform, manipulating and
transforming the data, before loading it into the
respective dimensional and fact tables of the data
warehouse. The ETL process is executed once a day,
thus loading the measurements performed in the
previous 24 hours. The use of a data warehouse will
allow a better understanding of radon behavior and
discover patterns through advanced analysis
techniques. That is why a daily update of the
measurements is sufficient since mitigation actions
can be triggered by the RnMonitor platform based on
the online radon readings loaded in the TSDB
database.
The ETL process was developed using Pentaho
Data Integration (PDI) through the Spoon graphical
interface. The transformations download data from
both RnMonitor databases through several RESTful
API endpoints. The ETL process is triggered by a
single job that has the function of cascading several
transformations. The execution of a transformation
always depends on the conclusion of the previous
one. There are two different ETL process execution
flows. The first flow represented in the Figure 3
corresponds to the initial process. It is executed only
once and serves to create the data
Towards Indoor Radon Analytics: An OLAP-based Multidimensional Approach
365
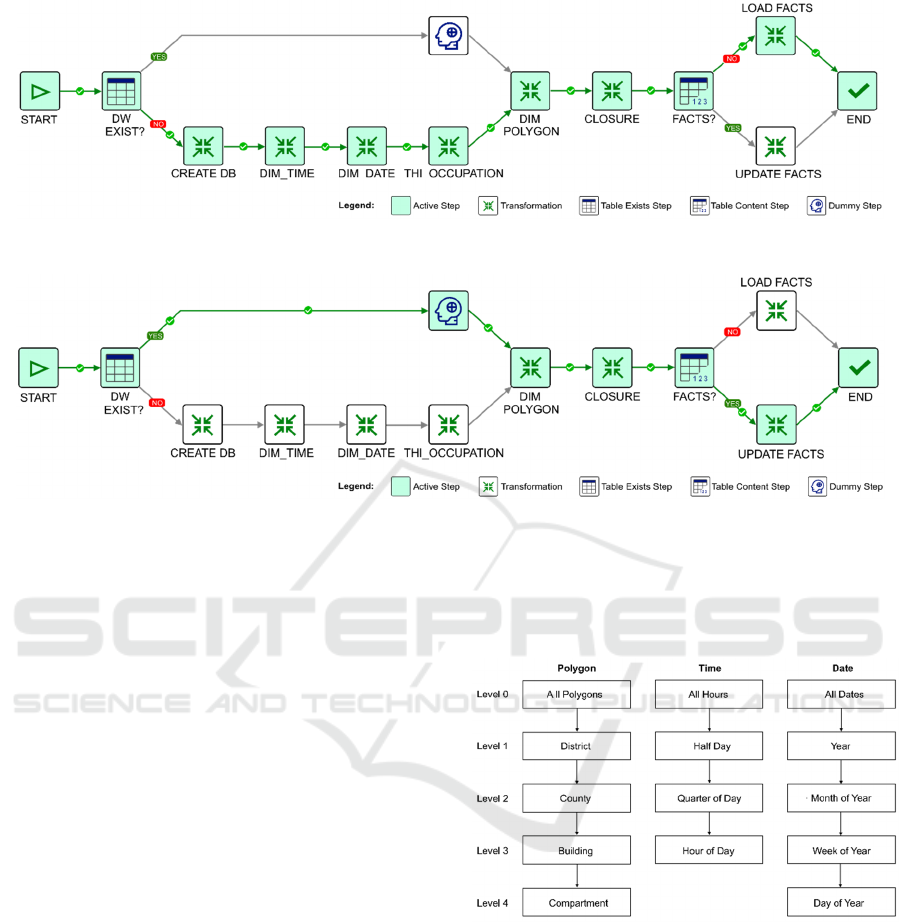
Figure 3: Initial ETL execution flow.
Figure 4: Update ETL execution flow.
warehouse and the various tables that compose it. It is
during this phase that all the dimensional tables are
populated and all the measurements that can be obtained
from the TSDB are loaded. The second flow represented in
Figure 4 corresponds to the update process. This process
flow is the one executed daily. In case of any change in the
polygons data, the “dim_polygon” dimension is updated
using a Kimball slowly changing dimension of type 2. The
closure table is recreated whenever the “dim_polygon”
dimension has new polygons. During this execution flow
the fact table “fact_measurements” is loaded with the new
measurements since the last update even if the system was
down for several days.
3.4 OLAP
Online Analytical Processing (OLAP) is a technology
that is part of many Businesses Intelligence (BI)
applications and allows for complex analytical
calculations. Aggregations, merging, and grouping in
a relational database are not efficient. These
operations are faster using OLAP since the data can
be pre-calculated and pre-aggregated. Our solution
provides an OLAP server to explore the cubes using
MDX queries, and for that, we have used Mondrian
as our OLAP Server. The data cube granularity is
determined by combining the levels corresponding to
each cube axis. We can change the level of granularity
to a finer one or coarser one, producing a different
cube measure value.
We can map members of the lower hierarchy to
members of the higher hierarchy. With the members
existing in our dimensional tables, the hierarchies of
Figure 5 can be implemented on the cube.
Figure 5: Dimension Hierarchies.
For the Mondrian OLAP server to use the data
warehouse created, it must use a cube schema file.
This XML file contains the definition of one or more
OLAP cubes.
We can see the graphical representation of the
cube schema in Figure 6. In this definition, we find
the three dimensions with their respective hierarchies
and levels. The dimensions, Time, and Date are
defined outside the cube to be used in several cubes.
The cube makes use of these dimensions through
dimension usage. In “Dim_Polygon” dimension,
only one hierarchical level is defined. since the
DATA 2022 - 11th International Conference on Data Science, Technology and Applications
366
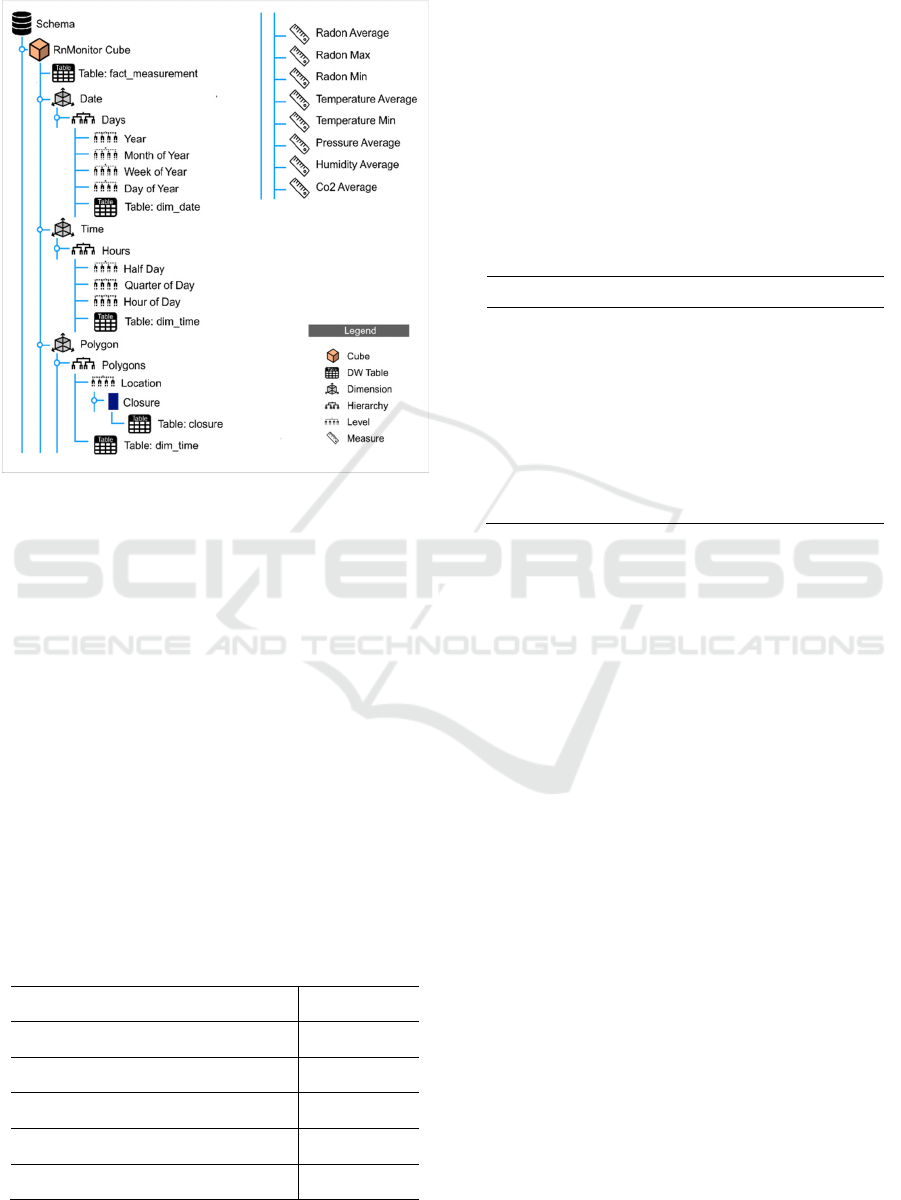
relation between the polygons is defined by using a
“closure” table, as the schema shows.
Figure 6: RnMonitor cube.
4 DISCUSSION
The data warehouse was validated by checking that
the contents of the data warehouse and the data
available in the two databases of the RnMonitor
platform, RawData and AppData. The data
warehouse content is structured according to the
multidimensional schema. It contains all the records
of the measurements gathered by the sensors since the
beginning of the sensors' measurements. By 12 March
2022, the database contains more than 121,000 radon
measurement records. The first measurement took
place on 15 May 2015, and after more than 33 months
the data warehouse has been updated daily proving
that it supports long-term data recording (over 24
months).
Table 2: Data Warehouse content.
Total number of measurements 121 735
Data collection starting date 2019/05/15
Districts 3
Counties 10
Buildings 18
Compartments 22
The data warehouse will be used to create tools
and develop strategies for radon mitigation. Table 2
show that the available measurements took place in
22 compartments of 18 different buildings located in
10 different counties which correspond to 3 different
districts.
Table 3 shows the number of records per sensor in
more detail. Currently, seven active sensors are
gathering hourly measurements for the RnMonitor
platform. More details about the implementation of
the active sensors can be found in Pereira et al.
(2020).
Table 3: Measurements by active sensor.
Sensor Measurements Start Date
D001 9554 2019-05-15T15:00:00
D003 22811 2019-05-15T15:00:00
D004 9545 2019-05-21T21:00:00
D007 8432 2019-07-05T00:00:00
D009 18246 2019-05-28T20:00:00
D0011 10273 2019-11-09T00:00:00
D0012 16457 2019-11-12T22:00:00
The validation of the OLAP server aimed to verify
that the cube schema was functional and to make sure
that MDX queries returned the expected results. As
the Mondrian instance provides a graphical interface
to test MDX queries, this functionality was tested
using queries that correspond to simple OLAP
operations. Since we installed the instance on a
remote server, we ran the test through the browser of
the Windows operating system computer and
accessed the URL serving the GUI web page.
Although the number of sensors that are carrying out
the measurements is small, the perspective is to
increase the number of sensors once the validation of
the operation of the data warehouse and OLAP server
confirms that the system is viable and has room to
grow. The increase in the number of active sensors
and the planned extension to other buildings, cities,
and even districts will greatly enhance the richness of
the data. A larger and more diversified data set will
allow producing better models.
5 CONCLUSIONS
The assessment of indoor radon concentration and the
mitigation of the associated exposure risks in public
buildings becomes mandatory because European
directives force member states to act to reduce the
Towards Indoor Radon Analytics: An OLAP-based Multidimensional Approach
367

indoor exposure risk. The exposure to high radon
concentrations increases the risk of developing lung
cancer. This risk increases in areas with a specific
geological constitution and poorly ventilated
buildings. These two factors are prevalent in public
buildings in the center and northern Portugal. In this
context, the RnMonitor platform was created to
perform continuous indoor radon monitoring in
several public buildings in the North of Portugal. This
paper presents the development of a data warehouse
capable of storing all the measurements’ history and
some derived measures, which has been integrated as
an additional module with the RnMonitor platform.
The data are loaded to the data warehouse through the
execution of an ETL process created for this purpose.
An OLAP server has been coupled to the data
warehouse to support OLAP cubes and business
intelligence tools.
ACKNOWLEDGEMENTS
This research is a result of the project TECH –
Technology, Environment, Creativity and Health,
Norte-01-0145-FEDER-000043, supported by Norte
Portugal Regional Operational Program (NORTE
2020), under the PORTUGAL 2020 Partnership
Agreement, through the European Regional
Development Fund (ERDF). R.A. was supported by
operation NORTE-06-3559-FSE-000226, funded by
Norte Portugal Regional Operational Program
(NORTE 2020), under the PORTUGAL 2020
Partnership Agreement, through the European Social
Fund (ESF). L.J.R.N. was supported by proMetheus,
Research Unit on Energy, Materials and Environment
for Sustainability – UIDP/05975/2020, funded by
national funds through FCT – Fundação para a
Ciência e Tecnologia. António Curado co-authored
this work within the scope of the project proMetheus
– Research Unit on Materials, Energy and
Environment for Sustainability, FCT Ref.
UID/05975/2020, financed by national funds through
the FCT/MCTES.
REFERENCES
Apa. (2010). Qualidade do Ar em Espaços Interiores Um
Guia Técnico 2010.
Azevedo, R., Silva, J. P., Lopes, N., Curado, A., & Lopes,
S. I. (2020). Short-term indoor radon gas study in a
granitic school building: A comparative analysis of
occupation periods. Lecture Notes of the Institute for
Computer Sciences, Social-Informatics and
Telecommunications Engineering, LNICST, 323
LNICST, 80–89. https://doi.org/10.1007/978-3-030-
51005-3_9
Azevedo, R., Silva, J. P., Lopes, N., Curado, A., & Lopes,
S. I. (2021). Short-Term Indoor Radon Gas Assessment
in Granitic Public Buildings: A Multi-Parameter
Approach. Advances in Science, Technology and
Innovation, 3, 415–418. https://doi.org/10.1007/978-3-
030-35533-3_50
Curado, A., & Lopes, S. I. (2016). Impact of Human
Occupation on Indoor Radon Concentration : a Study
Based on in-Situ Measurements for a Set of Households
in Alto-Minho ,. 4th European Conference on
Behaviour and Energy Efficiency (Behave 2016),
September, 8–9.
Curado, A., Silva, J., Carvalho, L., & Lopes, S. I. (2017).
Indoor Radon concentration assessment in a set of
single family houses: Case study held in Barcelos,
North of Portugal. Energy Procedia, 136, 109–114.
https://doi.org/10.1016/j.egypro.2017.10.295
Curado, A., Silva, J. P., & Lopes, S. I. (2019). Radon risk
analysis in a set of public buildings in Minho region,
Portugal: from short-term monitoring to radon risk
assessment. Procedia Structural Integrity, 22(2019),
386–392. https://doi.org/10.1016/j.prostr.2020.01.048
Darby, S., Hill, D., Auvinen, A., Barros-Dios, J. M.,
Baysson, H., Bochicchio, F., Deo, H., Falk, R.,
Forastiere, F., Hakama, M., Heid, I., Kreienbrock, L.,
Kreuzer, M., Lagarde, F., Mäkeläinen, I., Muirhead, C.,
Oberaigner, W., Pershagen, G., Ruano-Ravina, A., …
Doll, R. (2005). Radon in homes and risk of lung
cancer: Collaborative analysis of individual data from
13 European case-control studies. British Medical
Journal, 330(7485), 223–226. https://doi.org/10.1136/
bmj.38308.477650.63
European Commission. (2014). Council Directive
2013/59/Euratom of 5 December 2013 laying down
basic safety standards for protection against the dangers
arising from exposure to ionising radiation, and
repealing Directives 89/618/Euratom, 90/641/Euratom,
96/29/Euratom, 97/43/Euratom a. Off J Eur Commun
L13, December 2003, 1–73.
García-Tobar, J. (2020). Study of Indoor Radon Using Data
Mining Models Based on OLAP Cubes. Physical
Science International Journal, December, 53–61.
https://doi.org/10.9734/psij/2020/v24i1030219
Gaskin, J., Coyle, D., Whyte, J., & Krewksi, D. (2018).
Global Estimate of Lung Cancer Mortality Attributable
to Residential Radon. Environmental Health
Perspectives, 126(May), 1–9. https://doi.org/10.12
89/EHP2503
George, A. C. (1984). Passive, integrated measurement of
indoor radon using activated carbon. Health Physics,
46(4), 867–872. https://doi.org/10.1097/00004032-
198404000-00012
Lopes, Sérgio I., Cruz, A. M., Moreira, P. M., Abreu, C.,
Silva, J. P., Lopes, N., Vieira, J. M. N., & Curado, A.
(2019). On the design of a Human-in-The-Loop Cyber-
Physical System for online monitoring and active
mitigation of indoor Radon gas concentration. 2018
DATA 2022 - 11th International Conference on Data Science, Technology and Applications
368

IEEE International Smart Cities Conference, ISC2
2018, February. https://doi.org/10.1109/ISC2.20
18.8656777
Lopes, Sergio I., Moreira, P. M., Cruz, A. M., Martins, P.,
Pereira, F., & Curado, A. (2019). RnMonitor: A
WebGIS-based platform for expedite in situ
deployment of IoT edge devices and effective Radon
Risk Management. 5th IEEE International Smart Cities
Conference, ISC2 2019, Isc2 2019, 451–457.
https://doi.org/10.1109/ISC246665.2019.9071789
Martín Sánchez, A., de la Torre Pérez, J., Ruano Sánchez,
A. B., & Naranjo Correa, F. L. (2012). Radon in
workplaces in Extremadura (Spain). Journal of
Environmental Radioactivity, 107, 86–91.
https://doi.org/10.1016/j.jenvrad.2012.01.009
Martins, P., Lopes, S. I., Pereira, F., & Curado, A. (2020).
Rnmonitor: An iot-enabled platform for radon risk
management in public buildings. Lecture Notes of the
Institute for Computer Sciences, Social-Informatics and
Telecommunications Engineering, LNICST, 323
LNICST, 49–55. https://doi.org/10.1007/978-3-030-
51005-3_6
Nieuwolt, S. (1977). Tropical climatology: An Introduction
to the climates of the low latitudes. John Wiley and
Sons.
Pereira, F., Lopes, S. I., Carvalho, N. B., & Curado, A.
(2020). RNProbe: A lora-enabled IoT edge device for
integrated radon risk management. IEEE Access, 8,
203488–203502. https://doi.org/10.1109/ACCESS.20
20.3036980
Soares, J., Leite, P., Teixeira, P., Lopes, N., & Silva, J. P.
(2018). Data warehouse for the monitoring and analysis
of water supply and consumption. Atas Da Conferencia
Da Associacao Portuguesa de Sistemas de Informacao,
2018-Octob(February 2021). https://doi.org/10.1007/9
78-3-030-14850-8
The Commission Of the European Communities. (2001).
Commission Recommendation of 21 February 1990 on
the protection of the public against indoor exposure to
radon (90/143Euratom). L, 1–13.
Thom, E. C. (1959). The Discomfort Index. Weatherwise,
12(2), 57–61. https://doi.org/10.1080/00431672.1959.9
926960
Tshering, Y., Tamrakar, S. R., Gontia, S., & Baral, S.
(2021). IoT-based Platform with Big Data using
Apache Kylin: Air Quality Monitoring System
(AQMS). World Journal of Research and Review,
13(3), 12–20. https://doi.org/10.31871/wjrr.13.3.12
WHO. (2017). Evolution of WHO air quality guidelines:
past, present and future. In Copenhagen: WHO
Regional Office for Europe.
Zheng, K., Zhao, S., Yang, Z., Xiong, X., & Xiang, W.
(2016). Design and Implementation of LPWA-Based
Air Quality Monitoring System. IEEE Access, 4, 3238–
3245. https://doi.org/10.1109/ACCESS.2016.2582153
Towards Indoor Radon Analytics: An OLAP-based Multidimensional Approach
369
