
In Situ Calibration Algorithm to Optimize Energy Consumption in an
Automotive Stamping Factory Process
Ivan Peinado-Asensi
1,2 a
, N. Montes
1 b
and E. Garc
´
ıa
2 c
1
Mathematics, Physics and Technological Sciences Department, University CEU Cardenal Herrera,
C/ San Bartolom
´
e 55, 46115, Alfara del Patriarca, Valencia, Spain
2
Ford Spain, Pol
´
ıgono Industrial Ford S/N, 46440, Almussafes, Valencia, Spain
Keywords:
Predictive Maintenance, Machine Health Monitoring, Energy Consumption, IIoT, Sustanibale Development,
In Situ Calibration.
Abstract:
The world’s large factories in all sectors consume a great deal of resources, either raw materials or energy,
to develop their products. Saving resources can have a positive impact on the sustainable development of the
planet. Automotive manufacturers are a clear example of how to save by investing resources in improving
technologies and optimizing processes. This article focuses on one of the most common processes in the
automotive sector: the stamping process. For the optimization of this process, previous simulations are usually
carried out in order to define the optimal parameters and which should only be applied for a correct operation.
The real circumstances of the plant show there is a large discrepancy between the parameters obtained by
simulation and the real process because of the difference in material properties, lubrication, press operation,
etc. The solution is that the operators must adjust the parameters a posteriori and the only criterion to follow
is obtaining the right quality of the part. In many cases, the parameters are well above the ideal. This article
presents some algorithms used in order to perform an in situ calibration of the stamping presses to find the press
parameters that, guaranteeing the quality of the part, allow to adjust the energy consumption to the minimum.
At the end of this article the experimental results from this in-situ calibration process and the energy savings
are shown.
1 INTRODUCTION
The stamping process consists of applying a force on
a sheet of reduced thickness (approximately 1mm)
with moulds designed according to the geometry of
the part to be manufactured. The main mechanical
characteristic that must be taken into account to ob-
tain a correct shaping of the part is the material elas-
tic limit. If the parts are of large dimensions, therefore
so must be the dies used. That is, the larger the die,
the greater the weight to be moved through the press,
being able to weigh up to 30 tons both the upper and
lower die. Displacing these large moulds and properly
shaping materials such as steel or aluminum requires
the use of industrial presses with high workforce ca-
pacity, that is, for example when forming larger parts
such as a side, larger presses will be needed as com-
a
https://orcid.org/0000-0002-5603-5910
b
https://orcid.org/0000-0002-0661-3479
c
https://orcid.org/0000-0002-4210-9835
pared to manufacturing small parts such as door rein-
forcements.
Regarding the manufactured parts, the fundamen-
tal priority in the plant is to avoid passing defective
parts to the following assembly processes, since a de-
fective part in the subsequent processes increases the
cost of the losses. For this, comprehensive quality
controls are carried out at the end of the line where
we can verify whether the product is suitable or not.
In the event of a change in the quality of the prod-
uct, adjustments are made to the process to verify that
with the parameters entered the parts are within the
quality margins in order to continue producing nor-
mally. This is a work that requires great knowledge
since in the stamping process more than 40 different
variables are involved, some of them are more impor-
tant than others but just a small modification in one
of them can cause quality defects, whether they are
wrinkles, breaks, stretches, etc. And these variables
are both due to the type of materials and the sheet
thickness, the surface roughness, the amount of lu-
Peinado-Asensi, I., Montes, N. and García, E.
In Situ Calibration Algorithm to Optimize Energy Consumption in an Automotive Stamping Factory Process.
DOI: 10.5220/0011272600003271
In Proceedings of the 19th International Conference on Informatics in Control, Automation and Robotics (ICINCO 2022), pages 169-176
ISBN: 978-989-758-585-2; ISSN: 2184-2809
Copyright
c
2022 by SCITEPRESS – Science and Technology Publications, Lda. All rights reserved
169

bricant used, and the anisotropy and elasticity among
others, as well as due to the equipment where wear in
the die, mismatch in parameters such as the regulation
or the stamping pressure of the material among others
may happen.
To all this we must add the day-to-day work of
an automotive plant, where it is essential to have the
ability to be flexible and dynamic to adapt to the de-
mand required at all times. In the stamping plant
at Ford Spain facilities we have a large number of
lines of different capacities, which allows us to have
a great adaptation to the demand required. There are
a large number of car chassis parts manufactured in
the factory for the five models that are currently being
made, these may undergo changes in the manufactur-
ing standards, either by the type of material, geometry
of the part, line change or other factors. Therefore,
try-out tests are carried out for a new adjustment and
to ensure that the quality of the product during mass
manufacture is correct.
The tests carried out in the try-out procedure for
the new adjustment consist of modifying the manu-
facturing parameters until reaching the most optimal
point of resources use, both equipment and material.
For example, adjustments are made to the working
parameters of the press in the calibration to control
the pressure with which the part is made, parameters
of the pressure made in the press are also adjusted to
control the amount of material drawn into the die in
order to ensure no cracks occur due to excess stroking
or wrinkles due to the lack of it. Other types of mate-
rial can even be used instead of the one initially pro-
posed, taking into account a different mechanical be-
haviour with which the work parameters must be ad-
justed again.
As for the characteristics of the presses we have in
the plant, we can classify them in two groups, the me-
chanical and hydraulic presses. Most of the presses
in the plant belong to the first group that includes,
on the one hand, the cutting presses, which work at
high speeds and perform the cutting of the coil in the
blank parts that will later be used in the stamping pro-
cess. We have also the stamping presses, character-
ized by being the largest ones, with which different
operations are carried out, such as deep-drawing, cut-
ting, drilling, bending and spring-back. These presses
work at high levels of pressure due to the size of the
moulds used for the aforementioned operations, espe-
cially those of deep-drawing. Within the mechanical
presses we have two types, single-action and double-
action. The latter are the ones that have been used for
a long time for forming stamping parts, characterized
by having two eccentric transmission systems in the
press head. And on the other hand the single-action
presses, which are more efficient, incorporating an in-
telligent hydraulic cushion at the bottom of the press
including only one eccentric transmission system on
the head.
Following the current trends in predictive mainte-
nance, we intend to implement at plant level a mon-
itoring system of the presses we have in the factory
to find out their working status and be able to an-
ticipate possible faults. It is known that the imple-
mentation of this type of industrial projects requires
a great economic investment, but in our case, follow-
ing the philosophy proposed by the Miniterms (Gar-
cia and Montes, 2019), we intend to take advantage
of the maximum of available sensors and taking into
account the information that can be extracted from
these develop new solutions to monitor the health of
the equipment. This is a great advantage we have in
the stamping plant, since most presses come equipped
with a lot of sensors thus having at our disposal a lot
of information at no extra cost.
The sensorization of the presses with strain gauges
has been used for years to define pathologies of the
equipment from different points of view, including di-
agnosing failures in the stamping process of both the
equipment and the manufactured product (Koh et al.,
1996). This can be done by applying different tech-
niques to obtain information from measured data such
as wavelets (Jin and Shi, 1999), relying on experi-
ments (Jin and Shi, 2000) and even applying machine
learning techniques by using neural networks (Bassi-
uny et al., 2007). Going a step beyond the detection of
pathologies, process control systems have also been
developed based on the graph obtained from the ton-
nage of each cycle (Zhou et al., 2015) or by finding
variations in the lubrication of the process and wear
of the die (Voss et al., 2017). Following the trends
of internet of things in industry (IIoT) we now have a
lot of available data in real time to model the process,
as it has been done in this field by (Niemietz et al.,
2020). Hence, in this paper we show the first insight
we have obtained from the process and the advantages
we are taking from the application developed for solv-
ing detected issues and optimizing the process from
the point of view of energy consumption.
Optimizing the process to achieve energy savings
is vitally important due to two major factors. One of
them aims to achieve a sustainable development of the
planet, reducing pollution and saving on available re-
sources. And the second is the economic factor, since
during the last year the price on the electricity bill at
the factory has doubled the price and it is predicted
that this upward trend will continue, thus these costs
indirectly will affect the profit per car produced at the
factory.
ICINCO 2022 - 19th International Conference on Informatics in Control, Automation and Robotics
170

For the optimization of this process, previous sim-
ulations are usually carried out in order to define the
optimal parameters which should only be applied for
a correct operation. The real circumstances of the
plant show there is a large discrepancy between the
parameters obtained by simulation and the real pro-
cess either because of the difference in material prop-
erties, lubrication, press operation, etc. The solution
is that the operators must adjust the parameters a pos-
teriori and the only criterion to follow is obtaining the
right quality of the part. In many cases, the param-
eters are well above the ideal. Being able to have
knowledge of a process and applygin in situ solu-
tions is a trend that is increasingly used to develop
technological solutions, as can be seen in (Grasso and
Colosimo, 2017) and (Buchli et al., 2018). Hence, in
this article presents some algorithms used to be able to
perform an in situ calibration of the stamping presses
in order to find out the press parameters that, guar-
anteeing the quality of the part, allow to adjust the
energy consumption to the minimum.
The paper is structured as follows: in the next sec-
tion we will explain previous considerations to take
into account which are our purpose with the proposed
methodology and in section 3 the following method-
ology to optimize the process will be shown. In the
fourth section we will show a real case of how we
have detected an abnormal function of the process and
the modifications carried out. Finally, the conclusions
and future works are proposed in section 5.
2 BACKGROUND
Together with the consequences that happen in an au-
tomotive plant as explained in the previous point, to
this must be added the consumption of resources that
is generated, due to raw materials, labour, and en-
ergy consumption. Therefore, for proper sustainable
development and to be able to manufacture with the
least possible impact on the environment, the aim is
to optimize the use of available resources even by
reusing materials that are classified as scrap due to
the process.
What is sought in this research is to reduce the en-
ergy consumption of the stamping plant from the data
extracted from the process in order to know how the
presses are working with the different sets of dies and
to look for an optimal point of the working parameters
which ensures minimum energy consumption without
affecting the quality of the manufactured material.
2.1 Previous Considerations
Throughout the stamping process, as mentioned
above, the presses that carry out the Deep-Drawing
process are the ones that can apply the highest pres-
sure. Therefore, these are the presses with the largest
electric motors and on which we will focus to develop
our tool.
In stamping, two phases are required to get a cor-
rect configuration of the work parameters, in a first
phase the simulation of the process is carried out with
programs specifically designed for stamping. From
which the working parameters of the press are defined
by taking into account the design of the part and char-
acteristics of the material. But due to the variations
between the simulation and the real world, a second
phase is required in which try-out tests are carried
out in the plant by performing an adjustment of the
equipment in order for the product to meet the quality
requirements, in which the final process adjustments
can vary with respect to those defined by the design.
The main properties of the material to take into ac-
count in the forming are the deformation the sheet un-
dergoes in the different areas along its entire surface.
Due to the non-linear plastic deformation character-
istic of the deep drawing and the non-homogeneous
material flow during the process, it is very difficult to
control its efficiency.
E =
σ
ε
(1)
In the forming process of a steel sheet there are
several properties of the materials that are fundamen-
tal to take into account to achieve a correct deep draw-
ing without causing defects. One of the possible de-
fects is wrinkles which can be caused by several fac-
tors in the process, but mainly because the elastic limit
of the material has not been exceeded and therefore it
tries to return to its initial position.
To do this, a certain tension must be applied that
allows exceeding the elastic limit of the material but
without causing breaks or stretches that do not pro-
vide structural stability. Therefore, the result of the
tension against deformation can be seen in the red
zone in figure 1 where the material is in the hardening
zone.
To obtain stamped product information, we are
able to obtain the deformation (ε) of a stamped sheet
to ensure that we will have no quality defects with the
final configuration. The process consists of printing
a mesh in the plate by electrolytic marking. After-
wards, the stamped part is taken to the laboratory and
with a high-resolution camera, with 20 million pixels,
photos are taken of the different areas to be analyzed,
the example shown in figure 5 is the central beam of
In Situ Calibration Algorithm to Optimize Energy Consumption in an Automotive Stamping Factory Process
171
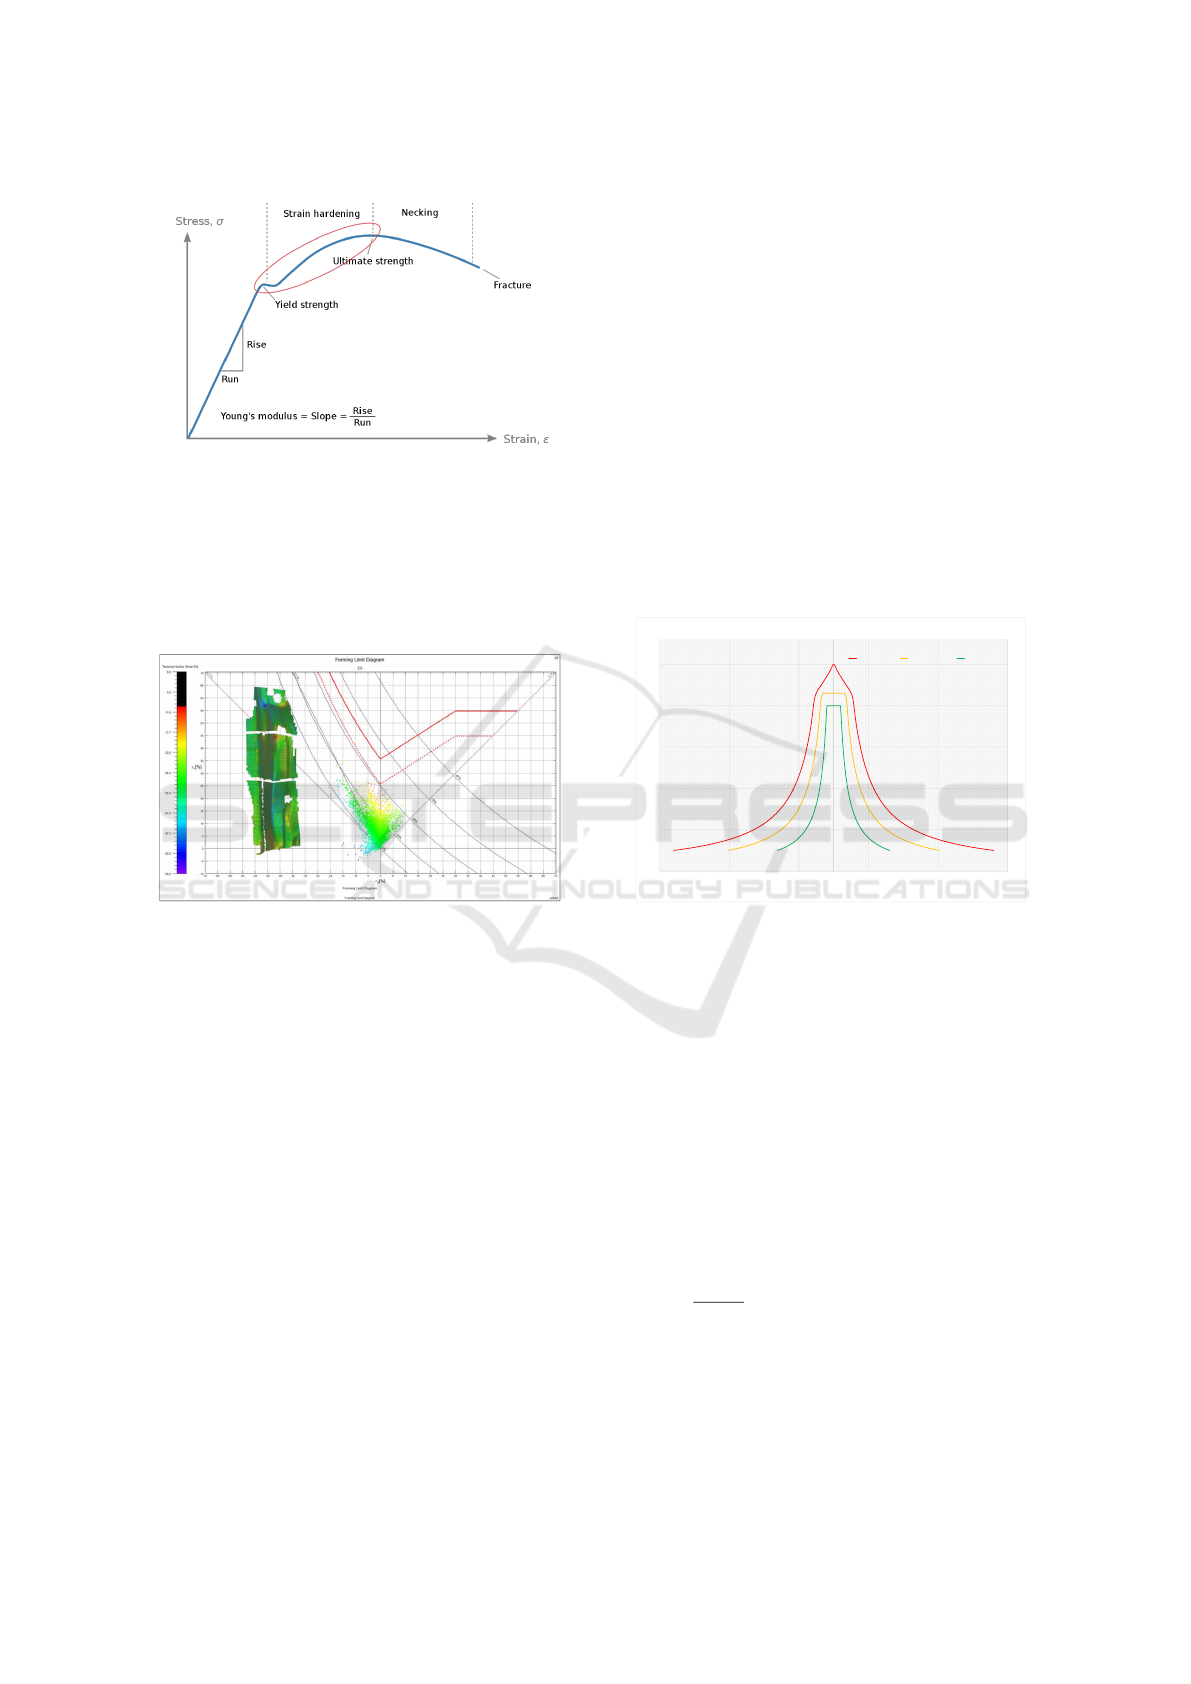
Figure 1: Stress–Strain Curve.
the measured part. Using the AutoGrid® software we
can obtain an output of the FLD of the area analyzed
with the strain of each node measured, showing the
maximum strain ε
1
and ε
2
per node in the diagram
with the bounds of the diagram previously defined for
the specific material.
Figure 2: FLD of a Real Stamped Part.
According to this research development, once the
working parameters are known in real time and the
stamping process is understood in depth, the process
will be optimized from the point of view of press
work, where the least amount of energy resources is
used for the shaping of the parts, we verify that the
consumption of the electric motor of the press and
the measured tonnage are directly related in a propor-
tional manner. In the result section, we have verified
this through real measurements of the process.
2.2 Previous Work
Real-time data monitoring is essential to know the sta-
tus of the machine. By applying IIoT (Industrial In-
ternet of Things) techniques we are able to receive
a large amount of process information, the pressure
made by the presses, pressures of the hydraulic and
pneumatic groups, press movement activation time,
speeds and positions of the different moving ele-
ments among others. Of these, a real-time application
(Peinado-Asensi. et al., 2021) was developed based
on the information obtained from the tonnage sensors
so that we have been able to find out the quality of
the press throughout the cycle in each and every press
stroke during production.
In order to obtain information on the relevant pro-
cess, an alarm sending system has been defined so that
for each of the different parts of the car produced, we
can store the press cycles that fail including detailed
information on which press position said anomalous
event has occurred. The reason why it has been made
for each part is because depending on the geometry
of the die the pattern of the gravity centre may vary
considerably. We also have a parallel system used to
control the press at all times, which warns us about
how much it is deviating from normal functioning to-
wards the limits of the press. We currently have these
margins defined as shown in the picture below.
0,00
500,00
1000,00
1500,00
2000,00
2500,00
-2500 -1500 -500 500 1500 2500
Slide length
LIMIT FORCE X AXIS
Fx max Warning Safe
Figure 3: Health Monitoring Limits.
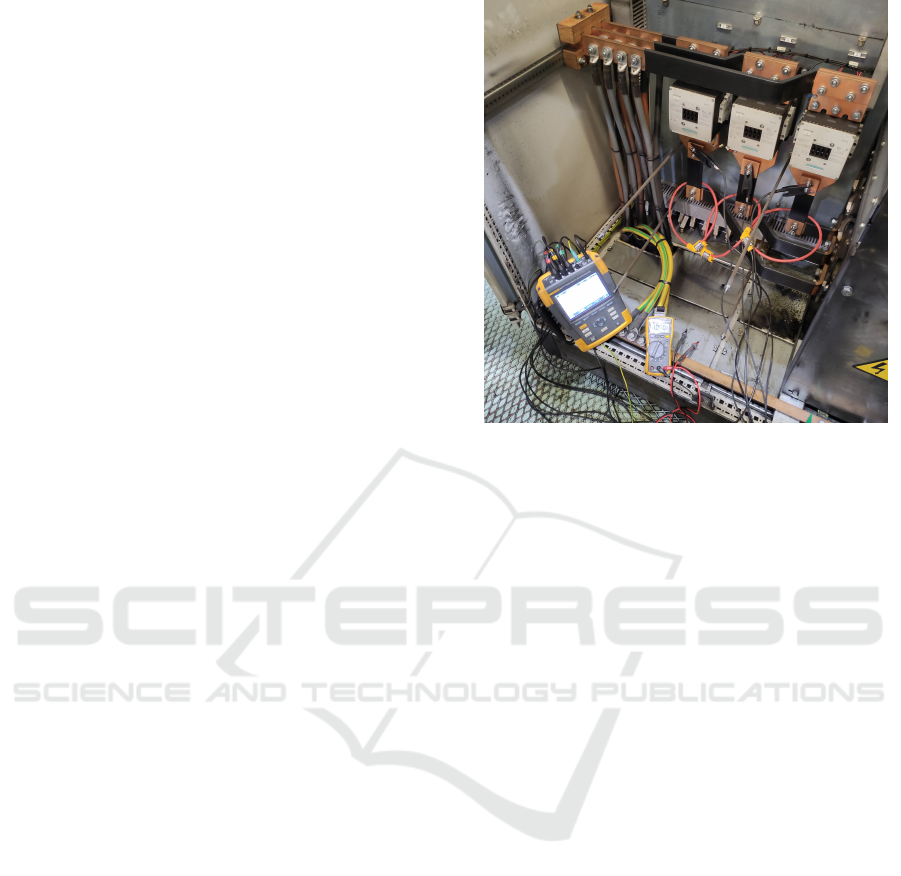
To validate that the tool worked as expected and
the data received from the Gravity Centre were cor-
rect, a test was carried out with 4 columns mounted at
the same height at the base of the press, then we un-
balanced them by adding 1 mm thick sheets between
the different columns and after shifting the gravity
centre towards each of the sides, we found out that the
results obtained coincided with what was expected,
being able to determine that our system works as ex-
pected.
The value of the sensor has been taken for each
press position to obtain the gravity centre and the
equation shown below has been applied,
GC
j
=
∑
T
i
D
i
∑
T
i
, i = 1, . . . , 4, j = 0, . . . , 359. (2)
Where T is the value of the tonnage sensor and
D the distance from the rod foot to the centre of the
press slide.
ICINCO 2022 - 19th International Conference on Informatics in Control, Automation and Robotics
172
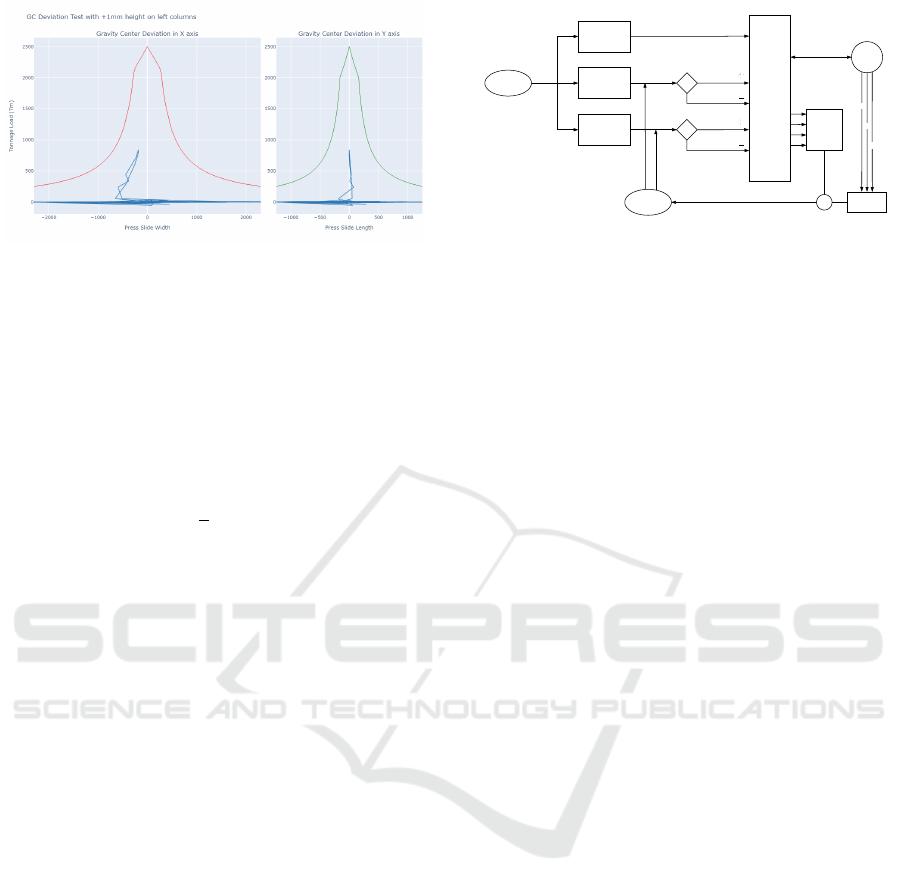
Figure 4: Gravity Center Graph.
3 IN SITU CALIBRATION
ALGORITHM PROPOSAL
We have 3 critical variables that directly affect the en-
ergy transmitted by the flywheel to the eccentric trans-
mission system and this energy of the flywheel is cal-
culated as shown
E =
1
2
· J · ω
2
, (3)
where J is the inertia transmitted by the flywheel
and ω is the angular speed at which the flywheel ro-
tates. In this case the inertia is fixed since it depends
directly on the geometry of said flywheel where the
mass and the radius are always the same, therefore the
greater the energy requirement, the greater the speed
of rotation transmitted by the electric motor of the
press by means of a pulley transmission system.
One of the parameters evaluated as critical with
respect to the energy required for the press movement
is the die weight, which depending on the part pro-
duced can be higher or lower, between 5 and 30 tons
approximately. The second parameter is the compen-
sation pressure, which consists of two large volume
pneumatic cylinders in which the pressure is adjusted
depending on the die weight in order to help the press
raise the slide and die at the end of the cycle. And
third, the adjustment of the press slide, the lower the
height of the slide, the greater the pressure in the die
to exert a travel of the upper die and therefore greater
energy will be needed to be transmitted from the iner-
tia flywheel.
Therefore, the control algorithm proposed to ad-
just the working parameters of the press and ensure
that the energy consumed is minimal is as follows.
We can see there are two variables that can be
modified to optimize the power consumption, the ad-
justment of the slide and the pressure of the compen-
sation cylinders.
Die Weight
L2
M
Regulation
Counterbalance
Pressure
Tonnage
Energy
L3
L1
Flywheel
Car Part
Output
Figure 5: In-loop Control Diagram.
3.1 Slide Adjustment
On the one hand we have the slide adjustment, this
parameter is very sensitive and critical in terms of
part quality. Since modifying tenths of a millime-
tre, both upwards and downwards, significant quality
defects, wrinkles or breaks may appear, respectively,
thus turning the product into scrap. This parameter
will be modified by try-out tests in the event that the
press pressure is detected outside the designed work
value. A real case of this setting will be shown in the
next point.
Being a parameter directly related to the force ex-
erted by the press, with the measurement of the ton-
nage sensors we can obtain information on whether
the adjustment is adequate or programmed at a value
that can damage the mechanical elements of the press
by performing a force greater than necessary.
The way to proceed will be as follows, starting
from a tonnage detected as anomalous in the sense of
exceeding the design working conditions. Tests will
be carried out by modifying the adjustment in half a
millimeter each time. Then a stamping cycle is car-
ried out verifying, on the one hand that the quality
of the produced part has not been affected and on the
other hand, the resulting tonnage value, in case of be-
ing able to reduce the tonnage, this process will be
repeated until reaching a value of the slide adjustment
which does not cause wrinkle or springback defects in
the material.
3.2 Counterbalance Pressure
On the other hand, we have the compensation, so for
this variable the energy consumption in a cycle will
be measured for different pressure values. With the
values obtained, we can proceed as explained below.
As explained above, this is an auxiliary system
that exclusively affects the operation of the equip-
ment, which will cause two cases of mismatch. On the
one hand, the manufacturer provides us with a list of
compensation pressure values depending on the upper
die weight. On several occasions this value has been
In Situ Calibration Algorithm to Optimize Energy Consumption in an Automotive Stamping Factory Process
173
modified with readjustments after a fault, for exam-
ple, or external factors that cannot be controlled. In
some cases, depending on the consumption, we will
need to optimize the value required by the manufac-
turer, which may not be the most optimal one. The
following methodology is therefore proposed for ad-
justing the compensation value. To achieve the min-
imum energy, the gradient descent method is applied
for n iterations
x
n+1
= x
n
− α∇ f (x
n
), (4)
for a known function f (x) that will give us the energy
value with regard to a pressure value, but the problem
is that from our measurements we cannot define an
exact function for the behaviour of the measured val-
ues. To do this, we are going to obtain an approximate
function p(x) by using the method of approximation
by polynomials of degree n,
p(x) = a
0
+ a
1
x + a
2
x
2
+ ··· + a
n
x
n
, (5)
where having n points we will need n + 1 measure-
ments, being
p(x) ' f (x). (6)
At this point we must obtain the values of a
0
, . . . , a
n
by solving the system of n equations with n unknowns
that we would have left, being n the number of total
measurements made. Once the function is obtained,
the gradient descent method is applied to obtain the
lowest energy value with respect to the compensation,
obtaining the optimal value for the process and adjust-
ing it online according to our control system shown in
figure 5.
4 EXPERIMENTAL VALIDATION
For the measurement of the energy consumed with
the different working parameters, the Fluke 438-II
Power Quality and Motor Analyzer equipment has
been used, connected to the output of the electric mo-
tor drive as can be seen in figure 6, being able to mea-
sure the energy consumed directly by the electric mo-
tor.
4.1 In Situ Slide Regulation Calibration
Among the available lines in the stamping shop, there
are two twin lines to manufacture big car body parts
Figure 6: Energy Measurement.
with 2500 tons of capacity in the deep drawing op-
eration, where the gravity centre system is currently
monitoring data. During the period the app has been
working, no signs of malfunction or imbalance have
been found in the slide. There is an alarm system that
warns us about the number of strokes and which press
position the imbalance is taking place. There are two
ways of reading the information of the gravity centre,
a weekly report with the productions status of each die
and a real time dashboard where it has been counted
the number of times our security limits are exceeded.
So we can monitor the working status of the machine
all the time.
Until now, all the monitored parameters men-
tioned before have been correct without having any
abnormal behaviour, but there is still other important
limit to check: the working load limit of the press.
The press manufacturer recommended not to exceed
at least 80% of the limit force, as those machines are
designed to work with 2500 tons maximum, but the
advised number should be 2000 tons to ensure a cor-
rect working status.
Our alarm system detected a part that was be-
ing manufactured with 2300 T as can be seen in fig-
ure 7, an unusual load that had not been previously
recorded. We checked it and found out the follow-
ing events: the part produced was the roof of the Ford
Transit van in its long version shown in 8, when man-
ufacturing this part one of the largest forming dies
available in the plant was used.
It was shocking at first because a simple geometry
car part should not cause problems unless something
strange happened, but everything seemed normal. So
ICINCO 2022 - 19th International Conference on Informatics in Control, Automation and Robotics
174
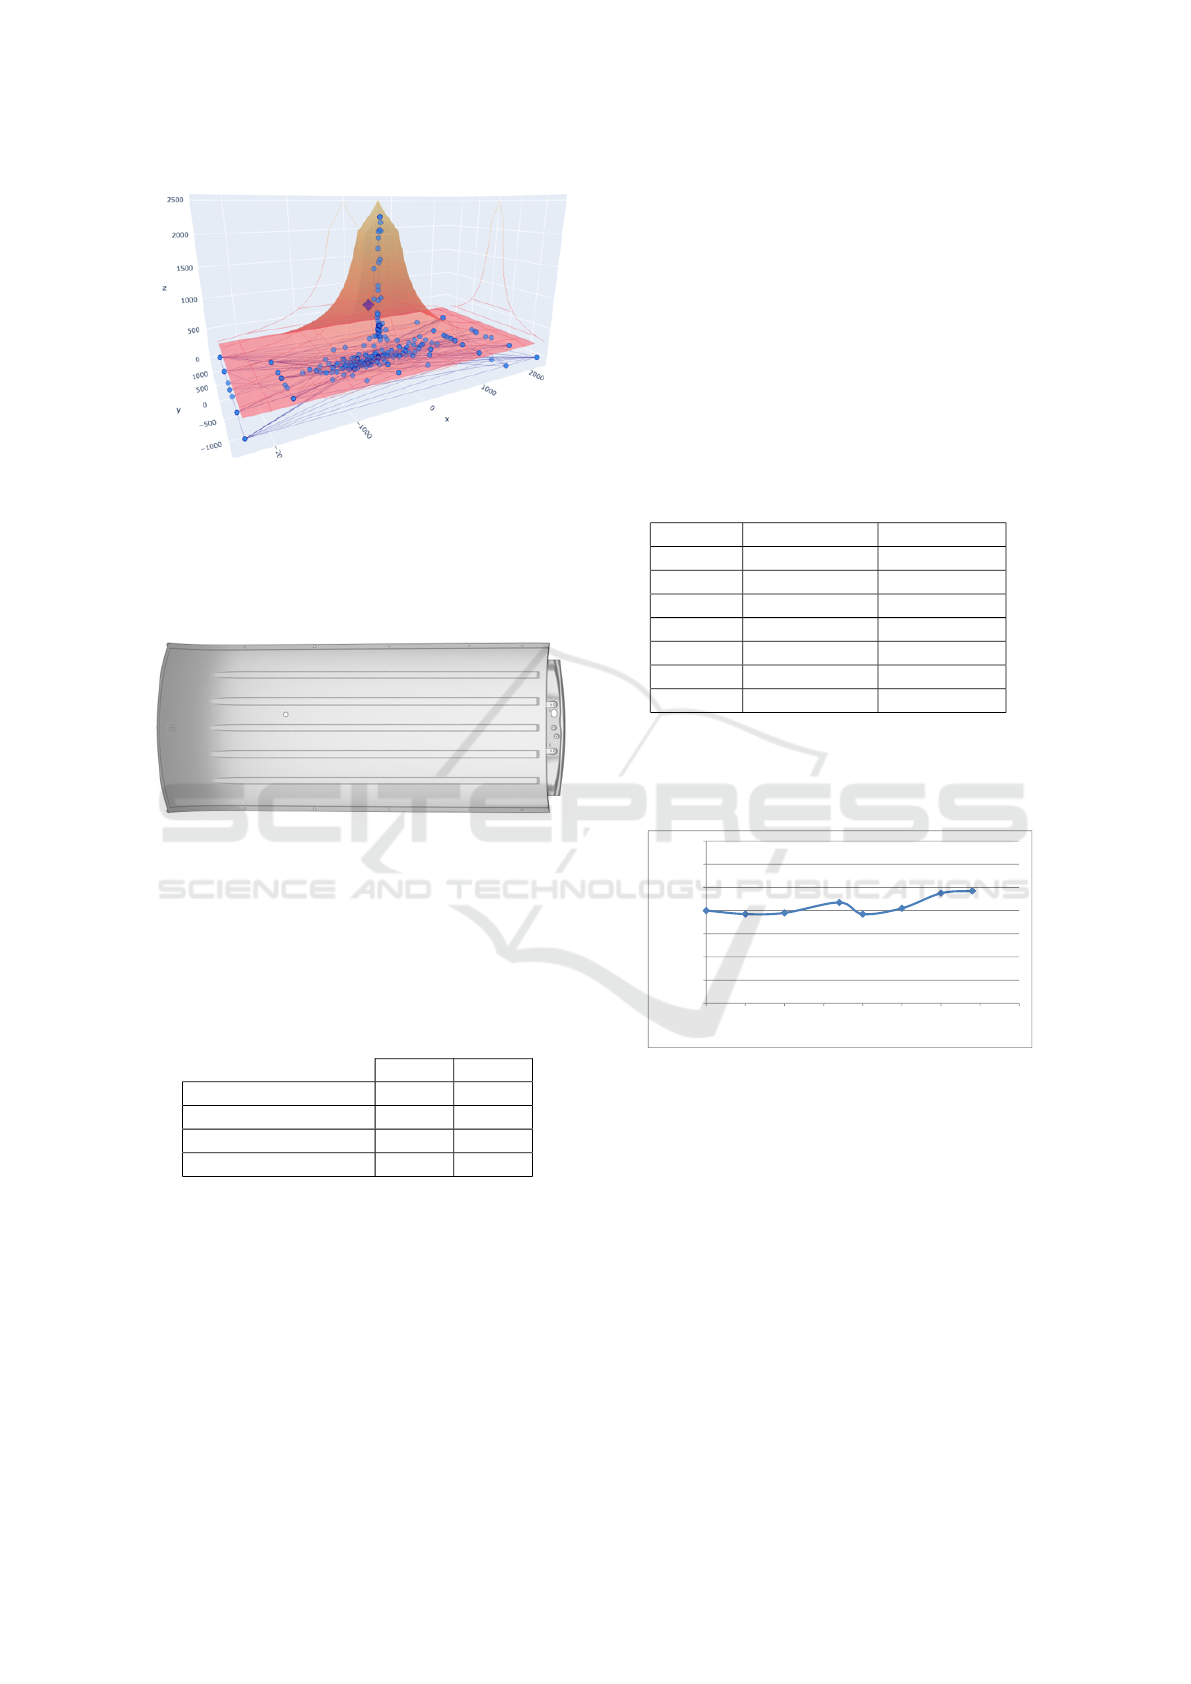
Figure 7: Gravity Center Graph.
after making some research to figure out what would
have caused this event, we realized that the die set
was changed from one line to another, that is, new
parameters were input in the stamping line and clearly
some error would have caused this.
Figure 8: Car Body Part - Roof.
Comparing working parameters from one line to
another, before the tonnage data monitoring the load
was around 1500 tons. So try-out jobs were organized
to modify parameters to optimize the process. Table
1 shows the measured values before and after the in
situ adjustment.
Table 1: Working parameters comparation.
PRE POST
Tonnage (T) 2292 1618
Counterbalance (bar) 7.4 7.4
Slide reg. (mm) 1371.5 1373.5
Energy (kWh) 416 359
Where you can see that the tonnage has been re-
duced by about 700 tons by modifying the adjustment
only 2mm and the energy consumption in one hour of
work has been reduced by 57 kWh.
4.2 In Situ Counterbalance Adjustment
The test for compensation was performed on a smaller
press as compared to the anomaly presented in the
previous case. In this case we used a double-action
mechanical press with a maximum capacity of 1500
tons, where smaller parts are manufactured as com-
pared to those used in the presses described in the
previous point. Here we have the peculiarity that for
each type of die, because of the weight difference be-
tween them, different energy values will be obtained.
Therefore we should repeat the process for each of the
different car chassis parts manufactured.
The values shown in table 2 are the measurements
for a press cycle showing the consumption for each of
the pressures from 3 to 6 bars during several strokes.
After measuring several strokes for a fixed pressure,
the average Wh conpsumtion per hour was obtained.
Table 2: Working parameters comparation.
Measure Pressure (bar) Energy (Wh)
1 3 45
2 3.5 44.25
3 4 44.5
4 4.5 46.75
5 5 44.25
6 5.5 45.5
7 6 48.75
The function that defines the distribution of points
should have a shape like the one shown below and it
will be the one we need to look for, an approximate
function p(x).
25,00
30,00
35,00
40,00
45,00
50,00
55,00
60,00
3 3,5 4 4,5 5 5,5 6 6,5 7
Energy (Wh)
Counterbalance (bar)
Figure 9: Couterbalance - Energy Graph.
To obtain the function that describes the behaviour
of the consumption with respect to the pressure, we
will apply the method of approximation by polyno-
mials defined in equation 5, therefore we will have
the following expression:
p(x) = a
0
+ a
1
x + a
2
x
2
+ a
3
x
3
+ a
4
x
4
+ a
5
x
5
+ a
6
x
6
.
(7)
There is a system of 6 equations with 6 unknowns
to solve in order to have the values of the parame-
ters a
0
, . . . , a
n
and obtain the approximate function
that will give us the energy consumption for a given
compensation. The values obtained for this die are as
follows;
In Situ Calibration Algorithm to Optimize Energy Consumption in an Automotive Stamping Factory Process
175

a
0
= −2.0585 · 10
4
, a
1
= 2.9929 · 10
4
,
a
2
= −1.7837 · 10
4
, a
3
=
67063
12
,
a
4
= −971, a
5
=
1331
15
, a
6
= −
10
3
.
Once the function is obtained, the gradient descent
method is applied to obtain the lowest energy value
with respect to the compensation, obtaining the opti-
mal value for the process and adjusting it online ac-
cording to our control system shown in figure 5.
5 CONCLUSIONS AND FUTURE
WORKS
This article shows two in situ calibration techniques
of stamping process parameters that allow to reduce
the energy consumption of the manufacturing pro-
cess. In-situ calibration methods are commonly used
to adjust sensors or processes, which cannot be ad-
justed from the factory since the discrepancy between
the ideal and actual situation is significantly differ-
ent. This is the case of the stamping process where
the values assumed in the simulation process and the
reality of the process require the operators to make
adjustments on the process and where it is common
to find them oversized. The calibration algorithms
proposed in this article make it possible to perform
this calibration and achieve significant energy sav-
ings, as demonstrated in this paper. As future works,
we will intend to generalize these in-situ calibration
techniques to the rest of the presses and also other
processes of the factory having the same problem.
ACKNOWLEDGEMENTS
This study was supported by the Universidad CEU
Cardenal Herrera, Ford Spain S.L. and Fundaci
´
on
para el Desarrollo y la Innovaci
´
on (FDI), Spain,
which the authors gratefully acknowledge.
REFERENCES
Bassiuny, A., Li, X., and Du, R. (2007). Fault diagno-
sis of stamping process based on empirical mode de-
composition and learning vector quantization. Inter-
national Journal of Machine Tools and Manufacture,
47(15):2298–2306.
Buchli, J., Giftthaler, M., Kumar, N., Lussi, M., Sandy,
T., D
¨
orfler, K., and Hack, N. (2018). Digital in situ
fabrication-challenges and opportunities for robotic in
situ fabrication in architecture, construction, and be-
yond. Cement and Concrete Research, 112:66–75.
Garcia, E. and Montes, N. (2019). Mini-term, a novel
paradigm for fault detection. IFAC-PapersOnLine,
52(13):165–170.
Grasso, M. and Colosimo, B. M. (2017). Process defects
and in situ monitoring methods in metal powder bed
fusion: a review. Measurement Science and Technol-
ogy, 28(4):044005.
Jin, J. and Shi, J. (1999). Feature-preserving data compres-
sion of stamping tonnage information using wavelets.
Technometrics, 41(4):327–339.
Jin, J. and Shi, J. (2000). Diagnostic feature extraction from
stamping tonnage signals based on design of experi-
ments. J. Manuf. Sci. Eng., 122(2):360–369.
Koh, C. K., Shi, J., Black, J. M., and Ni, J. (1996). Ton-
nage signature attribute analysis for stamping pro-
cess. Transactions-North American Manufacturing
Research Institution of SME, pages 193–198.
Niemietz, P., Pennekamp, J., Kunze, I., Trauth, D., Wehrle,
K., and Bergs, T. (2020). Stamping process modelling
in an internet of production. Procedia Manufacturing,
49:61–68.
Peinado-Asensi., I., Montes., N., and Garc
´
ıa., E. (2021).
Towards real time predictive system for mechanical
stamping presses to assure correct slide parallelism.
In Proceedings of the 18th International Conference
on Informatics in Control, Automation and Robotics -
ICINCO,, pages 396–402. INSTICC, SciTePress.
Voss, B., Pereira, M., Rolfe, B., and Doolan, M. (2017). Us-
ing stamping punch force variation for the identifica-
tion of changes in lubrication and wear mechanism. In
Journal of Physics: Conference Series, volume 896,
page 012028. IOP Publishing.
Zhou, C., Liu, K., Zhang, X., Zhang, W., and Shi, J. (2015).
An automatic process monitoring method using recur-
rence plot in progressive stamping processes. IEEE
Transactions on Automation Science and Engineer-
ing, 13(2):1102–1111.
ICINCO 2022 - 19th International Conference on Informatics in Control, Automation and Robotics
176
