
Analysis of Data Quality in Digital Smart Cities: The Cases of Nantes,
Hamburg and Helsinki
José L. Hernández
1a
, Ana Quijano
1b
, Rubén García
1c
, Pierre Nouaille
2
, Lukas Risch
3d
,
Mikko Virtanen
4
and Ignacio de Miguel
5e
1
Energy Division, CARTIF Technology Centre, Parque Tecnológico Boecillo 205, Boecillo, Spain
2
Direction Territoriale Ouest, CEREMA, Rue René Viviani, Nantes, France
3
Senate Chancellary – Department of European Affairs, Free and Hanseatic City of Hamburg, Hamburg, Germany
4
VTT Technical Research Centre of Finland Ltd Espoo, P.O. Box 1000, Finland
5
Optical Communications Group, University of Valladolid, Valladolid, Spain
ignacio.miguel@tel.uva.es
Keywords: Data Quality, Digitalisation, Smart Cities, Data, Completeness, Correctness.
Abstract: The Smart Cities concept is supported by the use of Information and Communication Technologies (ICT),
which enables the digitalisation of the city assets. Then, cities are nowadays driven by data, with a clear
dependency on the data collection approaches. Decisions and criteria for urban transformation therefore rely
on data and Key Performance Indicators. However, one question remains and refers the reliability and
credibility of data that guide the decision-making processes. Many efforts are made in the definition of the
data quality methodologies, but not in analysing the real situation about data collection is smart cities. This
paper applies a methodology to quantitatively analyse the real quality of the data-sets in the cities of Nantes,
Hamburg and Helsinki. This work is under the umbrella of mySMARTLife project (GA #731297). The main
conclusion or lessons learnt is the need for more appropriate methods to increase data quality, instead of
defining new methodologies. Data quality requires improvements to make better informed decisions and
obtain more credible Key Performance Indicators.
1 INTRODUCTION
Nowadays, cities are responsible for more than 60%
of greenhouse gas emissions (Eurostat-a, 2022). To
tackle this issue, the European Commission has
established ambitious plans to reduce the emissions in
55% in contrast to current practices by 2030 (2030
Climate & Energy Framework, 2022), reaching
climate neutrality by 2050.
For than end, cities need a transformation towards
Smart Cities and must integrate multiple perspective
and verticals such as energy, mobility, nature,
economy or water management, among others. All of
them supported by the integration of the Information
a
https://orcid.org/0000-0002-7621-2937
b
https://orcid.org/0000-0002-0366-7375
c
https://orcid.org/0000-0002-0358-8001
d
https://orcid.org/0000-0001-7982-5117
e
https://orcid.org/0000-0002-1084-1159
and Communication Technologies (ICT) (Batty,
2012), approaching digital cities.
Digitalisation relies on data and new technologies
like IoT (Internet of Things) to be able to monitor the
city assets. Nevertheless, main challenges lie in the
quality of the data and, thus, the accuracy and
confidence when making decisions.
Efforts are put on the definition of urban
platforms, acting not only as repository of
information, but ingesting, transforming data, as well
as calculating indicators and exposing useful
information to make better informed decisions. The
mySMARTLife EU project (mySMARTLife, 2022),
with GA #731297, works in this direction. The
project, with more than 150 actions taking place in the
Hernández, J., Quijano, A., García, R., Nouaille, P., Risch, L., Virtanen, M. and de Miguel, I.
Analysis of Data Quality in Digital Smart Cities: The Cases of Nantes, Hamburg and Helsinki.
DOI: 10.5220/0011271900003269
In Proceedings of the 11th International Conference on Data Science, Technology and Applications (DATA 2022), pages 353-360
ISBN: 978-989-758-583-8; ISSN: 2184-285X
Copyright
c
2022 by SCITEPRESS – Science and Technology Publications, Lda. All rights reserved
353

cities of Nantes, Hamburg and Helsinki, aims at
reducing the energy demand of buildings, promoting
e-mobility and creating urban data platforms
following an open specifications framework
(Hernández, 2020). Under the scope of the project, all
the actions must be monitored with real data to extract
conclusions and calculate impacts, making data
quality essential. In this context, this paper presents
quantitative results of real data quality in urban city
platforms (Nantes, Hamburg and Helsinki) through
the application of a methodology developed within
mySMARTLife project.
The paper is organised as follows. Section 2
provides a background about data quality and the
existing analysis techniques. Section 3 describes the
methodology applied in mySMARTLife for data
quality. Section 4 continues with a set of examples
about completeness and correctness of data in the
three cities of Nantes, Hamburg and Helsinki. Section
5 extracts a set of conclusions and future work.
2 BACKGROUND
As it has been already introduced, cities are currently
working on their transformation to become more
resilient and climate neutral. However, how could
anyone determine the level of smartness or carbon
neutrality? The answer to this question is the
application of evaluation frameworks that are driven
by KPIs (Quijano, 2022). The calculation of the
indicators relies on real data, which, due to occasional
gaps, out of range and other errors in the collection
and processing, does not provide useful insights
(Alanne, 2021).Data quality is then crucial, not only
in the assessment, but also in the creation of
intelligent data-driven services (Hassan, 2021).
Data quality indicators could be split into several
groups (Schmidt, 2021):
Integrity, which refers to whether data comply
with structural and technical requirements or
not.
Completeness, which focuses on the avoidance
of data gaps according to the frequency and
expected distribution of data.
Correctness, represented by consistency and
accuracy, which refers to out of range
identification, in other words, error-free data.
Timeliness, i.e., how up to data to data-sets are.
Interpretability, which means the extent to
which data can explain the reality.
Accessibility, which, in the case of smart cities,
is the data availability via open data portals or
APIs (Application Programming Interface).
Interoperability, which is described as the
ability to access and process data from
heterogeneous data sources.
Despite the efforts, data quality is still the main
challenge in the digitalisation of cities, but, the
reliability is questionable due to the data issues (e.g.
communication or infrastructure problems) (Sin
Yong Teng, 2021). Moreover, traceability of the
errors is not easy (Hossein Motlagh, 2020), mainly
taking the big amounts of data being collected into
account. Additionally, there is no consensus about
governance of data (Ender, 2021) and data-sets are
managed in silos, limiting the accessibility (Abraham,
2019).
Having all these aspects in mind, a methodology
to quantify the aforementioned quality indicators has
been defined in the framework of mySMARTLife and
applied in the cities of the project.
3 METHODOLOGY FOR DATA
QUALITY ASSESSMENT
mySMARTLife project has developed urban data
platforms in three lighthouse cities: Nantes, Hamburg
and Helsinki with an open specifications’ framework
and interoperability mechanisms and surveillance
modules. (Hernández, 2020).
Within the methodology approached in the
project, a statistical definition has been followed to
determine the level of quality for data in the urban
platforms, which is qualified by completeness and
correctness indicators defined as follows:
Completeness is calculated as equation 1
Completeness = nc / ne * 100 (1
)
where the number of collected samples (nc) is
the counter of total samples stored in the
databases and the number of samples to be
expected (ne) is calculated as equation 2.
ne= freq * iter * time (2
)
The term freq is the data collection frequency,
while iter is the number of iterations and time
corresponds with the data collection span. For
instance, considering a frequency of 1 minute
along 1 hour, the period factor would be 60
iterations, with a total of expected samples
equal to 60.
Correctness is determined by the values within
the range to be expected, as depicted in
equation 3.
x
min
≤x≤ x
max
(3
)
DATA 2022 - 11th International Conference on Data Science, Technology and Applications
354
Where x
max
= upper limit and and x
min
= lower
limit. Here, the meaning of the values to be
expected should be remarked. In contrast to the
sensor range, which also sets up maximum and
minimum values, the value to be expected is the
one that is a normal quantity, between
reasonable lower and upper limits (x
min
, x
max
respectively). For example, an indoor
temperature sensor could measure -5ºC, which
is inside the physical sensor measurement
range, but it is considered as abnormal value.
In the case of energy meters, usually, these
measure cumulative values, so that infinite is
the maximum value and cannot have negative
values.
As established in the project, data quality
reporting is executed every 6 months, obtaining an
overview of the quality indicators in each data quality
report which helps to identify how suitable are data
collected for the KPIs calculation. Within each report,
if a data-set is identified as non-compliant with the
completeness and correctness criteria, granularity of
data report is reduced (i.e. from the 6-months
aggregation to monthly values) to determine the
reasons of the deviations with respect to the quality
criteria.
According to the timeline of mySMARTLife, data
collection started in December 2019, when the
interventions in the three cities finished (although
some actions present delays in the implementation).
Six reports are expected to be delivered during
mySMARTLife project duration.
1st report (Dec‘19-May‘20)
2nd report (June‘20-Nov‘20)
3rd report (Dec‘20-May’21)
4th report (Jun'21-Nov'21)
5th report (Dec’21-May’22)
6th report (June’22-Sept’22)
Four of them are reported at the time of writing
this paper and while the first three reports have been
fully analysed, only initial insights of the fourth report
are included.
According to (Araújo, 2017), it should be
indicated that data completeness can be below 100%,
being 80% a reasonable threshold to consider data as
compliant with quality requirements. mySMARTLife
has slightly resized this number and a traffic light
analysis has been performed where values of
completeness lower than 75% are considered non-
valid, values with more than 90% are very high-
quality data, whereas between 75% and 90% are
considered with enough quality for further KPI
calculation.
4 CASES OF NANTES,
HAMBURG AND HELSINKI
As introduced, around 150 actions have been
implemented in the three lighthouse cities in the
mySMARTLife project: Nantes (France), Hamburg
(Germany) and Helsinki (Finland) under the pillars
energy, mobility and ICT. Table 1 summarises the
type of project interventions in which data quality
method is applied.
Table 1: Lighthouses interventions in energy and mobility
pillars.
Category Interventions
Buildings High-performance districts for
Retrofitted and New buildings
Energy
systems
Digital boilers, PV, Organic PV films,
Hybrid solar power, Batteries
City
infrastructure
District heating with RES, Hydrogen
injection in district heating, Solar
power plant, Wind farm with storage,
Waste heat, Smart heating islands,
Heat pumps, Smart lighting
e-Mobility
Electrification of public fleet (XXL
eBus, Autonomous bus, e-cars, e-
bikes), Car sharing
Charging
infrastructure
Solar road, Smart/fast/renewable
charging stations
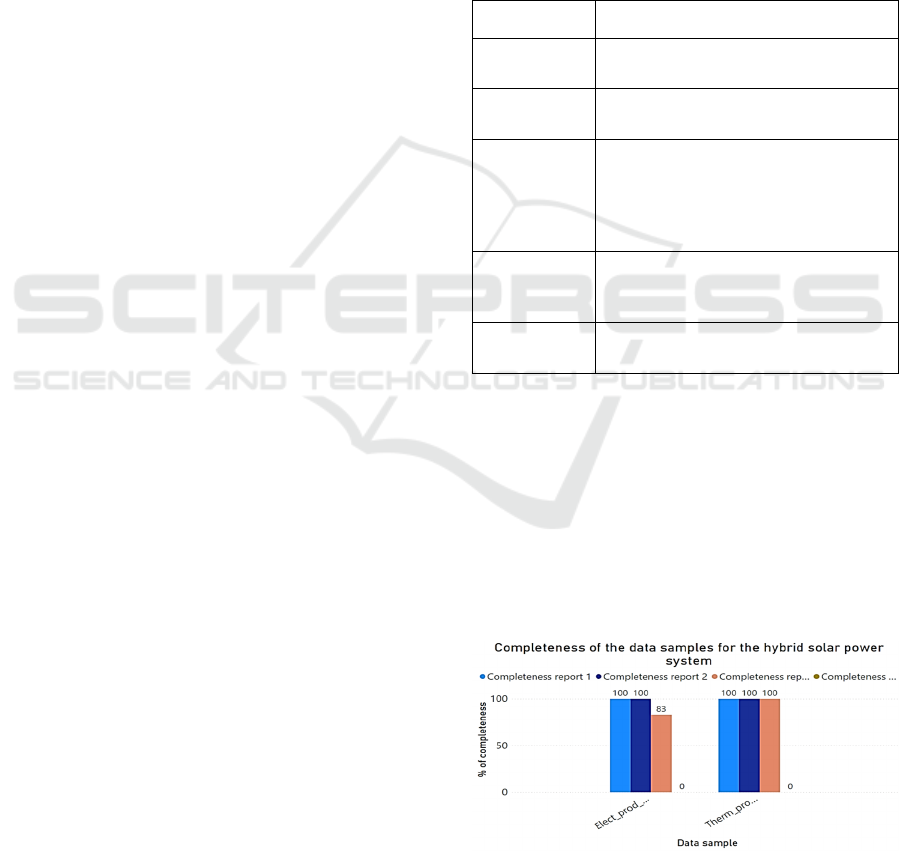
4.1 Nantes
The first batch of interventions selected comprises the
hybrid solar power system plus the retrofitting of
individual houses. This intervention consists of two
data-sets: renewable production by the panels in
electricity (i.e. elec_prod_ind_houses) and domestic
hot water (i.e. therm_prod_ind_houses). Figure 1
depicts the completeness along the four periods. It can
be observed as the two initial periods cover 100% of
Figure 1: Analysis of data completeness during the 4 reports
for the intervention of hybrid solar power system in Nantes.
Analysis of Data Quality in Digital Smart Cities: The Cases of Nantes, Hamburg and Helsinki
355
samples, while third period reduces the electricity
production to 83% and fourth period is empty. This
picture highlights the requirements in terms of
surveillance systems to generate alarms for avoiding
data losses as it is the case.
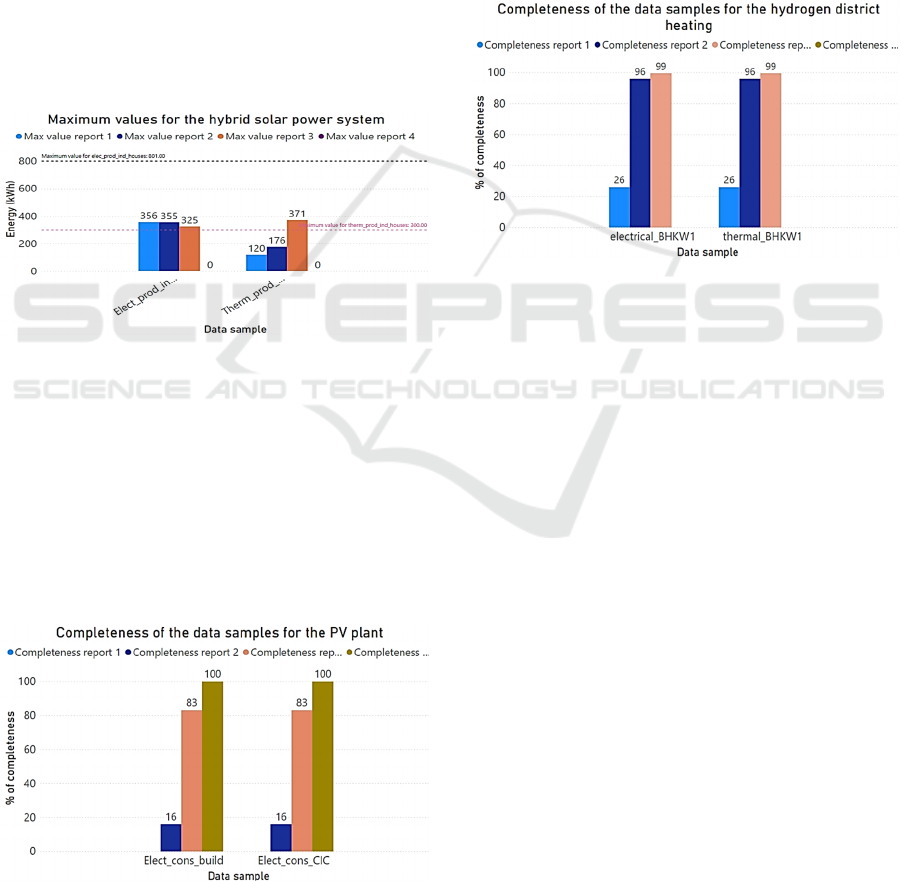
In terms of correctness, energy monitoring
production relies on energy meters, which, as
explained before, are cumulative and it should be only
checked that they are not negative. In this perspective,
Figure 2 represents the maximum values for each of the
periods (except the fourth one that does not contain any
data sample). In dashed black, the maximum expected
production for electricity and, in dashed pink, the
maximum expected thermal production. It can be
extracted that electricity production is less than the
expected maximum value; therefore, working as
expected. Nevertheless, thermal production exceeds
the maximum expected value in report #3.
Figure 2: Data range of the hybrid power system variables
in Nantes.
Another example is related to PV (Photovoltaics)
plants and displayed in Figure 3, which is very
common in smart cities data collection. The first
report is empty due to the delays in the intervention,
but progressively, data completeness increased,
reaching 100% in the fourth report. This is the typical
schema, where first years entail the commissioning of
the monitoring systems (SmartCities Marketplace,
2018).
Figure 3: Data completeness analysis during the 4 reports
for the intervention of PV plant in Nantes.
4.2 Hamburg
Starting with the intervention related to the hydrogen-
based district heating, it can be observed that the
behaviour is similar to the PV plant in Nantes. As
already explained, according to the Smart Cities
Marketplace (SmartCities Marketplace, 2018), first
years are focused on the calibration of the sensors and
systems, which is perfectly observed in Figure 4. The
first report only contains 26% of the data samples, but
second and third reports increase up to 96% and 99%,
respectively. The fourth report is not documented;
therefore, no statistical analysis is available.
Figure 4: Data completeness analysis of the data-set for the
hydrogen-based district heating in Hamburg.
Due to the nature of the meter for the hydrogen-
based district heating, i.e. cumulative values,
extracting the maximum values range is not valuable.
That is to say, cumulative meters provide appended
values, i.e. summing the new value over the previous
one and instantaneous energy values can be only
obtained by subtracting consecutive samples. Then,
these measurements can reach infinite values and that
is the reason why the analysis of correctness,
complementary to the completeness, of this specific
action is not included here. In this line, an interesting
case is the one of the PV on roofs. This intervention
comes from previous years and just integrated data
into the digital urban platform. That is the reason why
100% completeness is achieved along the four
reports. However, in terms of maximum values, as
depicted in Figure 5, all the reports exceed the
maximum value for the generated electrical energy of
the PV. The reason is a slight change in the
configuration parameters than those from the original
design, allowing the detection of this misalignments
or mismatching. In other words, without the
application of this quality assessment procedure, this
error probably would have never been detected.
DATA 2022 - 11th International Conference on Data Science, Technology and Applications
356
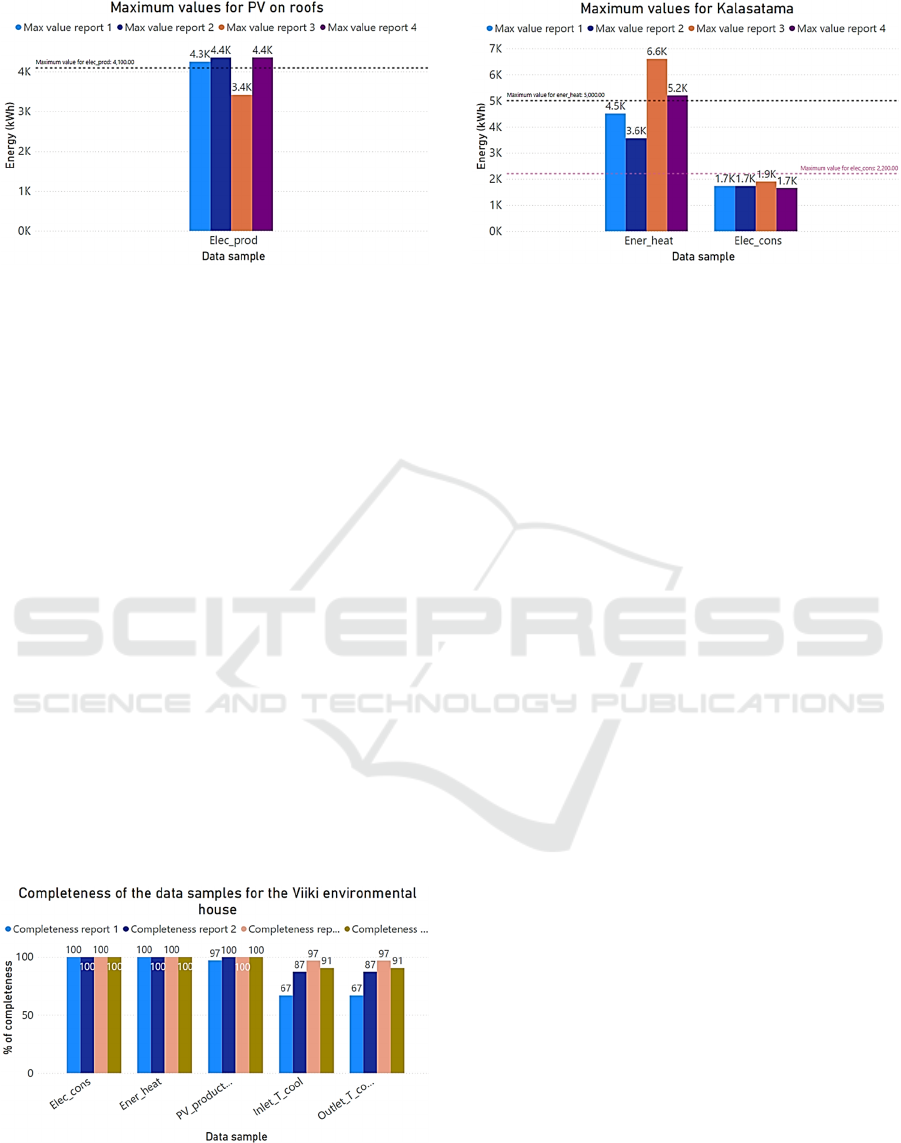
Figure 5: Data range of the PV on roofs electricity
generation in Hamburg.
4.3 Helsinki
The first selected action to illustrate the data quality
in Helsinki is the Viikki environmental house. It
consists of five variables, as observed in Figure 6. It
is worth to mention this Viikki house stated its
monitoring prior to the project, while new energy
management strategies and geothermal pumps are
part of the mySMARTLife context. Moreover, this
building is considered as one of the most energy
efficient office buildings in Helsinki. These are the
reasons why there are very high values since the
beginning of the data collection for the total
electricity and thermal consumption, as well as PV
production. However, it is a good example to
demonstrate that there are no error-free data
collection approaches. The new variables introduced
within the project refer to the inlet and outlet
temperatures of the geothermal system. As expected,
similar to previous examples, data completeness is
higher each report, but the last report reduces the
percentage of completeness due to communication
errors in data transmission.
Figure 6: Data completeness analysis of the data-set for the
Viiki environmental house in Helsinki.
Figure 7: Data range of the Kalasatama high-performance
district in Helsinki.
In terms of correctness, the Kalasatama high-
performance district intervention, illustrated in Figure
7, is selected and shows the case of out of range
values, but these cannot be considered low quality. As
it has been explained in the methodology, maximum
and minimum values are expected according to the
experience. In this specific case, the building demand
is known, but the effects of COVID-19 are
highlighted. Figure 7 depicts the exceed of the
building heating energy consumption during 3
rd
and
4
th
periods, when the Nordic COVID-19 strategy
encouraged working at home when possible. This
implies the increase of energy use to achieve comfort
along the entire day, incrementing the required
thermal energy. It is then clear that these values
cannot be classified as low-quality values, but
abnormal, which is the main objective of the data
quality approach. That is to say, not only discarding
data-set, but finding evidences of non-expected
behaviours as the case of Kalasatama.
5 DISCUSSION
Data quality is pivotal to make accurate decisions and
calculate KPIs when evaluating performance of city
interventions. Data quality methodologies are
developed with high interest in the research field.
However, real status of the data quality should be
investigated. This is the case of the analysis
performed in this paper in the three cities of Nantes,
Hamburg and Helsinki. In this line, the need to put
efforts in better data collection approaches should be
remarked.
According to the Smart Cities marketplace
monitoring guide (SmartCities Marketplace, 2018),
real data quality is not reached until one year and a
half have passed since the end of the interventions.
Figure 8 draws the stages that are set along the time.
Analysis of Data Quality in Digital Smart Cities: The Cases of Nantes, Hamburg and Helsinki
357
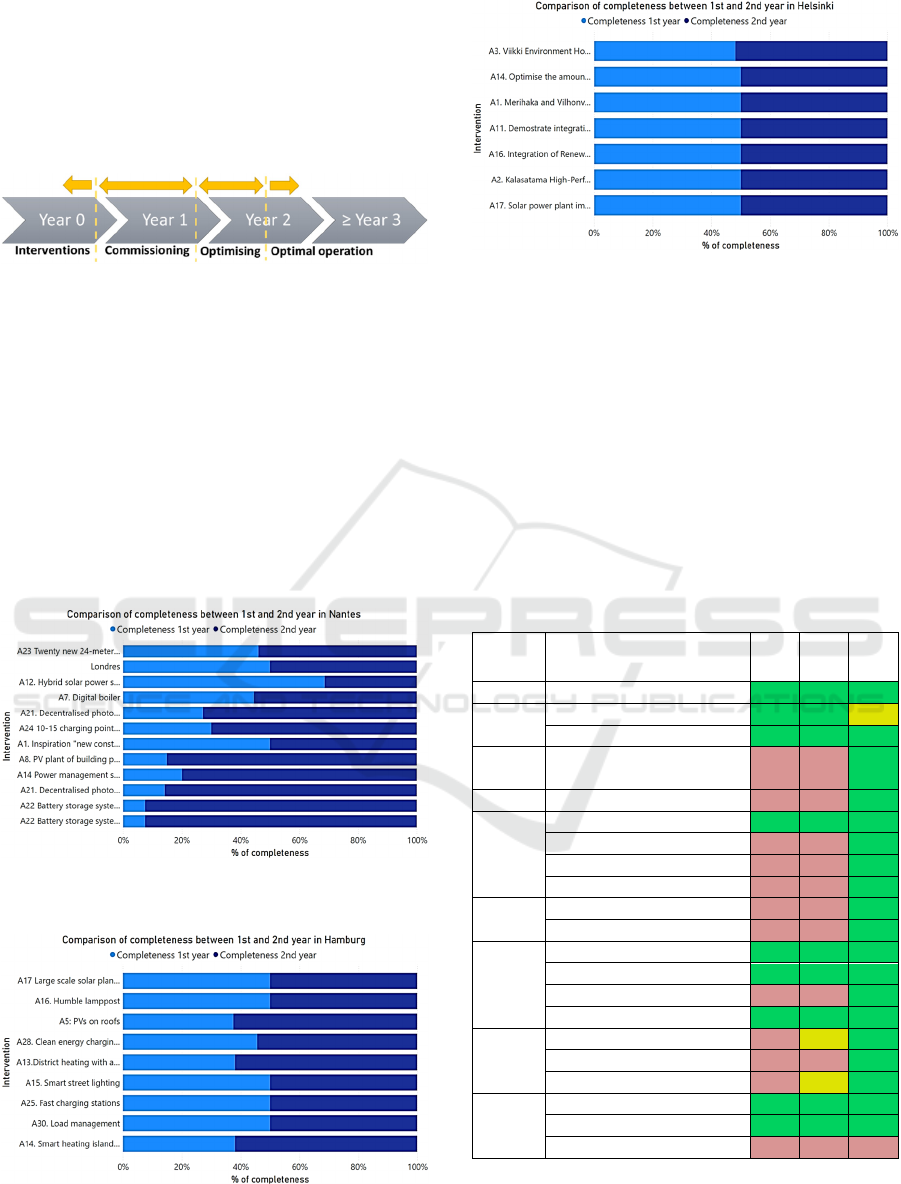
While year 0 is considered as the finalisation of the
interventions, year 1 is related to the commissioning,
when data collection is being polished and errors or
bugs are being corrected. From the beginning of the
year 2 to mid-year, the optimisation of the data
gathering process is conducted and, since second year
and a half, the optimal operation is expected.
Figure 8: Smart Cities marketplace monitoring guide.
This is exactly the case of mySMARTLife project.
As illustrated in Figure 9, Figure 10 and Figure 11,
the increase of quality from first year to second year
is notable. In Nantes, it can be observed as the second
year (dark blue) for the interventions contributes
more than the 50% of the quality, while first year
quality is very limited. Hamburg shows something
similar, although, in this case, the increment has been
lower (i.e. better performance during first year). In
contrast, Helsinki offers similar numbers during both
years analised, mainly due to the reason that many
actions were monitored before mySMARTLife.
Figure 9: Comparison of the data completeness during years
1 and 2 for the interventions in the city of Nantes.
Figure 10: Comparison of the data completeness during
years 1 and 2 for the interventions in the city of Hamburg.
Figure 11: Comparison of the data completeness during
years 1 and 2 for the interventions in the city of Helsinki.
Finally, as introduced in the methodology, a three-
range assessment is made for the data completeness
of the three cities. Table 2 collects the results for
Nantes actions (numbered) during the first year
(reports R1 and R2) and a half (third report R3),
which evidences the previous sentence about the
increase of data quality along first year. Not all the
actions are included, discarding those with delays
and; therefore, not reported.
Table 2: Analysis of the completeness according to the
established ranges in the methodology for the Nantes
actions during the three first reports (R1, R2 and R3).
Action Data sample R1 R2 R3
A1 Ener_dem_DH 100 100 100
A12
Elect_prod_ind_houses
100 100 83
Therm
_p
rod
_
ind
_
houses 100 100 100
A14 &
A27
Elect_cons_charg_stat
0 50 100
A21a Elec_pro
d
0 33 100
A21b
Elect
_
in
j
ection 100 100 100
Elect
_
cons
_
buil
d
0 33 100
Elect_injection 0 33 100
Elec_pro
d
0 33 100
A22 &
A27
Elect_bat
0 16 100
Elect
_
stored
_
batt 0 16 100
A23a
Dist
_
ebus 100 100 100
Ener
_
cons
_
ebus 100 100 100
Nb_pass_ebus 50 33 100
Nb_trips_ebus 100 100 100
A24
Charg_stat_uptime_ebus
0 83 100
Ener
_
deliv
_
ebus 40 42 90
Nb
_
char
g_
o
p_
ebus 0 83 100
A7
DHW
_
cons 100 100 100
qDHW 100 100 100
Elect_cons_build_PL 0 0 0
In the case of Hamburg (
Table 3
), data
completeness observed demonstrates an increment in
specific actions. There are cases with 100% of
DATA 2022 - 11th International Conference on Data Science, Technology and Applications
358
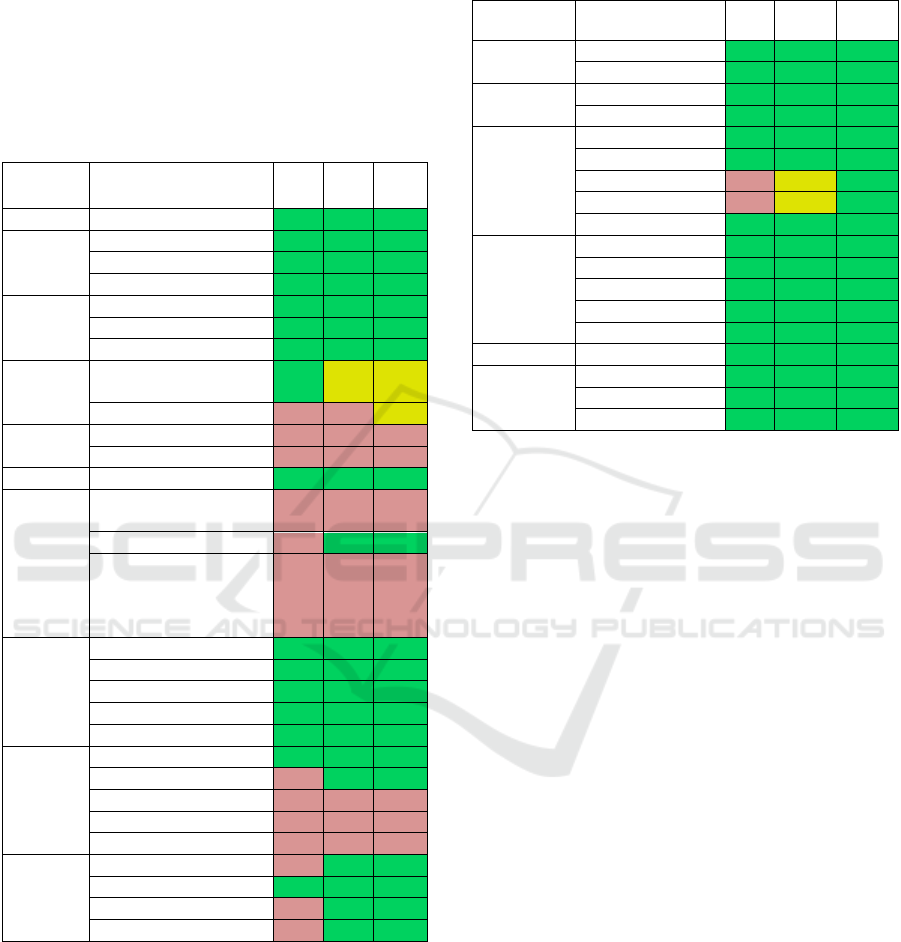
completeness already due to monitoring starting
before the reporting. Anyway, many of the actions are
green or yellow lights during the third report (R3)
with some minor exceptions for data samples, which
also demostrates the incremental data quality in smart
cities.
Table 3: Analysis of the completeness according to the
established ranges in the methodology for the Hamburg
actions during the three first reports (R1, R2 and R3).
Action Data sample R1 R2 R3
A15 Elect_cons_pub_light 100 100 100
A16
Elect
_
cons
_p
ub
_
li
g
ht 100 100 100
Elect
_
cons
_p
ub
_
li
g
ht 100 100 100
Elect
_
cons
_p
ub
_
li
g
ht 100 100 100
A25
Ener_deliv_fast
100 100 100
Nb_charg_op_fast 100 100 100
Nb_diff_users 100 100 100
A28
Ener_deliv_charging
p
oint
90 86 86.7
ev-status 64 55 88.8
A3
Elec_co
m
0 0 0
Ener
_
heat
_
use 0 0 0
A30a Ener
_
deliv
_
fleet 100 100 100
A19a-b
1.OG - R.129 -
Zulüfter - Leistun
g
0 0 0
PV Prod.
(
kWh
)
33 100 100
Stromzähler -
Propangas
Kältemaschine (2Q1)
- Leistung
0 0 0
A17 &
A20
Elec
_p
rod
_
WT1 100 100 100
Elec
_p
rod
_
WT2 100 100 100
Elec
_p
rod
_
WT3 100 100 100
Elec_prod_WT4 100 100 100
Elec_prod_WT5 100 100 100
A5
Elec
_p
ro
d
100 100 100
Elec
_p
ro
d
50 100 100
Elec
_p
ro
d
0 0 0
Elec_pro
d
0 0 0
Elec_pro
d
0 0 33
A13 &
A18
electrical_BHKW1
26 96 99.4
electrical
_
BHKW2 97 96 99.4
g
as
_
BHKW1 26 96 99.4
g
as
_
BHKW2 26 96 99.4
Finally, Helsinki, which already was highly
digitalised, demonstrates that more mature cities in
monitoring strategies can reach very valuable values
in terms of data quality, hence, better-informed
decisions. Table 4 is almost green with the exception
for the new data samples introduced in the project,
which follow the same trend as explained before.
Table 4: Analysis of the completeness according to the
established ranges in the methodology for the Helsinki
actions during the three first reports (R1, R2 and R3).
Action Data sample R1 R2 R3
A1
Elec_cons
100 100 100
Ener
_
heat 100 100 100
A2
Elec
_
cons 100 100 100
Ener
_
heat 100 100 100
A3
Elec_cons
100 100 100
Ener_heat 100 100 100
Inlet_T_cool 67 87.2 96.8
Outlet
_
T
_
cool 67 87.2 96.8
PV
_p
roduction 97 99.98 99.99
A14 &
A16
DC_consumption 100 100 100
DC_pro
d
100 100 100
DH_consumption 100 100 100
DH
_p
rod 100 100 100
DC
_p
rod
_
HP 100 100 100
A16 DH
_p
rod
_
HP 100 100 100
A17 &
A18
PV_production1
100 100 100
PV_production2 100 100 100
PV_production3 100 100 100
To summarize, after having received four raw
quality reports, 39% of the actions reach at this early
stage more than 12 months of high-quality data and
47% of actions report lower values for completeness
and correctness. The remaining 14% of the actions
refer to those interventions with deviations and later
starting monitoring date. Therefore, it was not
possible to report them yet during the periods of this
preliminary analysis of data quality.
6 CONCLUSIONS
Smart Cities are not only the future but the present.
Therefore, transformation plans for more liveable
spaces and more efficient cities are required.
Decisions should be made on the basis of real and
reliable data. Nevertheless, data, when available,
usually lacks of enough quality to make rationale
decisions.
On the other hand, digitalisation of cities is slowly
progressing and quality checks are not periodically
carried out. This paper aimed at assessing the real
data quality in cities, focused on the three cities of
Nantes, Hamburg and Helsinki. Methodologies are
wide and diverse, but these are not being
implemented properly. In this sense, the major lesson
learnt is the necessity of establishing the grounds
since design. The mySMARTLife project already
considered data quality when defining the open
Analysis of Data Quality in Digital Smart Cities: The Cases of Nantes, Hamburg and Helsinki
359

specifications framework through the interoperability
mechanisms and surveillance modules.
Even though efforts have been made in the
project, this study shows that data quality procedures
should not simply be implemented, but follow-up
processes are required. Having this in mind,
mySMARTLife established 6-month periodic
analysis of data, extracting qualitative values of data
quality for two main indicators: correctness and
completeness. In terms of correctness, out of range
values allow identifying abnormal situations in the
performance of the energy systems, mobility facilities
or city infrastructures. Moreover, completeness
indicates the data gaps to provide credible and
reliable results.
The three cities demonstrate that maturity levels
in the digitalisation processes are critical. Helsinki,
more advanced in digitalisation, already reports very
high data quality indicators. Nantes and Hamburg
provided a reduced data quality in the analysis
performed, but with good values considering that the
first year of data collection usually requires
corrections and commissioning activities. After the
first year, data quality increases, leveraging data
platforms to gather raw data, obtaining information
and, thus, extracting knowledge. mySMARTLife
project is currently analysing the 4
th
report, although
some results have been shown along the paper.
Additionally, two additional reports are planned for
the next stages of the project. That is to say, the future
plan is to continue analysing data quality to extract
best practices in the assessment methods.
ACKNOWLEDGEMENTS
Authors would like to thank the mySMARTLife
consortium and rest of partners involved in the project
for the support. Also, the authors would like to thank
the European Commission for funding the project
under GA #731297 of the H2020 programme.
REFERENCES
EUROSTAT-a. Statistics on European cities. [online]
https://ec.europa.eu/eurostat/statistics-
explained/index.php?title=Statistics_on_European_citi
es. Accessed on 21st February 2022.
EU Research and Innovation. (2018). Final Report of the
High-Level Panel of the European Decarbonisation
Pathways Initiative; European Commission.
2030 Climate & Energy Framework. Available online:
https://ec.europa.eu/clima/policies/strategies/2030_en.
Accessed on 22nd February 2022.
Batty, M., Axhausen, K.W., Giannotti, F. et al. (2012).
Smart cities of the future. Eur. Phys. J. Spec. Top. 214,
481–518.
Hernández, J.L.; García, R.; Schonowski, J.; Atlan, D.;
Chanson, G.; Ruohomäki, T. (2020). Interoperable
Open Specifications Framework for the
Implementation of Standardized Urban Platforms.
Sensors, 20, 2402. https://doi.org/10.3390/s20082402.
mySMARTLife project. GA #731297, [online]
https://www.mysmartlife.eu/mysmartlife/, accessed on
22nd February 2022.
Quijano, A.; Hernández, J.L.; Nouaille, P.; Virtanen, M.;
Sánchez-Sarachu, B.; Pardo-Bosch, F.; Knieilng, J.
(2022). Towards Sustainable and Smart Cities:
Replicable and KPI-Driven Evaluation Framework.
Buildings, 12, 233.
Alanne, K. and Sierla, S. (2021). An overview of machine
learning applications for smart buildings, Sust. Cities
Soc., vol. 76, p. 103445.
Hasan, Z. and Roy, N. (2021). Trending machine learning
models in cyber-physical building environment: A
survey, WIREs Data Mining and Knowledge Discovery,
vol. 11, no. 5, p. e1422.
Schmidt, C.O., Struckmann, S., Enzenbach, C. et al. (2021).
Facilitating harmonized data quality assessments. A
data quality framework for observational health
research data collections with software
implementations in R. BMC Med Res Methodol 21, 63.
Sin Yong Teng, Michal Touš, Wei Dong Leong, Bing Shen
How, Hon Loong Lam, Vítězslav Máša. (2021). Recent
advances on industrial data-driven energy savings:
Digital twins and infrastructures, Renewable and
Sustainable Energy Reviews, Vol. 135, 110208.
Hossein Motlagh, N.; Mohammadrezaei, M.; Hunt, J.;
Zakeri, B. (2020). Internet of Things (IoT) and the
Energy Sector. Energies, 13, 494.
L. Ender, (2021). Data Governance in Digital Platforms: A
case analysis in the building sector, Dissertation.
Abraham, R., Schneider, J., Vom Brocke, J. (2019). Data
governance: A conceptual framework, structured
review, and research agenda. International Journal of
Information Management, 49, pp. 424-438.
Open Geospatial Consortium. (2019). OGC SensorThings
API Part 1 Sensing Version 1.1.
Araújo, T. B., Cappiello, C., Kozievitch, N. P., Mestre, D.
G., Pires, C. E. S., & Vitali, M. (2017). Towards reliable
data analyses for smart cities. In Proceedings of the 21st
International Database Engineering & Applications
Symposium (pp. 304-308).
SmartCities Marketplace. (2018). Technical Monitoring
Guide. Technical report. European Commission.
DATA 2022 - 11th International Conference on Data Science, Technology and Applications
360
