
Exploratory Analysis of Chat-based Black Market Profiles with
Natural Language Processing
Andr
´
e B
¨
usgen
1
, Lars Kl
¨
oser
1
, Philipp Kohl
1
, Oliver Schmidts
1
, Bodo Kraft
1
and Albert Z
¨
undorf
2
1
FH Aachen University of Applied Sciences, Germany
2
University of Kassel, Germany
Keywords:
Clustering, Natural Language Processing, Information Extraction, Profile Extraction, Text Mining.
Abstract:
Messenger apps like WhatsApp or Telegram are an integral part of daily communication. Besides the various
positive effects, those services extend the operating range of criminals. Open trading groups with many
thousand participants emerged on Telegram. Law enforcement agencies monitor suspicious users in such chat
rooms. This research shows that text analysis, based on natural language processing, facilitates this through
a meaningful domain overview and detailed investigations. We crawled a corpus from such self-proclaimed
black markets and annotated five attribute types products, money, payment methods, user names, and locations.
Based on each message a user sends, we extract and group these attributes to build profiles. Then, we build
features to cluster the profiles. Pretrained word vectors yield better unsupervised clustering results than current
state-of-the-art transformer models. The result is a semantically meaningful high-level overview of the user
landscape of black market chatrooms. Additionally, the extracted structured information serves as a foundation
for further data exploration, for example, the most active users or preferred payment methods.
1 INTRODUCTION
Digitalization enables people to communicate every
time and everywhere. The form varies from struc-
tured webshops in the business-to-customer domain
to natural-language-based conversation via messenger
apps. Nine out of ten Germans use the latter daily
(DataReportal and GlobalWebIndex, 2021; Bitkom,
2018). The results in (GlobalWebIndex, 2021) indi-
cate an increase during the Covid-19 pandemic.
While the broad reach of such apps facilitates daily
communication, it also offers such opportunities to
criminals (Blankers et al., 2021). This research ana-
lyzes data from self-proclaimed black market groups,
which we refer to as black markets, from the Telegram
1
messenger service. These public groups allow vendors
and potential buyers to broadcast their offerings and
demands. Offerings range from legally sold used items
to unauthorized streaming accounts or counterfeit con-
sumer goods. The high number of messages
2
makes a
well-founded human analysis and criminal prosecution
challenging and labor-intensive.
1
https://telegram.org/
2
We crawled
88, 380
messages from the 6th July 2020
to the 22nd October 2020
Our methodology provides a practical framework
for data exploration on conversational data. We ex-
tract product details from messages and create vendor
profiles based on that information. Besides general
information about offerings, we cluster users and auto-
matically assign meaningful cluster names. Figure 1
illustrates our processing pipeline.
We apply information extraction techniques from
natural language processing (NLP) to extract sale at-
tributes and create feature vectors for user profiles.
Sale attributes are products, prices, payment methods,
user names, and locations. A rule-based approach
merges detected attributes in messages to profiles.
We introduce vector representations for these profiles
and apply clustering to generate a high-level market
overview. Using our approach, law enforcement agen-
cies can identify and analyze specialized groups of
people selling mainly illegal things (e.g., driver’s li-
censes).
Our research aims to provide a foundation for both
researchers and practitioners to gain further insights
into the contents of chat groups. We propose a pro-
cessing pipeline and discuss each design decision in
detail. Further, we report our workload and estimate
the reached quality of our methodology. In summary,
our main contributions are:
Büsgen, A., Klöser, L., Kohl, P., Schmidts, O., Kraft, B. and Zündorf, A.
Exploratory Analysis of Chat-based Black Market Profiles with Natural Language Processing.
DOI: 10.5220/0011271400003269
In Proceedings of the 11th International Conference on Data Science, Technology and Applications (DATA 2022), pages 83-94
ISBN: 978-989-758-583-8; ISSN: 2184-285X
Copyright
c
2022 by SCITEPRESS – Science and Technology Publications, Lda. All rights reserved
83

Figure 1: Methodology process visualization: Based on the messages extracted from Telegram, we perform a named entity
recognition (NER) to label all domain-relevant text spans (products, prices, etc.). The preparation and the training process
are discussed in Section 3 and Subsection 4.1. We use the messages’ metadata, and our extracted text spans to aggregate
all information about a user to a profile. Finally, we cluster these profiles with standard algorithms (see Subsection 4.3) and
propose a method to find a cluster name automatically.
1.
We crawled and annotated a corpus with German
text messages from self-proclaimed black market
groups. We provide entity annotations to train
an entity extraction model and additional annota-
tions to evaluate the product-price mapping and
the product features.
2.
Conception and evaluation of a domain-specific
text analysis pipeline. We discuss each design
decision in detail and provide micro and macro
evaluations.
3.
We show that pretrained word vectors yield better
results in our unsupervised clustering task than
current state-of-the-art transformer models.
To reproduce the contributions, we publish our
source code and data in a public GitHub repository
3
.
2 RELATED WORK
Social media platforms offer custom forms of commu-
nication. Traditionally users can connect with each
other, like users following each other on Instagram or
Twitter. These interactions allow an analysis based
on the resulting network graph structure. Messenger
services like WhatsApp or Telegram focus on textual
interactions in groups or private one-to-one chats. In
both cases, the social micro and macrostructure offer
valuable information (Vogt et al., 2021).
The graph resulting from friendship or follows
relations in social networks reveals fundamental so-
cial properties. Dense areas in a network graph are
called communities. Approaches like (Li et al., 2021;
Peng et al., 2021) introduce community detection algo-
rithms to reveal intertwined substructures in network
3
https://github.com/Abuesgen/
Clustering-of-Vendor-Profiles
graphs. (Gomathi, 2018) combine network represen-
tations with NLP features such as text similarity to
detect fake Twitter users. These communities often
contain like-minded or otherwise correlated people
(Newman, 2006). The black market groups are primar-
ily broadcast platforms and do not provide these graph
structures. Therefore, we need to analyze the message
content to cluster user profiles.
The high popularity of messenger services entails
research interests from different directions. The sur-
veys in (Subhashini et al., 2021) or (Xu and Lockwood,
2021) focus on user intents in conversations to gain
insights into user behavior and optimize business-to-
customer communication. (Tigunova et al., 2019; Pei
et al., 2021) extract attributes from text to create or
extend user profiles. Both approaches create profiles to
increase the user experience in dialog systems. Instead
of latent intent information, our system extracts and
aggregates explicit knowledge.
(Frisoni et al., 2020) introduces descriptive text
mining. They refer to relations between domain-
specific concepts, such as disease and treatment as
phenomena, and extract those together with their sta-
tistical relevance. Their methodology is unsupervised.
In contrast, we introduce a supervised methodology
to extract information and focus on static predefined
semantic structures in messages.
During the Covid-19 pandemic, Telegram became
a popular communication medium. (Dargahi Nobari
et al., 2020) investigate the characteristics of the in-
formation flow in Telegram. Users forward so-called
viral messages from large public channels to other
public or private conversations. The mentioned paper
analyzes the characteristics of messages and channels
that affect viral messages. (Blankers et al., 2021) in-
vestigates how people trade illegal substances via Tele-
gram. They describe the impact of a lock-down or
other pandemic-related events on the market. Our re-
DATA 2022 - 11th International Conference on Data Science, Technology and Applications
84

search does not focus on specific products but aims to
cluster sellers according to their product portfolio. Our
methodology offers a general framework for practical
data exploration in large chats.
Like our approach, the analysis of dark-web mar-
kets aims to gain insights into non-regulated trad-
ing. The main focus are services accessible via the
anonymity network TOR
4
. (Griffith et al., 2017; Zabi-
himayvan et al., 2019) show that the web of TOR’s
onion services is a general sparse and hub-dominated
network. (Baravalle et al., 2016; Christin, 2013) ana-
lyze big markets in this network. While both papers
focus on offered products, (Zheng et al., 2021) create
profiles of buyers. All mentioned approaches crawl
structured data from such websites and analyze the
essential market characteristics, such as price stability,
product catalog, or buyer behavior. Our research deals
with transforming unstructured text messages into a
predefined data scheme.
We use NLP techniques to detect product-related
attributes and create user features for clustering. We
apply named entity recognition (NER) to locate rel-
evant attributes. Classical NER systems reduce the
problem to a sequence labeling problem and use ar-
tificial neural networks to assign labels. Many cur-
rent state-of-the-art approaches use pretrained trans-
former networks, as introduced in (Devlin et al., 2019;
Vaswani et al., 2017), as fundamental network compo-
nents (Schweter and Akbik, 2021; Wang et al., 2021).
(Sang and De Meulder, 2003; Benikova et al., 2014)
introduced German NER datasets. While these text
corpora contain mainly newspaper articles, we deal
with partially semi-structured and social media texts.
3 CORPUS CREATION
The following section explains our data collection ap-
proach, the annotation process, and common corpus
statistics.
We focus on four public Telegram German black
market groups (see Section 1). These groups were
closed in the meantime. Thus, researchers cannot col-
lect the data anymore, but new groups emerge contin-
uously. Telegram offers an API
5
to collect data from
chats.
The term user combines vendors and buyers in the
following. To support law enforcement agencies, we
focus on users frequently participating in the groups.
4
https://www.torproject.org/
5
https://core.telegram.org/api
Paypal or Bitcoins
Prices incl. shipping
T-Shirts : 20€
Joggingsuit: 50€
…
For further info and orders @Bellojohn
…
…
Figure 2: Translated message for a typical product offering.
The message shows information on products with prices,
payment methods, shipping, and user information. Listing 1
shows the corresponding API response’s schema.
3.1 Data Analysis
Figure 2 shows a translated example of a typical offer-
ing. The message does not contain continuous text but
an enumeration of products, prices, payment methods,
and shipping information. In general, emojis support
the given information in different ways:
•
Highlight information (see emergency lights in
Figure 2),
• substitute text spans (e.g., C with a banknote), or
•
serve as eye-catcher: conspicuous sequence of
emojis to direct the customer’s attention to the
message.
Telegram enables users to mention themselves or
others with an @ sign: @Bellojohn represents the
pseudonymized contact person for this offering. The
mentions represent a hyperlink directly to the user’s
Telegram profile for quickly starting private conversa-
tions. Apart from offering this feature, users do not
always use it. Thus, we also face users solely writing
the user names. In our annotated corpus,
72%
of the
users follow the @-mention style - corresponding
28%
write names.
The typical social media challenges (Vajjala et al.,
2020) apply to Telegram messages: slang, informal,
ambiguous language, spelling mistakes, emojis, non-
continuous text, and neologisms. Beyond these, we
observe the following challenges:
•
Non-uniform product names: different sellers offer
the same products with different names. E.g., Spo-
tify account and Spotify subscription or Spotify
plays and Spotify views.
•
Closely related products: sellers offer several ser-
vices for one platform, increasing the complexity
of classifiers. E.g., Spotify account, views, plays,
subscriptions, etc., which fit in different categories.
Account and subscription belong to accounts (cre-
dentials), where views and plays are services (e.g.,
via botnet) to push an artist.
Exploratory Analysis of Chat-based Black Market Profiles with Natural Language Processing
85

Table 1: The relative and absolute amount of data points in
train development and test datasets with the corresponding
number of tokens.
Split Ratio # Samples # Tokens
Train 0.70 1,794 39798
Dev. 0.15 385 9271
Test 0.15 384 8291
Full 1.00 2,563 57360
•
Product tariffs: One product can have different
prices for different tariffs (periods), making map-
ping prices to products more complex. E.g., Nord-
VPN 1 Year 2,50
C
/ 2 Years 3,50
C
/ 3 Years 4,50
C
.
3.2 Training Preparation
We collected
88, 380
data points from four different
chat rooms over
107
days (6th July 2020 until 22nd
October 2020).
60, 068
of these messages solely rep-
resent media content (photo, videos, or audio). The
following analysis focuses on the remaining
28, 312
text messages for further processing. For informa-
tion extraction approaches (see Subsection 4.1), we
randomly sampled
2, 563
documents from the union
of the four chat rooms’ text messages. The products
traded in the groups with prices, accepted payment
methods, locations, and users are relevant attributes
for further analysis. Thus, we labeled five entity types
with three annotators
6
:
•
Product (PROD): Represents all offered or wanted
products and services.
•
Money (MONEY): Labels the amount of a pay-
ment method without currency (ten, 10, etc.).
•
Payment Method (PAYM): Denotes the payment
method traders accept (PayPal, Bitcoin, cash, etc.).
•
Person (PER): All mentions of persons via ordi-
nary names or Telegram mentions (@username).
•
Location (LOC): Existing, geographic location,
hinting domicile or delivery location.
We annotated the test set three times with each
annotator to compute an inter-annotator agreement.
We achieve an agreement of
0.61
following Krippen-
dorff’s alpha (Krippendorff, 2012)
7
. We have no inter-
annotator agreement information for the train and de-
velopment set.
The random data split (see Table 1 and Figure 3)
results in equally distributed labels across the datasets.
6
In summary, the annotation of the corpus took 48
person-hours
7
We compute the nominal alpha value for each message
and use the average as a dataset measurement.
train dev test
0
0.2
0.4
0.6
0.8
1
label
PER
LOC
PAYM
MONEY
PROD
dataset
amount in %
Figure 3: The relative label frequencies are similar across
the datasets. This indicates a common underlying data distri-
bution.
We use the datasets to train named entity recognition
models (see Subsection 4.1). These models facilitate
the sale attributes’ extraction of all
28, 312
messages
(see Figure 1 b)). A detailed description of the process
follows in Section 4.
The Telegram black market groups offer distributed
information on each participating user in the represen-
tation of individual messages. This corpus enables the
researcher to gather the unstructured data (products,
prices, payment method, etc.), aggregate them to pro-
files, and gain insights into market players’ offerings
and behavior.
4 METHODOLOGY
This section deals with the detailed design of the ex-
traction pipeline, which has already been outlined
schematically in Figure 1. In detail, our pipeline in-
cludes:
a)
Crawling of chat messages using the official Tele-
gram API.
b)
Extracting relevant profile attributes such as prod-
ucts, prices, payment methods, locations, and per-
sons using a trained sequence tagger model de-
scribed in Subsection 4.1. Additionally, we map
products to prices
8
. This relation allows the anal-
ysis of price ranges for products.
c)
Aggregating each user’s extracted attributes by us-
ing their id present in each message. All extracted
attributes for a user represent one profile.
8
Each PROD span gets paired with the, by character
distance, nearest MONEY entity in a product-price relation.
We evaluated the pairing approach by manually annotating
the product-price relations on our test set and achieved an
F
1
-score of
0.73
. When multiple tariffs were present, we
only annotated the first price.
DATA 2022 - 11th International Conference on Data Science, Technology and Applications
86

d)
Clustering algorithms to group users by the prod-
ucts they offer using different approaches. Sub-
section 4.2 describes the selection of intuitively
good vector representations for products, while
Subsection 4.3 describes the clustering results.
4.1 NER Model Training
Besides social media language, the collected black
market messages contain semi-structured sale at-
tributes text spans. The language attributes differ from
the newspaper articles in traditional NER benchmarks
(Sang and De Meulder, 2003; Benikova et al., 2014).
To assess the complexity of the task and the perfor-
mance gained from current state-of-the-art approaches,
we provide a rule-based benchmark model. Our base-
line (BASE) determines entities in two different ways:
1.
We interpret all tokens or token sequences repre-
senting numbers as MONEY entities. Some tex-
tual descriptions or quantity specifications lead to
errors.
2.
All entities mentioned in the train and development
split serve as candidates. We define each test can-
didate as an entity mentioned with the correspond-
ing label during the evaluation. We only consider
lower cased texts. This procedure is similar to the
baseline in (Sang and De Meulder, 2003). This
approach does not generalize to unknown terms.
We also trained two sequence tagger models us-
ing Flair (Akbik et al., 2019). One uses classic to-
ken vector representations, and the other uses a trans-
former model. Both models predict entities using
the IOB2
9
(Krishnan and Ganapathy, 2005) tagging
scheme. Labels following the scheme B-
<
LABEL
>
or I-
<
LABEL
>
mark tokens as an entity’s beginning
or inner part. The O label marks tokens that are not
part of any entity.
Figure 4 shows the first model (CLASSIC), which
uses German stacked embeddings. The FastText em-
beddings get finetuned while training the sequence
tagger. In contrast, we finetuned the contextual string
embeddings (FlairEmbeddings) on raw chat texts in
a separate step to learn better representations for our
domain. The final linear layer with 14 states predicts
the label for each token.
Figure 5 shows the second model (BERT). In con-
trast to the CLASSIC model, the BERT model neither
reprojects the token vector representations nor uses
a BI-LSTM-CRF layer. It only uses a transformer
model combined with dropout layers and one linear
layer. The output layer of the BERT model has two
9
Inner Outer Begin
Classic Model
Linear(in=256, out=14)
Bi-LSTM(in=4396, out=256)
Linear(in=4396, out=4396)
Dropout
FastText (de-crawl,
fine-tuned)
FlairEmbeddings
(de-forward)
FlairEmbeddings
(de-backward)
Figure 4: Block diagram of the architecture of the Classic
NER model. The model uses German FastText embeddings
(de-crawl) (Grave et al., 2018) stacked with two contextual
string embeddings (de-forward and de-backward) (Akbik
et al., 2018). After a dropout layer, the embeddings get
reprojected and fed into a BI-LSTM-CRF (Huang et al.,
2015). Lastly, a linear layer projects the results into label
space.
Transformer Model
Linear(in=1024, out=12)
Dropout
BertModel(deepset/gbert-large)
Figure 5: Block diagram of the architecture of the Trans-
former NER model. In contrast to the CLASSIC model, this
model uses the German BERT model deepset/gbert-large
(Chan et al., 2020) instead of stacked embeddings. After a
dropout layer, the output is projected to label space using a
linear layer.
dimensions less because it does not use a CRF and
therefore does not use <start> and <end> labels.
Table 2: Overall and per label
F
1
score for each model.
MICRO shows the micro averaged
F
1
score for all labels
(our target metric). The CLASSIC model performs slightly
better than BERT on the PAYM class (differs in third decimal
place).
BASE CLASSIC BERT
LOC .61 .54 .59
MONEY .75 .94 .95
PAYM .72 .95 .95
PER .45 .68 .88
PROD .57 .69 .73
MICRO .64 .79 .82
Out of all three NER models, the BERT model
performed best on our dataset with a micro average
F
1
score of 0.82. The BERT model has a 50 % lower error
rate
10
than the BASE model and a 14.29 % lower error
than the CLASSIC model. Hence, we used BERT as
sequence tagger for extracting relevant sale attributes
(e.g., product, prices, etc.). Table 2 shows the
F
1
scores
for each model and label for comparison.
10
Based on micro F
1
scores
Exploratory Analysis of Chat-based Black Market Profiles with Natural Language Processing
87

All experiments were conducted using a private
infrastructure, which has a carbon efficiency of 0.488
kgCO
2
eq/kWh. A cumulative of 18 hours of computa-
tion was performed on hardware of type Nvidia RTX
A6000 (TDP of 300W). Total emissions are estimated
to be 2.64 kgCO
2
eq. Estimations were conducted us-
ing the MachineLearning Impact calculator presented
in (Lacoste et al., 2019).
4.2 Feature Evaluation
Typically clustering algorithms require a distance or
affinity measure to group objects. Our approach com-
pares different vector representations for the extracted
product entities enabling us to group similar profiles.
This subsection focuses on selecting token vector
representations, which yield token similarities useful
for our application. We verify the selected representa-
tions by comparing manually annotated product groups
(categories), which we consider semantically related.
We make the following assumptions for our eval-
uation: The average affinity between each pair of the
same category should be high, and the average affinity
between products of different categories should be low.
This way, we can verify whether a chosen vector rep-
resentation conforms to the human understanding of
different product categories. Further, the average affin-
ity between product categories allows us to compare
different vector representations against each other.
Section 4.3 then uses the selected vector represen-
tation to define a profile vector representation to create
meaningful user profile groupings.
Table 3: Table of annotated product categories and the num-
ber of contained products. Three annotators divided
1, 040
products into these ten product categories. A good product
vector representation should yield high affinity within each
group and low affinity between groups.
Name Size
Accounts 259
Cigarettes 20
Documents 30
Drugs and Medication 21
Electronics 42
Fashion 334
Social Media Services 77
Software 67
Watches 75
Other 115
Sum 1, 040
We extracted all products from one chat group
and normalized the product names by lowercasing, re-
moving non-word characters, and condensing multiple
whitespaces into one single whitespace. We manually
explored the data and determined nine product cate-
gories and one other category. Three annotators took a
sample of
1, 040
products and divided them into these
semantic classes. For example, Netflix, Spotify, and
DAZN belong to the account category because they
all describe accounts for online services. We achieved
an inter-annotator agreement of
0.84
following Krip-
pendorff’s alpha, which can be considered an almost
perfect agreement (Landis and Koch, 1977, p. 165).
Table 3 shows the defined product categories with their
corresponding size.
We compare three different product vector rep-
resentations in combination with the cosine affinity
to choose an appropriate representation for our prod-
ucts. After dividing the products into the previously
mentioned ten categories, we computed the average
cosine affinity between all product pairs and all cat-
egories. We argue that proper vector representations
should achieve a high average cosine affinity within
one product category and a low average between se-
mantically distinct categories. Let
S = [s
0
, s
1
, ·· · , s
n
]
and
T = [t
0
,t
1
, ·· · ,t
m
]
be matrices of product represen-
tations with each column vector corresponding to one
product. We can compute the average cosine affinity
α
between
(S, T ) as shown in eq. (1).
α
between
(S, T ) =
1
nm
n
∑
i=0
m
∑
j=0
< s
i
,t
j
>
||s
i
|| ·||t
j
||
(1)
To compute the average cosine affinity within a product
class, we slightly modified function
α
in eq. (2) to not
include comparisons of products to themselves.
α
inner
(S) =
2
n(n − 1)
n−1
∑
i=0
n
∑
j=i+1
< s
i
, s
j
>
||s
i
|| · ||s
j
||
(2)
This way, we compute an affinity matrix
A
between
all product classes
S
i
, S
j
with entries
a
i, j
for each rep-
resentation.
a
i, j
=
(
α
inner
(S
i
) i = j
α
between
(S
i
, S
j
) otherwise
(3)
To better compare different vector representations, we
compute the affinity difference matrix
D
by subtract-
ing the diagonal entries (affinity of one category to
itself) from the corresponding non-diagonal entries of
A
. Each entry
d
i, j
of
D
gets calculated by applying
the formula from eq. (4). For good separation of cate-
gories, all non-diagonal entries should be negative. A
positive value implies that a category has a higher av-
erage affinity to another category than to itself, leading
to unsuitable clustering results in later steps. For exam-
ple, in Appendix Figure 10, the product class Drugs
Medication has a higher affinity to Watches than to
itself, implying that a clustering algorithm could fail
DATA 2022 - 11th International Conference on Data Science, Technology and Applications
88

to distinguish between drugs and watches correctly.
Appendix Figure 9, on the other hand, shows a good
separation between the chosen product classes.
d
i, j
=
(
a
i, j
− a
i,i
j ≥ i
a
i, j
− a
j, j
otherwise
(4)
We compared the finetuned vector representa-
tions from our CLASSIC and our TRANSFORMER
model to default gbert-large representations by exam-
ining their affinity difference matrices. Both BERT-
based representations did not perform well, as product
classes are, on average, only separated by a distance
of
0.03
(see Table 4). The low average affinity dif-
ference suggests that the affinity between the differ-
ent semantic classes is always considered high by the
BERT-based representations. Moreover, some seman-
tic classes have a higher affinity to other classes than
to themselves. On the other hand, the vector repre-
sentations of our CLASSIC model performed much
better, with a mean affinity difference of
0.09
to other
product classes, which is
225 %
higher than the affin-
ity difference both transformer (BERT, and GBERT)
representations achieved.
Table 4: Mean affinity difference and variance comparison
for each product class. BERT and CLASSIC describe the
vector representations generated by our models. GBERT
stands for non finetuned gbert-large representations.
Class BERT GBERT CLASSIC
Accounts −.02 ± .001 −.04 ± .000 −.07 ± .001
Cigarettes −.02 ± .001 −.03 ± .001 −.08 ± .002
Documents −.10± .002 −.04 ± .001 −.12 ± .001
Drugs −.02 ± .001 −.04 ± .000 −.10 ± .001
Electronics −.02 ± .001 −.06 ± .000 −.11 ± .001
Fashion −.02 ± .001 −.03 ± .000 −.07 ± .001
Social... −.01 ± .001 −.05 ± .000 −.08 ± .001
Software −.04 ± .004 −.04 ± .000 −.08 ± .001
Watches −.03 ± .003 −.05 ± .000 −.09 ± .002
Other −.04 ± .002 −.03 ± .000 −.08 ± .002
Mean −.03 ± .003 −.04 ± .000 −.09 ± .002
4.3 Profile Clustering and Naming
Subsection 4.2 compared different vector representa-
tions for products and their ability to separate different
product classes from each other. In this section, we use
product vectors to create profile vectors for user profile
clustering. Therefore, we see a user profile
P
as a set
of mentioned products
p
r
i
∈ P
with
1 ≤ i ≤ n
. The
most straightforward approach for creating a profile
vector
p
f
is averaging all product vectors
p
r
i
∈ P
for
one profile as shown in eq. (5).
p
f
=
1
n
n
∑
i=1
p
r
i
(5)
For profile clustering, any clustering algorithm is
applicable as long as it allows the usage of the cosine
distance metric and real-valued feature vectors. We
used the agglomerative clustering algorithm provided
by scikit-learn (Pedregosa et al., 2011). It allows us
to use the cosine affinity and a distance threshold for
clustering. This way, the data analyst can effectively
control the granularity of the clustering results by set-
ting an affinity threshold for profiles.
We choose a representative product name for each
cluster
C
to interpret the clustering results better. To
do so, we use the generated profile vector represen-
tations
p
f
∈ C
. All representations are located in the
same vector space as the token and product vectors.
Therefore it is possible to compare product vectors to
profile vectors. By averaging all profile vectors
p
f
within a cluster
C
, the dimension does not change, and
one can create a cluster vector
c
vec
as shown in eq. (6)
representing the average of all profiles within.
c
vec
(C) =
1
|C|
∑
p
f
∈C
p
f
(6)
To find a suitable name, one can compare all prod-
uct representations of cluster
C
with the newly created
cluster vector
c
vec
(C)
. The product with the lowest
cosine distance to the cluster vector is then used as a
representative cluster name p
rep
(see eq. (7)).
p
rep
(C, P) = argmin
p∈P
(1 −
< p, c
vec
(C) >
||p|| · ||c
vec
(C)||
) (7)
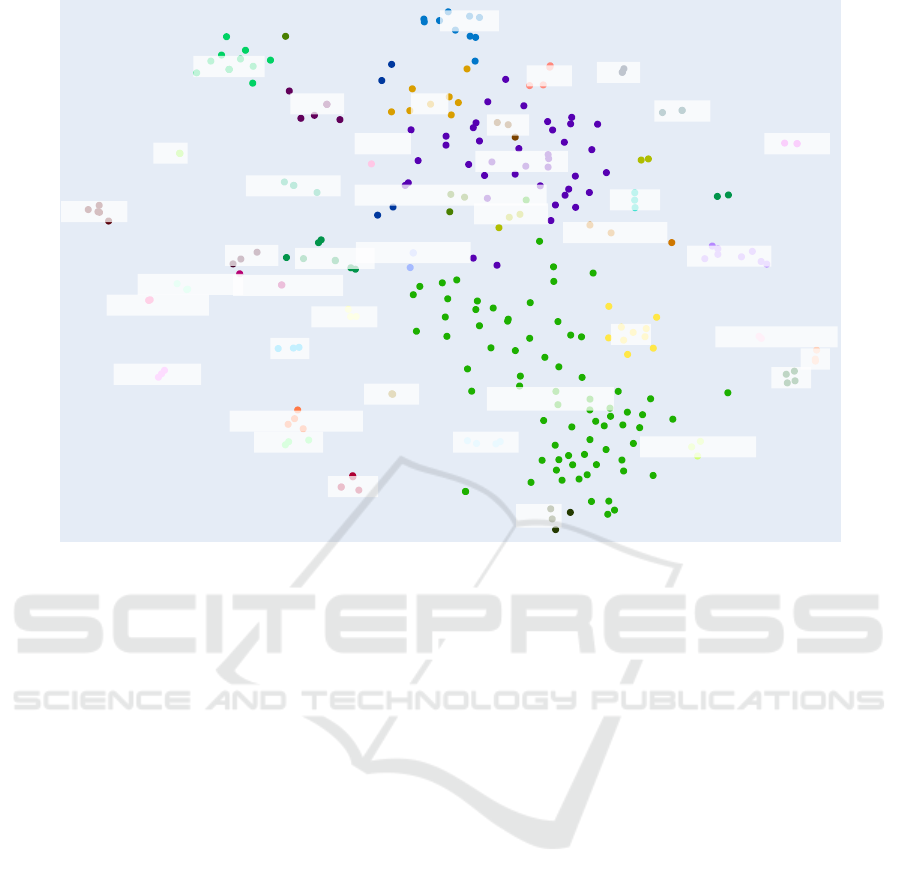
Figure 6 shows a t-SNE (van der Maaten and Hin-
ton, 2008) plot of the clustering results using agglomer-
ative clustering with a distance threshold of
0.3
. Clus-
ters with less than
3
profiles are excluded from the plot.
For example, the plot shows the cluster Forklift license,
Driving licenses, Fishing license, Payroll, and Docu-
ments directly next to each other, which corresponds
to human intuition as all users in these clusters try to
sell falsified documents.
4.4 Limitations
The proposed method can help law enforcement agen-
cies to achieve an overview of black market chat rooms.
Based on this overview agencies can start investiga-
tions for specific profiles.
In the following section we want to show our ap-
proaches’ limitations for the mentioned use case on
three different levels:
Corpus
: We collected data from different German
Telegram black market chat rooms assuming similar
messages’ concepts, domains and structures. Sampling
randomly of all rooms helps cover the different con-
cepts while reducing the manual and laborious effort
Exploratory Analysis of Chat-based Black Market Profiles with Natural Language Processing
89
Butt
Jordan Shoes
NBC Sports Gold
Marlboro
Iphone 11
Packstations
Cigarettes
Fishing license
Spotify Premium
Jewelry
Likes
AirPods Pro
Gucci Bag
Clothes
Vouchers
Shoes
Bags
Watches
Versace glasses
Belts
I Phone 11 pro Max
Trikots
Driving licenses
Documents
Fifa 21
Duftzwillinge
Payroll
Forklift license
sim cards
- Airpods
Shirts
Paypal Accounts
Marlboro Gold Tabak Boxes
Counterfeit money
IPTV
Jacket
T-Shirts
HEETS
iptv
Likes
Figure 6: t-SNE plot of clustering results with profile vectors based on the CLASSIC model embeddings and a distance
threshold of 0.3. The generated labels were translated.
to label the data. All annotators labeled the test set to
ensure the annotation quality, facilitating the computa-
tion of an inter-annotator agreement. We recommend
not to generalize this score for the whole corpus with
high confidence.
Information Extraction
: We extract the sale at-
tributes from plain text. The models could perform
differently with pre-, postprocessing, or annotating
more data. With the current approach, we face situ-
ations the model wrongly includes emojis and labels
enumeration of products as one.
Entity disambiguation (Fang et al., 2016) can help
to reduce the different product names meaning the
same as stated in Subsection 3.1.
The heuristic to find the price for a product consult-
ing the nearest price works for single tariffs. However,
several product offerings include different tariffs (e.g.,
subscription periods), which the heuristic cannot cover.
We need more complex annotation schema and models.
Relation extraction (Kl
¨
oser et al., 2021; Wadden et al.,
2019) helps to assign different prices to one product.
Clustering
: The clustering algorithms assign one
profile to a single cluster. Our approach cannot attach a
profile to several clusters. The requirement to assign a
profile to multiple clusters demands the usage of multi-
label classification methods (Tarekegn et al., 2021).
Evaluating the clusters based on profiles with gold
data is not applicable in this use case. Depending
on the defined parameters, the algorithms create fine-
grained or coarse-grained clusters. Law enforcement
agencies can set the cluster’s granularity to an appropri-
ate analysis depth. Thus, clustering is an exploratory
approach. For evaluation, we focused on ensuring the
word feature’s expressiveness to differentiate products
from each other (see Subsection 4.2).
5 EXEMPLARY ANALYSIS
The proposed approach can support law enforcement
agencies in applying specific investigations. The pro-
cessing pipeline collects message metadata, extracts
sale attributes, and clusters users based on their prod-
uct portfolios. Each mentioned processing stage pro-
vides us with different kinds of data. Utilizing message
metadata provides first insights into the user’s behav-
ior, but metadata does not enable textual insights such
as extracting offered products. We show that NLP
techniques add semantic structures allowing textual
analysis.
This section shows an exemplary analysis of each
stage’s data. We aim to investigate the essential aspects
of the black markets and to motivate the adaption of the
presented methodology as a basis for further studies
on these and other domains.
DATA 2022 - 11th International Conference on Data Science, Technology and Applications
90
00h 04h 08h 12h 16h 20h 00h
0
10
20
30
40
50
60
Daytime
Messages per timeslot
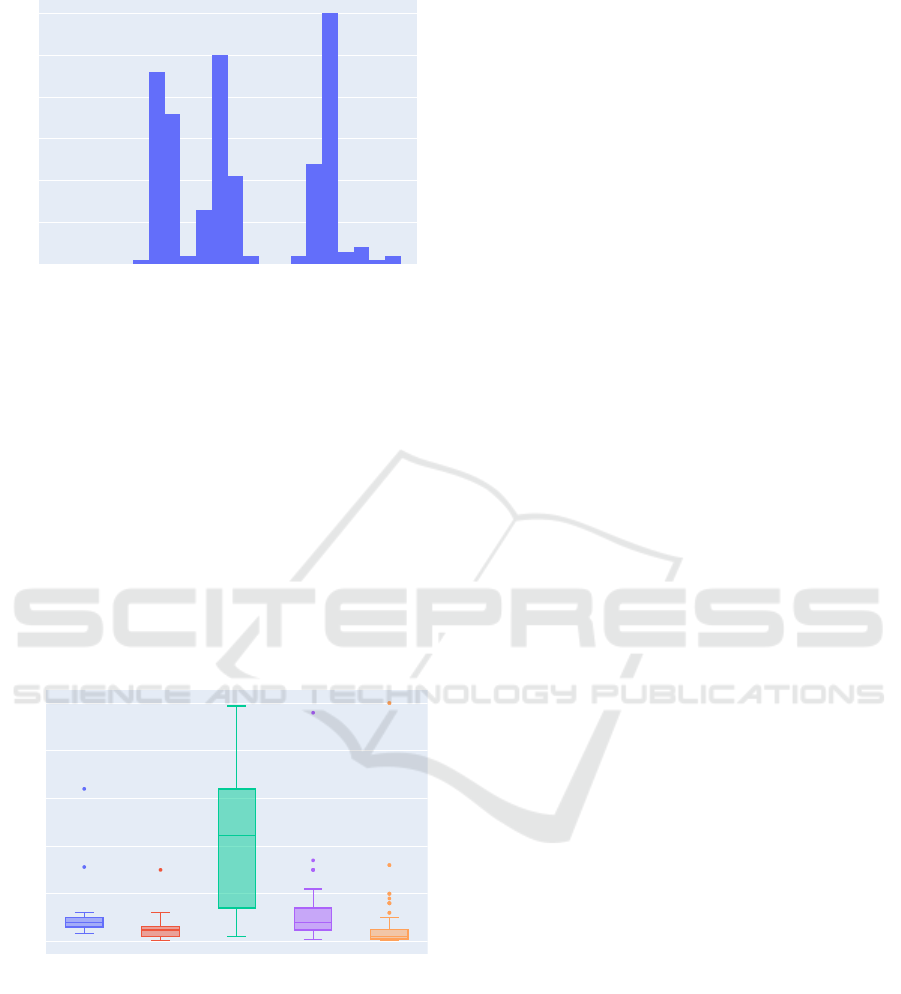
Figure 7: Amount of messages by the most active user of
one group at different daytimes. The histogram bin size is
one hour. The user has preferred timeslots to send messages.
5.1 Metadata
We retrieve metadata similar to Listing 1 in the ap-
pendix for each message. We can aggregate messages
per user and analyze group or individual behavior. The
most active user sent
1, 102
messages in one group
in
107
days. Figure 7 shows his activities grouped
by the time of day. The user could arrange his group
activities around the working hours: Before work (07-
09h), lunch break (around 12h), and after work (
>
17h).
This information allows no insights about the offered
products or other message content.
T-Shitrs Nord VPN Watches DAZN Acc. Views
0
50
100
150
200
250
Products
Estimated Price in €
Figure 8: The boxplot illustrates price ranges for products.
We ignore multiplicities (e.g., 1k views vs. 10k views) and
different writings of product names (trim whitespaces, re-
move non-word characters).
5.2 Named Entity Recognition
Analysis methods on raw text do not allow to work on
domain-specific terms and structures. The extraction
and grouping of attributes to product offerings allow
further content analysis. The definitions in Section 3
determine the degree of granularity for all following
approaches. For example, Figure 8 shows price ranges
for products. Additionally,
24%
of all offerings spec-
ify payment methods.
52%
of these prefer PayPal
payments. Analysis can reach the depth of traditional
data science studies on structured data, as in (Baravalle
et al., 2016; Christin, 2013) for example. It remains
challenging to gain the necessary domain knowledge
for such analysis.
5.3 Clustering
To get a meaningful view of the kinds of actors, we
instructed a profile clustering procedure in Subsec-
tion 4.3. The found cluster titles differ from the pro-
posed product categories for two significant reasons.
1.
Vendors are not bound to sell only products from
a single product category.
2.
The word vector representations for domain-
specific expressions may derivate from common
usages.
Our approach provides a meaningful high-level
overview of vendors’ types and offered products in
Figure 6. The number of autodetected clusters is higher
than manually created product categories.
Most detected categories are subsets of the pre-
defined ones. Some were completely new ones, like
counterfeit money.
6 CONCLUSION
We proposed a methodology to gain information about
vendor profiles from anonymous chat messages by
combining named entity extraction with clustering.
Therefore, we applied different techniques combin-
ing supervised and unsupervised learning tasks into a
unified processing pipeline.
Our evaluation shows that transformer-based mod-
els are superior on entity extraction but lack perfor-
mance for clustering tasks compared to static FastText
vectors stacked with contextual string embeddings.
This finding shows the importance of evaluating differ-
ent word representation approaches depending on the
use case.
We extracted and aggregated vendor profiles from
the crawled chat corpus into meaningful insights about
product ranges of single profiles. For example, large
user groups selling unauthorized online accounts or
counterfeit consumer goods indicate illegal activities.
The results presented in Section 4 and 5 show that our
methodology performs well if messages have a similar
style. However, further research is needed for domains
Exploratory Analysis of Chat-based Black Market Profiles with Natural Language Processing
91

other than black markets or different data sources (e.g.,
Twitter messages) or writing styles.
In summary, our methodology provides a good
entry point to cluster profiles and documents based
on extracted information such as named entities and
to identify further correlations hidden in unstructured
data.
REFERENCES
Akbik, A., Bergmann, T., Blythe, D., Rasul, K., Schweter,
S., and Vollgraf, R. (2019). FLAIR: An Easy-to-Use
Framework for State-of-the-Art NLP. In Proceedings
of the 2019 Conference of the North American Chap-
ter of the Association for Computational Linguistics
(Demonstrations), pages 54–59, Minneapolis, Min-
nesota. Association for Computational Linguistics.
Akbik, A., Blythe, D., and Vollgraf, R. (2018). Contex-
tual String Embeddings for Sequence Labeling. In
Proceedings of the 27th International Conference on
Computational Linguistics, pages 1638–1649, Santa
Fe, New Mexico, USA. Association for Computational
Linguistics.
Baravalle, A., Lopez, M. S., and Lee, S. W. (2016). Mining
the Dark Web: Drugs and Fake Ids. In 2016 IEEE 16th
International Conference on Data Mining Workshops
(ICDMW), pages 350–356.
Benikova, D., Biemann, C., and Reznicek, M. (2014). NoSta-
D Named Entity Annotation for German: Guidelines
and Dataset. In Proceedings of the Ninth International
Conference on Language Resources and Evaluation
(LREC’14), pages 2524–2531, Reykjavik, Iceland. Eu-
ropean Language Resources Association (ELRA).
Bitkom (2018). Neun von zehn Internetnutzern
verwenden Messenger — Bitkom Main.
http://www.bitkom.org/Presse/Presseinformation/Neun-
von-zehn-Internetnutzern-verwenden-
Messenger.html.
Blankers, M., van der Gouwe, D., Stegemann, L., and Smit-
Rigter, L. (2021). Changes in Online Psychoactive
Substance Trade via Telegram during the COVID-19
Pandemic. European Addiction Research, 27(6):469–
474.
Chan, B., Schweter, S., and M
¨
oller, T. (2020). German’s
Next Language Model. arXiv:2010.10906 [cs].
Christin, N. (2013). Traveling the silk road: A measurement
analysis of a large anonymous online marketplace. Pro-
ceedings of the 22nd international conference on World
Wide Web.
Dargahi Nobari, A., Sarraf, M., Neshati, M., and Danesh-
var, F. (2020). Characteristics of viral messages on
Telegram; The world’s largest hybrid public and pri-
vate messenger. Expert Systems with Applications,
168:114303.
DataReportal and GlobalWebIndex (2021). Ger-
many: Top apps categories by reach 2020.
https://www.statista.com/statistics/1274384/top-
apps-reach-germany-by-category/.
Devlin, J., Chang, M.-W., Lee, K., and Toutanova, K. (2019).
BERT: Pre-training of Deep Bidirectional Transform-
ers for Language Understanding. arXiv:1810.04805
[cs].
Fang, W., Zhang, J., Wang, D., Chen, Z., and Li, M. (2016).
Entity Disambiguation by Knowledge and Text Jointly
Embedding. In Proceedings of The 20th SIGNLL Con-
ference on Computational Natural Language Learning,
pages 260–269, Berlin, Germany. Association for Com-
putational Linguistics.
Frisoni, G., Moro, G., and Carbonaro, A. (2020). Learning
Interpretable and Statistically Significant Knowledge
from Unlabeled Corpora of Social Text Messages: A
Novel Methodology of Descriptive Text Mining. In 9th
International Conference on Data Science, Technology
and Applications, pages 121–132.
GlobalWebIndex (2021). Coronavirus impact:
Global device usage increase by country 2020.
https://www.statista.com/statistics/1106607/device-
usage-coronavirus-worldwide-by-country/.
Gomathi, C. (2018). Social Tagging System for Community
Detecting using NLP Technique. International Jour-
nal for Research in Applied Science and Engineering
Technology, 6:1665–1671.
Grave, E., Bojanowski, P., Gupta, P., Joulin, A., and Mikolov,
T. (2018). Learning Word Vectors for 157 Languages.
arXiv:1802.06893 [cs].
Griffith, V., Xu, Y., and Ratti, C. (2017). Graph Theoretic
Properties of the Darkweb. arXiv:1704.07525 [cs].
Huang, Z., Xu, W., and Yu, K. (2015). Bidirectional LSTM-
CRF Models for Sequence Tagging. arXiv:1508.01991
[cs].
Kl
¨
oser, L., Kohl, P., Kraft, B., and Z
¨
undorf, A. (2021). Multi-
Attribute Relation Extraction (MARE) – Simplifying
the Application of Relation Extraction. Proceedings
of the 2nd International Conference on Deep Learning
Theory and Applications, pages 148–156.
Krippendorff, K. (2012). Chapter 12. Reliability. In Content
Analysis: An Introduction To Its Methodology. Sage
Publications, Inc, Los Angeles ; London, revised edi-
tion.
Krishnan, V. and Ganapathy, V. (2005). Named Entity Recog-
nition. Stanford Lecture CS229.
Lacoste, A., Luccioni, A., Schmidt, V., and Dandres, T.
(2019). Quantifying the Carbon Emissions of Machine
Learning. arXiv:1910.09700 [cs].
Landis, J. R. and Koch, G. G. (1977). The Measurement of
Observer Agreement for Categorical Data. Biometrics,
33(1):159.
Li, M., Lu, S., Zhang, L., Zhang, Y., and Zhang, B. (2021).
A Community Detection Method for Social Network
Based on Community Embedding. IEEE Transactions
on Computational Social Systems, 8(2):308–318.
Newman, M. E. J. (2006). Finding community structure in
networks using the eigenvectors of matrices. Physical
Review E, 74(3):036104.
Pedregosa, F., Varoquaux, G., Gramfort, A., Michel, V.,
Thirion, B., Grisel, O., Blondel, M., Prettenhofer, P.,
Weiss, R., Dubourg, V., Vanderplas, J., Passos, A.,
DATA 2022 - 11th International Conference on Data Science, Technology and Applications
92

Cournapeau, D., Brucher, M., Perrot, M., and Duch-
esnay,
´
E. (2011). Scikit-learn: Machine Learning
in Python. Journal of Machine Learning Research,
12(85):2825–2830.
Pei, J., Ren, P., and de Rijke, M. (2021). A Cooperative Mem-
ory Network for Personalized Task-oriented Dialogue
Systems with Incomplete User Profiles. Proceedings
of the Web Conference 2021, pages 1552–1561.
Peng, Q., Chen, K., Liu, Q., Su, Y., and Lu, Y. (2021).
Community Detection Algorithm for Heterogeneous
Networks Based on Central Node and Seed Commu-
nity Extension. In 2021 3rd International Conference
on Advances in Computer Technology, Information Sci-
ence and Communication (CTISC), pages 178–182.
Sang, E. F. T. K. and De Meulder, F. (2003). Introduction to
the CoNLL-2003 Shared Task: Language-Independent
Named Entity Recognition. arXiv:cs/0306050.
Schweter, S. and Akbik, A. (2021). FLERT: Document-
Level Features for Named Entity Recognition.
arXiv:2011.06993 [cs].
Subhashini, L. D. C. S., Li, Y., Zhang, J., Atukorale, A. S.,
and Wu, Y. (2021). Mining and classifying customer
reviews: A survey. Artificial Intelligence Review,
54(8):6343–6389.
Tarekegn, A. N., Giacobini, M., and Michalak, K. (2021). A
review of methods for imbalanced multi-label classifi-
cation. Pattern Recognition, 118:107965.
Tigunova, A., Yates, A., Mirza, P., and Weikum, G. (2019).
Listening between the Lines: Learning Personal At-
tributes from Conversations. arXiv:1904.10887 [cs].
Vajjala, S., Majumder, B., Gupta, A., and Surana, H. (2020).
Chapter 8. Social Media. In Practical Natural Lan-
guage Processing. O’Reilly Media, Inc.
van der Maaten, L. and Hinton, G. (2008). Visualizing Data
using t-SNE. Journal of Machine Learning Research,
9(86):2579–2605.
Vaswani, A., Shazeer, N., Parmar, N., Uszkoreit, J., Jones,
L., Gomez, A. N., Kaiser, L., and Polosukhin, I. (2017).
Attention Is All You Need. arXiv:1706.03762 [cs].
Vogt, M., Leser, U., and Akbik, A. (2021). Early Detection of
Sexual Predators in Chats. In Proceedings of the 59th
Annual Meeting of the Association for Computational
Linguistics and the 11th International Joint Conference
on Natural Language Processing, volume Volume 1:
Long Papers, pages 4985–4999, Online. Association
for Computational Linguistics.
Wadden, D., Wennberg, U., Luan, Y., and Hajishirzi, H.
(2019). Entity, Relation, and Event Extraction with
Contextualized Span Representations. EMNLP.
Wang, X., Jiang, Y., Bach, N., Wang, T., Huang, Z., Huang,
F., and Tu, K. (2021). Automated Concatenation of
Embeddings for Structured Prediction. In Proceedings
of the 59th Annual Meeting of the Association for Com-
putational Linguistics and the 11th International Joint
Conference on Natural Language Processing, volume
Volume 1: Long Papers, pages 2643–2660, Online.
Association for Computational Linguistics.
Xu, X. and Lockwood, J. (2021). What’s going on in the chat
flow? A move analysis of e-commerce customer ser-
vice webchat exchange. English for Specific Purposes,
61:84–96.
Zabihimayvan, M., Sadeghi, R., Doran, D., and Allahyari, M.
(2019). A Broad Evaluation of the Tor English Content
Ecosystem. arXiv:1902.06680 [cs].
Zheng, P., Yuan, S., Wu, X., and Wu, Y. (2021). Hidden
Buyer Identification in Darknet Markets via Dirichlet
Hawkes Process. In 2021 IEEE International Confer-
ence on Big Data, pages 581–589.
APPENDIX
{
"id": "652595859",
"first_name": "John Bello",
"last_name": null,
"username": "Bellojohn",
"phone": null,
"datetime": "2020-08-19T14:49:01",
"message": "<see Figure 2>",
"reply_to": null,
"type": [
"text"
]
}
Listing 1: We receive information on the message sender,
the time the message was sent, and if this message replies to
a previous message. The type denotes the media types text,
photo, video, and audio.
Exploratory Analysis of Chat-based Black Market Profiles with Natural Language Processing
93
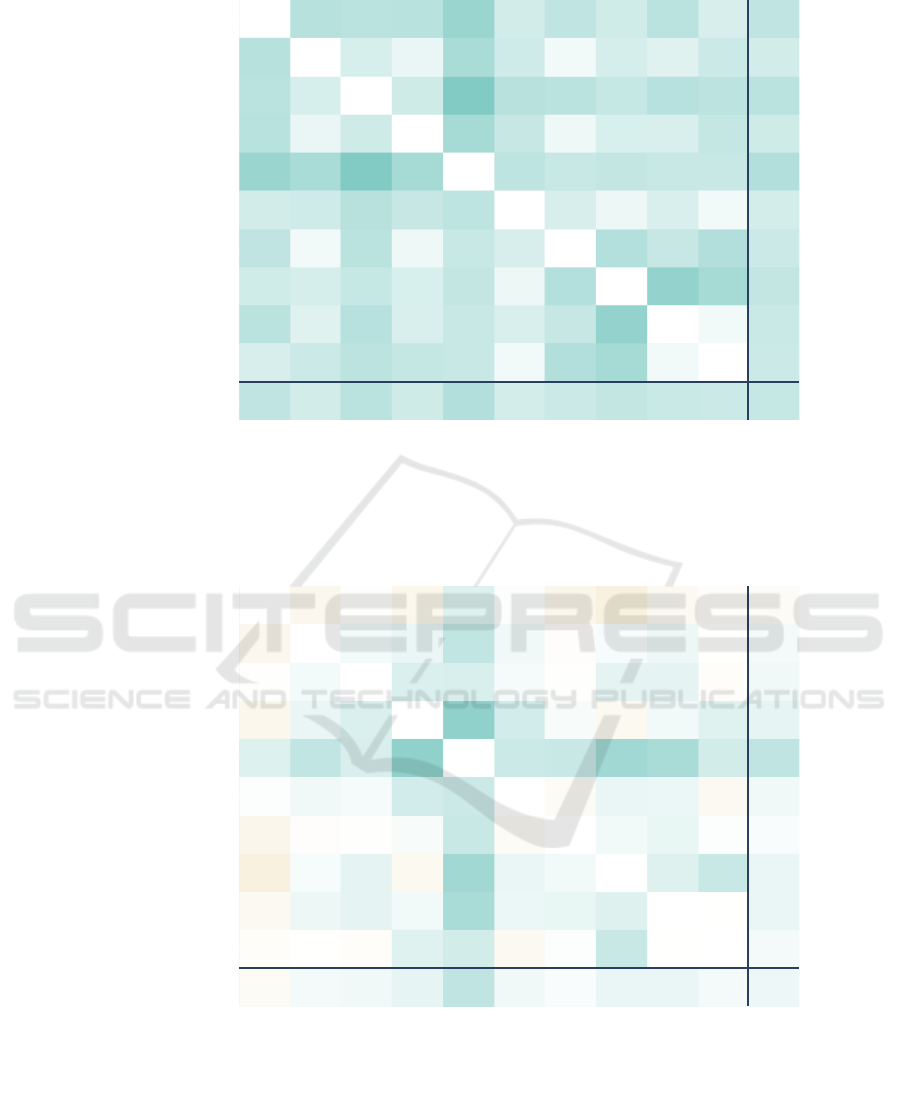
0.00 -0.11 -0.11 -0.11 -0.16 -0.07 -0.10 -0.07 -0.11 -0.06 -0.10
-0.11 0.00 -0.06 -0.03 -0.13 -0.08 -0.02 -0.07 -0.05 -0.08 -0.07
-0.11 -0.06 0.00 -0.08 -0.20 -0.11 -0.11 -0.09 -0.11 -0.11 -0.11
-0.11 -0.03 -0.08 0.00 -0.14 -0.09 -0.03 -0.06 -0.06 -0.09 -0.08
-0.16 -0.13 -0.20 -0.14 0.00 -0.10 -0.09 -0.09 -0.09 -0.09 -0.12
-0.07 -0.08 -0.11 -0.09 -0.10 0.00 -0.06 -0.03 -0.06 -0.02 -0.07
-0.10 -0.02 -0.11 -0.03 -0.09 -0.06 0.00 -0.12 -0.09 -0.12 -0.08
-0.07 -0.07 -0.09 -0.06 -0.09 -0.03 -0.12 0.00 -0.17 -0.14 -0.09
-0.11 -0.05 -0.11 -0.06 -0.09 -0.06 -0.09 -0.17 0.00 -0.02 -0.08
-0.06 -0.08 -0.11 -0.09 -0.09 -0.02 -0.12 -0.14 -0.02 0.00 -0.08
-0.10 -0.07 -0.11 -0.08 -0.12 -0.07 -0.08 -0.09 -0.08 -0.08 -0.09
Drugs Medication
Accounts
Electronics
Software
Documents
Fashion
Social Media Services
Watches
Other
Cigarettes
Mean
Mean
Cigarettes
Other
Watches
Social Media Services
Fashion
Documents
Software
Electronics
Accounts
Drugs Medication
Figure 9: Affinity difference matrix between all product categories using the embeddings from the CLASSIC model. Substract-
ing the main diagonal element from each entry of the affinity matrix yields the affinity difference matrix.
0.00 0.04 0.01 0.04 -0.05 -0.01 0.04 0.07 0.03 0.01 0.02
0.04 0.00 -0.02 -0.04 -0.10 -0.02 0.01 -0.01 -0.03 0.00 -0.02
0.01 -0.02 0.00 -0.06 -0.06 -0.02 0.01 -0.04 -0.04 0.01 -0.02
0.04 -0.04 -0.06 0.00 -0.17 -0.07 -0.01 0.03 -0.02 -0.05 -0.04
-0.05 -0.10 -0.06 -0.17 0.00 -0.08 -0.09 -0.15 -0.14 -0.07 -0.10
-0.01 -0.02 -0.02 -0.07 -0.08 0.00 0.02 -0.03 -0.03 0.03 -0.02
0.04 0.01 0.01 -0.01 -0.09 0.02 0.00 -0.02 -0.04 0.00 -0.01
0.07 -0.01 -0.04 0.03 -0.15 -0.03 -0.02 0.00 -0.05 -0.09 -0.03
0.03 -0.03 -0.04 -0.02 -0.14 -0.03 -0.04 -0.05 0.00 0.00 -0.04
0.01 0.00 0.01 -0.05 -0.07 0.03 0.00 -0.09 0.00 0.00 -0.02
0.02 -0.02 -0.02 -0.04 -0.10 -0.02 -0.01 -0.03 -0.04 -0.02 -0.03
Drugs Medication
Accounts
Electronics
Software
Documents
Fashion
Social Media Services
Watches
Other
Cigarettes
Mean
Mean
Cigarettes
Other
Watches
Social Media Services
Fashion
Documents
Software
Electronics
Accounts
Drugs Medication
Figure 10: Affinity difference matrix between all product categories using the vector representations from the BERT model.
Substracting the main diagonal element from each entry of the affinity matrix yields the affinity difference matrix.
DATA 2022 - 11th International Conference on Data Science, Technology and Applications
94
