
A Hybrid Complexity Metric in
Automatic Software Defects Prediction
Laura Diana Cern
˘
au
a
, Laura Dios
,
an
b
and Camelia S
,
erban
c
Faculty of Mathematics and Computer Science, Babes
,
Bolyai University, Cluj-Napoca, Romania
Keywords:
Complexity, Automatic Defect Prediction, Software Metrics.
Abstract:
Nowadays, software systems evolve in vast and complex applications. In such a complex system, a minor
change in one part may have unexpected degradation of the software system design, leading to an unending
chain of bugs and defects. Therefore, to keep track of implications that could appear after a change has been
applied, the assessment of the software system is of utmost importance. As a result, in this direction, software
metrics are suitable for quantifying various aspects of system complexity and predicting as early as possible
those parts of the system that could be error-prone. Thus, in this paper, we propose a comparative study of two
complexity metrics, Weighted Method Count and Hybrid Cyclomatic Complexity, regarding the prediction
of software defects. Specifically, the objective is to investigate whether using a hybrid metric that measures
the complexity of a class improves the performance of the fault prediction model. We conduct a series of
several experiments on five open source projects datasets. The preliminary results of our research indicate that
the proposed metric performs better than the standard complexity metric of a class, Weighted Method Count.
Moreover, the Hybrid Cyclomatic Complexity metric can be seen as a base for building a more complex and
robust complexity metric.
1 INTRODUCTION
Software systems became more and more complex,
and their size exponentially increased from one ver-
sion to another. Time constraints and resources of-
ten force some technical debt to be tolerated, thus
affecting in time the system quality (Holvitie et al.,
2018). Furthermore, any change comes with an un-
ending chain of adjustments in multiple places, which
hampers the maintenance and evolution of the sys-
tems. Trying to mitigate these, early detection and
prediction of software defects play an essential role
in the software industry in terms of quality measure-
ment.
It is well known that a good internal design struc-
ture has a strong positive impact on external quality
attributes (Fenton, 1994). Therefore, a desideratum
in designing a software system is to obtain flexible
and easily adaptable software design to extend the
system’s functionality, with limited alteration to ex-
isting modules (Coad and Yourdon, 1991). A quanti-
a
https://orcid.org/0000-0002-6876-9065
b
https://orcid.org/0000-0002-6339-1622
c
https://orcid.org/0000-0002-5741-2597
tative examination of the software system’s internal
structure is of utmost importance to assure this re-
silience and malleability. As a result, software metrics
are beneficial for quantifying essential aspects of the
assessment in this direction. By linking these met-
rics to those aspects that characterize a good inter-
nal structure of the software systems, we can predict
those design entities that are error-prone or defective.
Predicting and detecting software defects as early as
possible could overcome critical problems from ap-
pearing later in the software development lifecycle,
reduce (Holvitie et al., 2018) and thus guarantee a
good quality of the system. All these actions strongly
impact software testing activity and assure high main-
tainability of the software system in the cause.
Considering the aspects mentioned above regard-
ing the importance of automatic prediction of soft-
ware defects as early as possible in the development
cycle of the software systems, the pillars of this re-
search investigation are a metric proposal - Hybrid
cyclomatic complexity (CC). This metric aims to im-
prove the defect prediction accuracy and validate this
metric through an empirical approach. The initial re-
sults reveal that the HCC metric performs better than
the Weighted Methods Count (WMC), the metric used
Cern
˘
au, L., Dios
,
an, L. and S
,
erban, C.
A Hybrid Complexity Metric in Automatic Software Defects Prediction.
DOI: 10.5220/0011269700003266
In Proceedings of the 17th International Conference on Software Technologies (ICSOFT 2022), pages 433-440
ISBN: 978-989-758-588-3; ISSN: 2184-2833
Copyright
c
2022 by SCITEPRESS – Science and Technology Publications, Lda. All rights reserved
433

to measure a class’s complexity. Moreover, the HCC
metric can be considered a more complex and robust
metric, which considers more aspects regarding the
complexity of a class.
To study the performance of this hybrid metric,
we used it for predicting the existence of bugs in
source code based on different combinations of soft-
ware metrics. We used a public data set containing
source code files from Java projects together with in-
formation and correlation with bugs for this predic-
tion. Our approach is platform agnostic (desktop/mo-
bile/web), meaning that the algorithm should perform
the same no matter what type of source code files are
analyzed.
The paper is organized as follows: Section 2 con-
tains related work. Section 3 describes the proposed
approach based on metrics, along with the Support
Vector Machine method. Section 4 describes the pro-
posed experiments of our investigation and the ob-
tained results. Section 5 discusses threats to validity
that can affect the results of our study. Finally, the
conclusions of our paper and further research direc-
tions are outlined in Section 6.
2 RELATED WORK
Numerous papers in the literature address the issue of
an automatic prediction of software defects. In the
following, we will briefly describe some of these that
are similar to our approach.
In their article, (Ferzund et al., 2008) use ma-
chine learning to find a predictor that will label a
file as clean or containing bugs. In order to accom-
plish their goal, they used the decision tree algo-
rithm. The data used for training the classifier con-
sisted of a set of static code metrics and the bugs re-
lated to each file. The metrics that were used in this
study are the following: NEL(Number of Executable
Lines), CD(Control Density), CC(Cyclomatic Com-
plexity), PC (Parameter Count), RP(Return Points),
LVC(Local Variable Count) and ND(Nesting Depth).
Another example would be (Alshehri et al., 2018),
where the authors analyze the performance of a re-
duced set of change metrics, static metrics and a com-
bination of both categories as the predictors for fault-
prone code. Among the static code metrics they used
are LOC(lines of code), Max Complexity, Methods
per Class. At the same time, some of the change met-
rics used are Ave-LOC Added, LOC-Deleted, Refac-
torings(how many times a file was refactored) and
code churn. Their analysis used three machine learn-
ing algorithms: Logistic Regression, Naive Bayes,
and Decision Tree J48.
A comparison between multilayer deep feedfor-
ward networks and traditional machine learning al-
gorithms (decision tree, random forest, naive Bayes
and support vector machines) for predicting security-
related faults using software quality metrics was pre-
sented in (Clemente et al., 2018). According to their
findings, the deep learning algorithm performed bet-
ter in predicting security bugs. According to the au-
thors, the metrics used in this research are part of
three categories: object-oriented, complexity and vol-
ume, and among them are Cyclomatic Complexity,
Executable Statements, Declarative Statements, Com-
ment to Code Ratio.
A fault prediction model developed on a combi-
nation of three different ensemble methods learning
algorithms is proposed in (Kumar et al., 2017). The
authors used a heterogeneous ensemble method with
three rule combinations, one nonlinear and two lin-
ear, in the model’s development process. One of
the conclusions of their research is that a subset of
code metrics has a significant impact on the accuracy
of the prediction rather than the whole set of code
metrics. This subset includes DIT(depth of inheri-
tence tree), WMC, CBO(Coupling between objects),
LCOM3(Lack of Cohesion of Methods), AVG-CC,
NOC(Number of Children), among other Chidamber
and Kemerer Java Metrics.
Unlike the methods mentioned above, (Erturk and
Sezer, 2016) proposed a solution for the software fault
prediction problem using a Fuzzy Inference System
(FIS) algorithm to build a predictive model. The
authors employed the Mamdani type FIS and the
McCabe code metrics in their research, representing
method-level metrics. According to their study, Er-
turk et al. claim that the FIS algorithm performs bet-
ter than the traditional machine learning algorithms,
which require historical data for the training phase.
3 METRICS BASED DEFECT
PREDICTION
In the following subsections, we resume the ar-
guments supporting our defect prediction approach
starting from the software system’s internal structure.
Furthermore, we survey the most relevant object-
oriented metrics found in literature, select some of
them to support our approach and then justify the se-
lection. For the prediction of software defects, we
will use an automatic algorithm based SVM (Vapnik,
1999), a supervised learning method.
ICSOFT 2022 - 17th International Conference on Software Technologies
434

3.1 Proposed Approach Description
One of the main goal of software assessment is aimed
at verifying whether the built system meets quality
factors such as maintainability, extensibility, scalabil-
ity and reusability. The axiom of (Fenton, 1994) re-
veals that: “a good internal structure of software sys-
tem assures its good external quality”. In this respect,
the main assessment goal is reduced to verifying if
there is conformity between the software system’s in-
ternal structure and the principles and heuristics of
good design, which are related to the internal qual-
ity attributes of the system design (such as coupling,
cohesion, complexity and data abstraction). In (Riel,
1996) is stated that such rules should be deemed as a
series of “warning bells that will ring when violated”
(Marinescu, 2002).
Thus, the software system’s internal structure’s
continuous assessment has to be made throughout the
entire software development lifecycle. As a result, in
this direction, software metrics are suitable for quan-
tifying essential aspects of the assessment. Therefore,
software metrics are suitable in the automation of the
assessment process and, at the same time, are used to
predict software defects earlier in the system devel-
opment. Prediction of software defects in the earli-
est possible phases leads to a reduction of the time in
their correction as well as the value of the technical
debts that were made during the development of the
system.
The Figure 1 describes our proposed approach.
3.2 Selected Metrics
3.2.1 Metrics Definition
Various metrics have been proposed so far, and new
metrics continue to regularly appear in the literature.
Among these, the metrics proposed by (Abreu, 1993),
(Abreu and Rogerio, 1994), (Chidamber and Ke-
merer, 1994), (Li and Henry, 1993), and the MOOD
metrics proposed by (Abreu, 1995) are the most used.
(Marinescu, 2002) has classified these metrics accord-
ing to four internal characteristics that are essential to
object-orientation: - i.e. coupling, inheritance, cohe-
sion and structural complexity.
In the current study, we are using the CC pro-
posed by (McCabe, 1976) to measure the complexity
of a method, DIT, and LCOM metrics proposed by
(Chidamber and Kemerer, 1994). These metrics are
related to inheritance, cohesion and structural com-
plexity as internal characteristics of a previously men-
tioned class.
In what follows, we provide the definitions of the
metrics used in our investigation:
• Weighted Methods per Class (WMC) metric is de-
fined as the sum of the complexity of all methods
of a given class. The complexity of a method is
the cyclomatic complexity metric.
Cyclomatic complexity (CC) (McCabe, 1976) is
a measure of a module control flow complexity
based on graph theory. A control flow graph de-
scribes the logical structure of a software mod-
ule. Each flow graph consists of nodes and edges.
The nodes represent computational statements or
expressions, and the edges represent the transfer
of control between nodes (Watson and McCabe,
1996).
Cyclomatic complexity is defined for each mod-
ule to be e − n + 2, where e are the number of
edges and n are the number of nodes in the control
flow graph.
• New Proposed Metric: Hybrid Cyclomatic Com-
plexity (HCC) is defined by adding to the WMC
metric value the sum of the complexity of all in-
herited methods of a given class.
We recall here that one of this paper’s main goals
is to study the impact of a new metric in bug pre-
diction. This is defined by an aggregated measure
quantifying complexity based on inheritance.
• Lack of Cohesion in Methods (LCOM) is defined
by the difference between the number of method
pairs using common instance variables and the
number of method pairs that do not use any com-
mon variables.
• Depth of Inheritance Tree (DIT) is defined as the
length of the longest path of inheritance from a
given class to the root of the tree;
3.2.2 Motivation for the Selected Metrics
In what follows, we bring forth our arguments for
metrics selection. These arguments are based on the
four internal characteristics of object-orientated pro-
gramming mentioned before on the impact of metrics
values on software quality.
Regarding the cyclomatic complexity metric, it is
tightly correlated to the number of alternative paths
the execution of one module can go through. Conse-
quently, a high cyclomatic complexity for a method
could imply that the method breaks the single respon-
sibility principle, has a low readability level and can
be hard to maintain. Another aspect that is mentioned
by (McCabe, 1976) is that this metric can be used as
a testing methodology where the number of test cases
for a module must be equal to the value of the cyclo-
matic complexity for that module. Thus, a high value
for the cyclomatic complexity metric indicates a low-
A Hybrid Complexity Metric in Automatic Software Defects Prediction
435
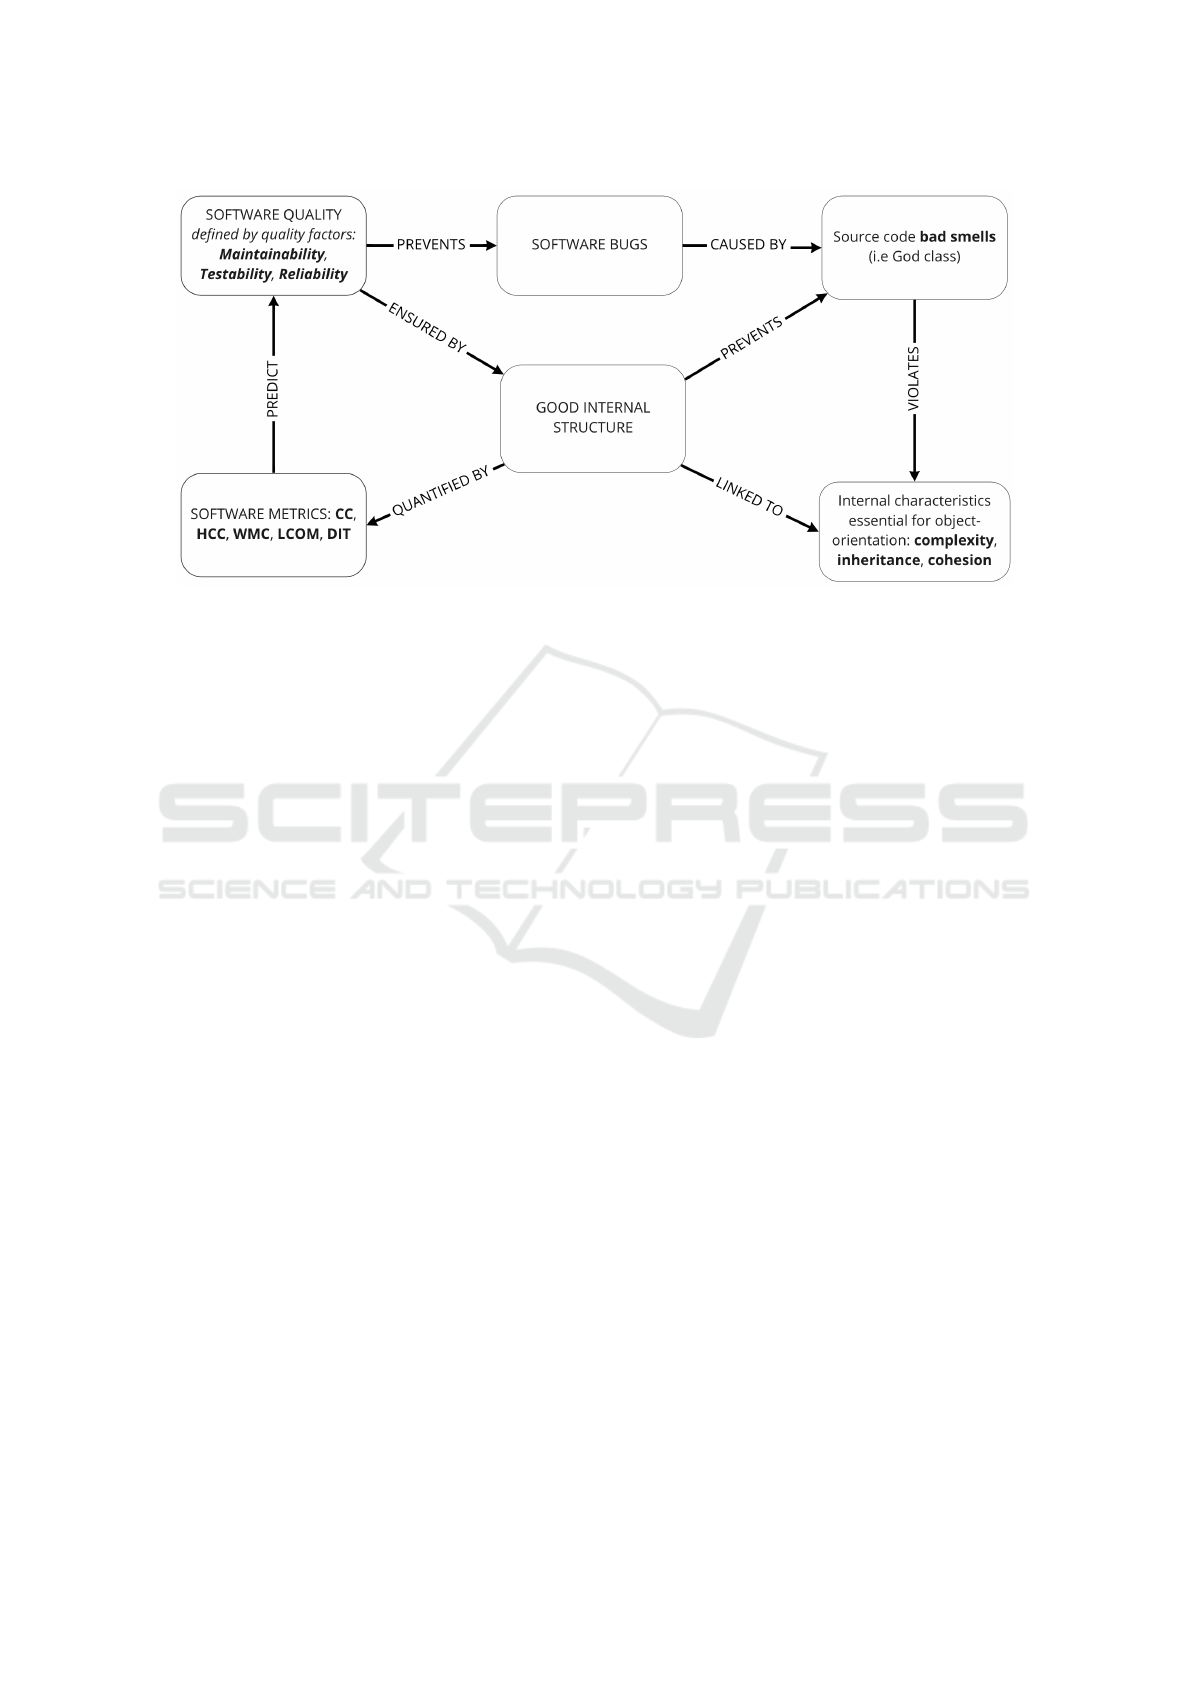
Figure 1: Motivation for our approach in defect prediction.
quality code that might involve difficulties in testing
and maintaining.
In order to extend the cyclomatic complexity met-
ric, we chose to use the depth of inheritance tree met-
ric because it is highly correlated to the complexity
of a class. A high value of DIT could have a nega-
tive impact on the understandability of the code be-
cause the logic is spread along in the inheritance path
of one class. In addition, the behaviour of a class
that a higher value of DIT is challenging to predict,
and its complexity should reflect the methods it in-
herits. Therefore we chose to study the performance
of a hybrid metric, HCC, a combination of the two
mentioned earlier. Besides these three metrics, we
chose to use LCOM as a feature for the fault predic-
tion model because it is also a cohesion related metric
and reflects the degree to which a class respects the
Single Responsibility Principle. Low cohesion may
imply that the complexity of the class is increased,
and therefore the probability for that class to contain
error-prone code is higher.
Moreover, we selected the W MC and DIT metrics
because they are metrics that characterise the com-
plexity degree of a class. In addition to these two,
we chose the LCOM metric because it indicates the
cohesion among a class, which directly impacts the
complexity of the class.
3.3 Machine Learning based Defect
Prediction
The problem of defect prediction is of significant
importance during the maintenance and evolution of
software systems. It is essential for software develop-
ers to continuously identify defective software mod-
ules to improve the system’s quality. However, as the
conditions for a software module to have defects are
hard to identify, machine learning-based classification
models are still developed to approach the problem
of defect prediction. For our research, we decided
to use the Support Vector Machine classifier. The
main reason for our choice is that the data set is of
small size and it has only a few features. However,
various machine learning algorithms can be used to
detect potentially faulty source code based on soft-
ware quality metrics, including Decision Tree, Ran-
dom Forest, Naive Bayes or Fuzzy Inference System.
The significant benefit that these algorithms bring is
that by using them, detecting a bug or signalling a po-
tentially erroneous code becomes automated, without
the need for a human factor to check the metrics and
make judgments based on them.
The proposed approach for defect prediction is
briefly described in Figure 2.
This study aims to explore the relationship be-
tween object-oriented metrics and fault proneness at
the class level. In this paper, a class from an object-
oriented design is labelled as “defect” if it contains at
least one bug related to this class was found by testing
the program. The dependent variable in the SVM al-
gorithm has two values: defect (1) or non-defect (0).
The values of selected metrics HCC, WMC, LCOM
and DIT act as independent variables.
Therefore, having defined dependent variables
and independent variables, we want to investigate
which combination of metrics provides a more ac-
curate prediction. For this, we have defined sev-
eral scenarios with different combinations of metrics:
S
W MC,DIT
, S
W MC,LCOM
, S
HCC,DIT
, S
W MC,LCOM,DIT
S
HCC,LCOM,DIT
.
ICSOFT 2022 - 17th International Conference on Software Technologies
436
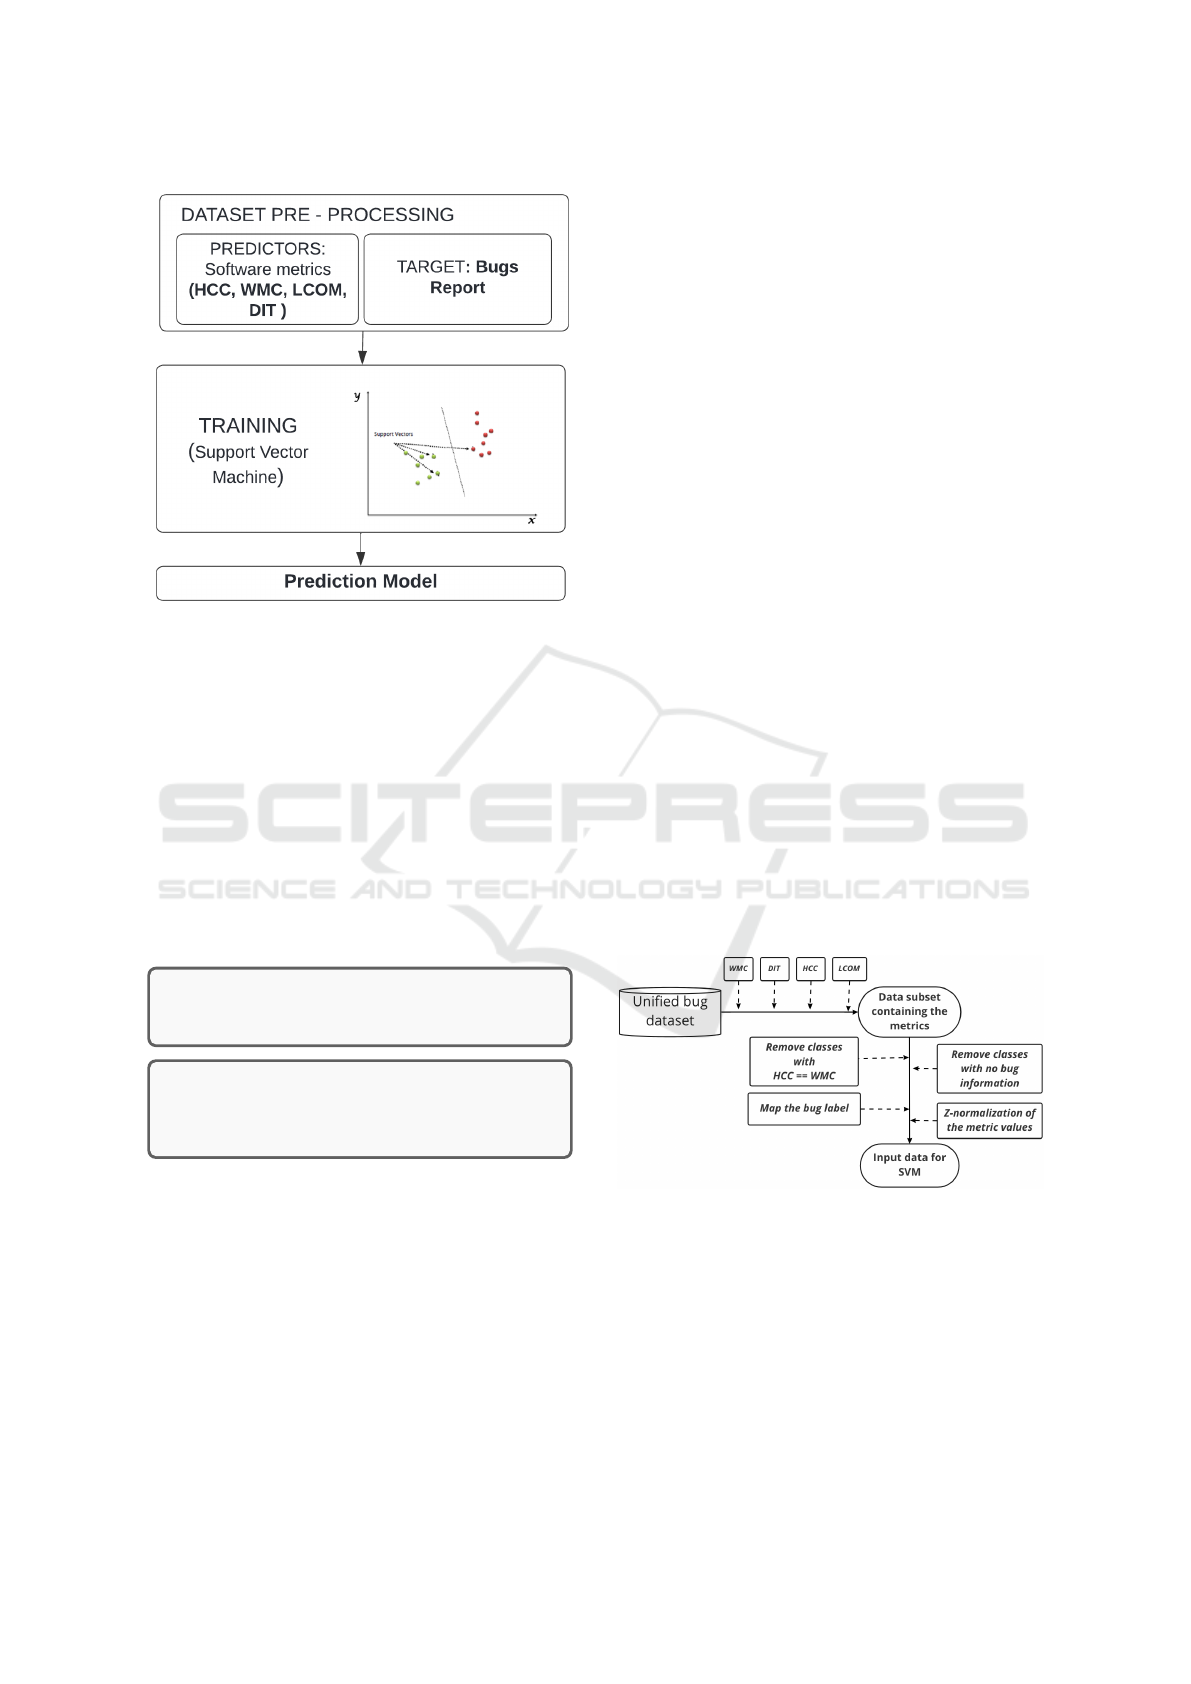
Figure 2: Proposed defect prediction approach.
4 EXPERIMENTS
4.1 Research Questions
Starting from the methodology proposed in Section
3, our empirical analysis aims to address two research
questions.
The proposed research questions aim to support
the understanding of the goals of the study with re-
spect to the methodology steps. Therefore, having
these into consideration, we formulate the following
research questions:
RQ1: How effective is the bug detection
method compared to expert inspections?
RQ2: Which code representation works
better: a representation based on W MC or
one based on HCC?
4.2 Data Set Description
The data set utilised in this paper is part of a more
extensive database collected by (Ferenc et al., 2018).
During this process, the authors computed a set of
source code metrics for source files from five public
databases: PROMISE, Eclipse Bug Dataset, Bug Pre-
diction Dataset, Bugcatchers Bug Dataset and Github
Bug Dataset. Consequently, one of the main attributes
of this database is that the definitions of the code met-
rics are the same amongst all the repositories, and
it can be used as input for building fault prediction
models. The unified database provided by Ferenc
et al. contains the following information about each
file: the name of the file, a set of source code met-
rics calculated using OpenStaticAnalyzer and a label
that specifies the faulty/not-faulty state of the file (has
no bugs/has a number of bugs/not defined). In build-
ing this data set, the authors assessed a list of elim-
inatory requirements. One example would be that
each project must incorporate information about the
bugs and their association with parts of the source
code. For example, when describing the Eclipse Bug
Dataset, the authors stated the following ”mapped de-
fects from the bug database of Eclipse 2.0, 2.1, and
3.0. The resulting dataset lists the number of pre and
post-release defects on the granularity of files and
packages that were collected from the BUGZILLA bug
tracking system.”(Ferenc et al., 2018). To obtain the
bug label, the authors merged the information about
the values of the metrics with the information about
the presence of a bug in a particular class. From this
dataset, we utilised a subset of files randomly selected
and the information about the presence of bugs and
the values of the LCOM code metric. In addition,
we must specify that our approach is an agnostic one
regarding the type of projects of which the analyzed
classes are part. Specifically, because the granularity
of the chosen software metrics is at the class level, the
analysis results are not impacted by the nature of the
project (mobile/desktop/web).
4.3 Data Set Pre-processing
Figure 3: Data pre-processing.
This section will describe the initial data’s process-
ing phases to become relevant input data for the SVM
algorithm. An overview of the whole process can
be seen in Figure 3. Therefore, in this phase of our
research, we computed the values of the Cyclomatic
Complexity (CC), Depth of Inheritance Tree and the
Hybrid Cyclomatic Complexity (HCC) for the subset
mentioned in the previous section. The Cyclomatic
Complexity metric was calculated using an external
A Hybrid Complexity Metric in Automatic Software Defects Prediction
437

tool, Checkstyle, which helps developers write code
according to a set of coding standards, amongst which
are the values for specific software quality metrics. In
the next step, after having the Cyclomatic Complexity
defined for each class, we parsed each file again and
calculated the Hybrid Cyclomatic Complexity and its
DIT. Succeeding these first two steps, we had the fea-
tures that were going to be employed in building the
prediction model using the support vector machine al-
gorithm: CC, HCC, DIT, LCOM and the bug label for
each class. The following steps are defined by prepar-
ing the data in order to be suitable for training the
SVM algorithm. Firstly the classes that had no in-
formation about the existence of a bug were removed
from the dataset. Secondly, we removed the classes
with the CC equal to the HCC because our purpose
was to see if the HCC performs as a better predic-
tor for fault prediction. Next, because the SVM al-
gorithm classifies the data in two subsets, in our case
faulty and not-faulty, every value bigger than one for
the bug label was transformed into 1. Therefore, after
these steps, the bug labels for each class would be 0
or 1. The final step was to normalize the data, using
a standard scaler (sklearn) that removed the mean and
scaling to unit the variance (Mitchell and Learning,
1997).
4.4 Evaluation Criteria
In the validation stage, to measure the effectiveness of
the classification, we compare the results from expert
inspection (that acts as ground truth) to those of our
automatic method.
The ground truth, constructed by experts, was
provided in the unified bug database, and it is part
of each public dataset (PROMISE, Eclipse Bug-
Dataset, Bug Prediction Dataset, Bugcatchers Bug-
Dataset and Github Bug Dataset). How the pres-
ence of a bug was determined and mapped to a
class/file depends on each repository. For ex-
ample, the Eclipse Bug Dataset was computed
by (Schr[Pleaseinsertintopreamble]ter et al., 2009).
Then, the authors mapped the defects from the bug
database of Eclipse to files and classes from the
source code. The information about the defects was
gathered from version archives of the project and bug
tracking systems (BUGZILLA, Jira). Finally, they
correlated the fixes from the logs to the reported bugs.
Another example would be the mapping and fault data
collection presented by Hall et al. (Hall et al., 2014).
The authors used an Apache Ant script in order to col-
lect information about bugs and fixes. Still, the pro-
cess is similar to the one presented before.
During the validation, we are interested in both
the correctness and the integrity of the categorisation
process. Therefore, three evaluation criteria are of in-
terest: precision, recall and specificity.
The number of items accurately labelled as faulty
(true positive) divided by the total number of items
labelled as possessing defects is the precision of the
positive class in our classification problem (i.e. the
sum of true positives and false positives, which are
items without bugs but labelled by the model as be-
longing to the faulty category).
The capacity of a classification model to correctly
discover erroneous elements (those items that con-
tain bugs) is referred to as recall (or sensitivity). The
model’s detection rate is the proportion of items pre-
dicted as faulty among those that actually contain
bugs. A negative result in a high-sensitivity classifica-
tion model is beneficial for ruling out problems. On
the other hand, when the answer is negative, a high
sensitivity model is reliable since it seldom misdiag-
noses items with problems.
The model’s ability to correctly classify the
healthy items (without bugs) is referred to as speci-
ficity. The proportion of items that do not have bugs
and are classified as negative by the model is known
as model specificity. A positive prediction from a
model with high specificity is beneficial for determin-
ing whether or not bugs are present. Conversely, a
positive prediction indicates a high likelihood of bug
presence.
4.5 Numerical Experiments
4.5.1 Setup of Experiments
In the data used for training and testing our predic-
tion model, we had the following distribution, 1484
entries for the training set and 1470 for the testing set.
The item distribution in these subsets was a balanced
one. They contain an equal number of source code
classes marked as having bugs and without bugs. For
the data normalization, we used the StandardScaler
from the sklearn Python library (Sta, ) and performed
a Z-normalization (Mitchell and Learning, 1997). We
used the C-Support Vector Classification (SVC, ) al-
gorithm from the SVM sklearn module for the data
classification. The kernel type used for this algorithm
was the linear one, and the value for the C parameter
was the default one, 1.0.
4.5.2 RQ1 - How Effective Is the Bug Detection
Method Compared to Expert Inspections?
A first investigation is aimed to analyse the impact
of data representation how the code features involved
in our automatic classification influence the quality
ICSOFT 2022 - 17th International Conference on Software Technologies
438

of bugs’ detection. Thus, in order to test our clas-
sification approach, we have considered the expert-
based constructed ground truth for each of the anal-
ysed codebases; afterwards, the proposed system was
run over the analysed applications, and the findings
were compared against the ground truth.
Table 1 presents our findings for the first three sce-
narios by using the precision, recall and specificity
metrics. Those performance criteria were used to val-
idate the correctness of our approach from an empiric
point of view.
Table 1: The effectiveness of the classification process in
terms of Precision, Recall and Specificity.
Scenario Precision Recall Specificity
S
W MC,LCOM
0.51 0.71 0.32
S
W MC,DIT
0.57 0.40 0.70
S
W MC,LCOM,DIT
0.79 0.46 0.88
By considering the precision and specificity cri-
teria, the best results are obtained in scenario
S
W MC,LCOM,DIT
, when all three metrics are considered
as features. We noticed that a data representation that
leaves out DIT metric is able of predicting a positive
output (item with bugs) – the classification recall in
S
W MC,LCOM
is quite large – but those items are ac-
tually healthy ones – since the precision obtained in
this scenario is around 0.5, and the model specificity
is minimal.
We can also notice that by enlarging the feature set
(from S
W MC,LCOM
and S
W MC,DIT
to S
W MC,LCOM,DIT
,
respectively), both precision and specificity are im-
proving.
4.5.3 RQ2 - Which Code Representation Works
Better: A Representation based on W MC
or One based on HCC?
By taking into account that a code representation
without DIT metric is not appropriate, in what fol-
lows, just the DIT -based representations will be con-
sidered. We are interested in how HCC metric, in-
stead of the simple W MC one, influences the qual-
ity of the bug detection. Therefore, Table 2 figures
out our findings when the classifier uses as inputs the
HCC, LCOM and DIT metrics.
Table 2: The effectiveness of the classification process (in
terms of Precision, Recall and Specificity) by considering
the HCC-based code representation.
Scenario Precision Recall Specificity
S
HCC,DIT
0.72 0.39 0.85
S
HCC,LCOM,DIT
0.81 0.24 0.94
We can notice that in both scenarios, by using the
HCC metric instead of the simple W MC metric, the
classifier is able to detect the faulty items better.
In the case of HCC and DIT based representa-
tion, the precision of our classifier increases from 0.57
to 0.72. Furthermore, by enlarging the features by
knowledge about LCOM metric, the system’s preci-
sion rises to 0.81, revealing the potential of our novel
metric to contribute to better detection of faulty items.
We also notice an improvement in the model’s
specificity when the HCC metric is involved as a data
feature for our classifier. The larger specificity value
indicates a better estimation of how likely the items
without bugs can be correctly ruled out. In both sce-
narios (S
HCC,DIT
and S
HCC,LCOM,DIT
) the number of
false positives is reduced to the corresponding W MC-
based scenarios (S
W MC,DIT
and S
W MC,LCOM,DIT
).
Regarding the recall value, even if its value is not
so good, the numerical results indicate that even if
there is no significant difference between S
W MC,DIT
and S
HCC,DIT
, by involving the hybrid code metric,
the ability of the classifier to detect bug items de-
creases by half. Indeed, a more sensitive model is
desired, but the most important characteristics remain
precision and specificity.
5 THREATS TO VALIDITY
Threats to Internal Validity. One threat to our ap-
proach’s validity is that we used only a limited num-
ber of metrics, cyclomatic complexity, depth of in-
heritance tree, lack of cohesion in methods and the
extended metric, hybrid cyclomatic complexity. We
chose these metrics because they are part of the same
category, complexity metrics. Another concern is that
the value of the hybrid metric (HCC) relies on the
value of the CC, which is computed using an external
tool, Checkstyle. Also, the algorithm used for these
experiments, SVM, may be considered a threat to the
internal validity of our results.
Threats to External Validity. One weak point of
our approach is the programming language limitation.
More precisely, the dataset contains only Java classes,
and the logic for computing the HCC relies on the
Java syntax when parsing the files. Another aspect
worth mentioning is that our prediction model was
built based on classes and features from different pub-
lic projects.
Threats to Construct Validity. In the validation
stage, we measure the efficacy of the classification
algorithm by comparing the result of the prediction
model with the initial values of the bug labels from the
unified bug dataset. One threat to this validation’s cor-
A Hybrid Complexity Metric in Automatic Software Defects Prediction
439

rectness is that the defect information from this uni-
fied bug dataset comprises five public datasets. Each
of these datasets had a different process for mapping
the defects to the source code.
6 CONCLUSIONS AND FUTURE
WORK
One of the main goals of this research was to inves-
tigate whether a hybrid cyclomatic complexity met-
ric is better than the standard cyclomatic complexity
for a class (WMC). Our experiments concluded that
the SVM prediction models that included the hybrid
metric as a feature performed better than the one that
included the standard WMC metric. In addition, we
consider this hybrid metric to be a more complex and
elaborate one because it considers multiple aspects
concerning the complexity of a class.
Based on these preliminary results, we intend to
investigate the efficacy of this metric on larger sets of
data to have a more in-depth analysis and formalise
the definition of the metric. Moreover, another as-
pect worth studying is the impact of other software
quality metrics combined with the hybrid metric on
the prediction model’s performance. Likewise, we
would like to analyse the sensibility of the results to
the change of the machine learning algorithm.
REFERENCES
StandardScaler. https://scikit-learn.org/stable/modules/
generated/sklearn.preprocessing.StandardScaler.
html/. [Online; accessed 17-February-2022].
SVC. https://scikit-learn.org/stable/modules/generated/
sklearn.svm.SVC.html/. [Online; accessed 17-
February-2022].
Abreu, F. (1993). Metrics for Object Oriented Environment.
In Proceedings of the 3rd International Conference on
Software Quality, Tahoe, Nevada, EUA, October 4th -
6th, pages 67—-75.
Abreu, F. (1995). The MOOD Metrics Set. In 9th Eu-
ropean Conference on Object-Oriented Programming
(ECOOP’95) Workshop Metrics.
Abreu, F. and Rogerio, C. (1994). Candidate Metrics for
Object- Oriented Software within a Taxonomy Frame-
work. In Journal of systems software 26, pages 359–
368.
Alshehri, Y. A., Goseva-Popstojanova, K., Dzielski, D. G.,
and Devine, T. (2018). Applying machine learning to
predict software fault proneness using change metrics,
static code metrics, and a combination of them. In
SoutheastCon 2018, pages 1–7.
Chidamber, S. R. and Kemerer, C. F. (1994). A metrics suite
for object-oriented design. IEEE Trans. Soft Ware
Eng., 20(6):476–493.
Clemente, C. J., Jaafar, F., and Malik, Y. (2018). Is predict-
ing software security bugs using deep learning bet-
ter than the traditional machine learning algorithms?
In 2018 IEEE International Conference on Software
Quality, Reliability and Security (QRS), pages 95–
102.
Coad, P. and Yourdon, E. (1991). Object-Oriented Design.
Prentice Hall, London, 2 edition.
Erturk, E. and Sezer, E. (2016). Software fault predic-
tion using mamdani type fuzzy inference system. In-
ternational Journal of Data Analysis Techniques and
Strategies, 8:14.
Fenton, N. (1994). Software measurement: a necessary sci-
entific basis. IEEE Transactions on Software Engi-
neering, 20(3):199–206.
Ferenc, R., T
´
oth, Z., Lad
´
anyi, G., Siket, I., and Gyim
´
othy,
T. (2018). A public unified bug dataset for java. New
York, NY, USA. Association for Computing Machin-
ery.
Ferzund, J., Ahsan, S., and Wotawa, F. (2008). Analysing
Bug Prediction Capabilities of Static Code Metrics in
Open Source Software.
Hall, T., Zhang, M., Bowes, D., and Sun, Y. (2014). Some
code smells have a significant but small effect on
faults. ACM Transactions on Software Engineering
and Methodology, 23:1–39.
Holvitie, J., Licorish, S. A., Sp
´
ınola, R. O., Hyrynsalmi,
S., MacDonell, S. G., Mendes, T. S., Buchan, J., and
Lepp
¨
anen, V. (2018). Technical debt and agile soft-
ware development practices and processes: An in-
dustry practitioner survey. Information and Software
Technology, 96:141–160.
Kumar, L., Rath, S., and Sureka, A. (2017). Using source
code metrics and ensemble methods for fault prone-
ness prediction.
Li, W. and Henry, S. (1993). Maintenance metrics for the
object oriented paradigm. IEEE Proc. First Interna-
tional Software Metrics Symp, pages 52–60.
Marinescu, R. (2002). Measurement and Quality in Object
Oriented Design. PhD thesis, Faculty of Automatics
and Computer Science, University of Timisoara.
McCabe, T. (1976). A Complexity Measure. IEEE Transac-
tions on Software Engineering, 2(4), pages 308–320.
Mitchell, T. M. and Learning, M. (1997). Mcgraw-hill sci-
ence. Engineering/Math, 1:27.
Riel, A. (1996). Object-Oriented Design Heuristics.
Addison-Wesley.
Schr
¨
oter, A., Zimmermann, T., Premraj, R., and Zeller, .
(2009). If your bug database could talk. Empirical
Software Engineering - ESE, page 18.
Vapnik, V. (1999). The nature of statistical learning theory.
Springer science & business media.
Watson, A. H. and McCabe, T. J. (1996). Structured Test-
ing: A Testing Methodology Using the Cyclomatic
Complexity Metric. In National Institute of Standards
and Technology NIST Special Publication, pages 500–
235.
ICSOFT 2022 - 17th International Conference on Software Technologies
440
