
Large-scale Randomness Study of Security Margins
for 100+ Cryptographic Functions
Du
ˇ
san Klinec
1
, Marek S
´
ys
1
, Karel Kub
´
ı
ˇ
cek
2
, Petr
ˇ
Svenda
1
and Vashek Maty
´
a
ˇ
s
1
1
Masaryk Univesity, Brno, Czech Republic
2
ETH Zurich, Switzerland
fi fi
Keywords:
Randomness Analysis, Cryptographic Function, Security-margin.
Abstract:
The output of cryptographic functions, be it encryption routines or hash functions, should be statistically indis-
tinguishable from a truly random data for an external observer. The property can be partially tested automat-
ically using batteries of statistical tests. However, it is not easy in practice: multiple incompatible test suites
exist, with possibly overlapping and correlated tests, making the statistically robust interpretation of results
difficult. Additionally, a significant amount of data processing is required to test every separate cryptographic
function. Due to these obstacles, no large-scale systematic analysis of the the round-reduced cryptographic
functions w.r.t their input mixing capability, which would provide an insight into the behaviour of the whole
classes of functions rather than few selected ones, was yet published. We created a framework to consistently
run 414 statistical tests and their variants from the commonly used statistical testing batteries (NIST STS,
Dieharder, TestU01, and BoolTest). Using the distributed computational cluster providing required significant
processing power, we analyzed the output of 109 round-reduced cryptographic functions (hash, lightweight,
and block-based encryption functions) in the multiple configurations, scrutinizing the mixing property of each
one. As a result, we established the fraction of a function’s rounds with still detectable bias (a.k.a. security
margin) when analyzed by randomness statistical tests.
1 INTRODUCTION
Truly random data are essential in many crypto-
graphic operations such as the generation of keys, un-
predictable nonces or padding schemes. Flawed ran-
dom generators producing partially predictable data
can lead to factorization of TLS server keys (Heninger
et al., 2012), compromise of RSA keys from elec-
tronic IDs (Bernstein et al., 2013) or theft of funds
from cryptocurrency wallets (Ketamine, 2018). Sim-
ilarly, cryptographic functions such as block ciphers
or hash functions are expected to produce output in-
distinguishable from the truly random data as long as
the attacker does not posses the key used, input data
or both. Producing data with detectable biases sug-
gests a susceptibility to linear or differential crypt-
analysis (Matsui, 1993; Biham and Shamir, 2012).
Multiple randomness test batteries exist, the
most common being NIST STS (Rukhin et al.,
2010), Dieharder (Brown et al., 2013) and
TestU01 (L’Ecuyer and Simard, 2007). How-
ever, when applied to pseudorandom generators,
human cryptanalysts typically do not consider
general-purpose statistical batteries to be a very
useful method for identifying weaknesses of crypto-
graphic functions. There are at least two reasons for
this:
Firstly, the use of statistical testing batteries is
far from easy in practice. Multiple test suites ex-
ist and with incompatible interfaces, using different
approaches for the test interpretation and difficult to
computationally scale enough to analyze more than
a handful of analyzed functions. The results of sta-
tistical tests are also notoriously difficult to interpret:
Research literature contains multiple examples of in-
valid results due to flawed test interpretations. It is un-
clear how sensitive the separate tests included in the
different statistical batteries are and how well-suited
they are for the domain of testing the output of cryp-
tographic functions.
Secondly, existing tests are perceived as not sen-
sitive enough and significantly falling behind the
human-performed cryptanalysis. However, there is
only limited empirical evidence for this – it holds
only for the well-studied functions such as finalists of
the AES or SHA-3 competitions. We aim to answer
134
Klinec, D., Sýs, M., Kubí
ˇ
cek, K., Švenda, P. and Matyáš, V.
Large-scale Randomness Study of Security Margins for 100+ Cryptographic Functions.
DOI: 10.5220/0011267600003283
In Proceedings of the 19th International Conference on Security and Cryptography (SECRYPT 2022), pages 134-146
ISBN: 978-989-758-590-6; ISSN: 2184-7711
Copyright
c
2022 by SCITEPRESS – Science and Technology Publications, Lda. All rights reserved

the question of whether automated analysis using ran-
domness testing batteries is useful for initial crypt-
analysis of round-reduced functions and how these
automatically found security margins compare with
the results found by human cryptanalysts.
A significant amount of earlier work has tack-
led the problem of automatic randomness analysis of
cryptographic functions’ output using statistical tests.
However, they share the following limitations: 1)
Only a limited set of statistical tests is used for eval-
uation (usually a single battery) and test results in-
terpretation is often flawed (ignoring correlated tests,
inappropriately adjusting the significance level, etc.).
2) Only a very narrow set of different outputs is tested
(usually just a one or few functions).
Finally, but just as importantly, almost all these
studies are difficult to replicate as the implementa-
tions are often not published and the computations
performed (e.g., seed used for data sequence produc-
tion) are not deterministic. The related work is revis-
ited in more detail at the end of the paper in Section 5.
To address the outlaid issues while avoiding the
common limitations, we designed and performed a
wide analysis of 109 different cryptographic functions
(or 130 different combinations of functions and their
parametrizations) by assessing their outputs with sta-
tistical tests. The output data is generated by Cryp-
toStreams
1
– our open-source framework for generat-
ing data from round-reduced cryptographic functions
in multiple input configurations. Testing was done us-
ing 414 statistical tests from four randomness testing
batteries (NIST STS (Rukhin et al., 2010), Dieharder
(Brown et al., 2013), TestU01 (L’Ecuyer and Simard,
2007) and BoolTest (S
´
ys et al., 2017)), unified into
a user-friendly tool called the Randomness Testing
Toolkit (RTT)
2
. The analysis is fully automatic and
replicable using these tools and the published starter
seeds.
Our paper brings the following contributions in
the areas of cryptographic function analysis and sta-
tistical testing of randomness:
1. Methodology for round-reduced function bias as-
sessment. We define a new methodology for test-
ing and deciding whether given round-reduced
function produces biased data using randomness
testing batteries with adjustable significance level
α. The methodology aims to eliminate false posi-
tives and produce conservative results.
2. Security margins analysis of cryptographic func-
tions. For 109 distinct round-reduced functions,
we establish the security margin with respect to
1
https://github.com/ph4r05/CryptoStreams
2
https://github.com/ph4r05/rtt-deployment
the perceived randomness of produced outputs.
We then compare the results with manual crypt-
analysis, as shown in Subsection 3.2. To the best
of our knowledge, dataset being analyzed is supe-
rior in terms of number of functions, tested strate-
gies and amount of data being tested to previous
research in the field.
2 RANDOMNESS TESTS AS
DISTINGUISHERS
Tests of randomness are proposed to detect specific
types of patterns (bias from randomness) in the anal-
ysed data. For example, a very simple test called
Monobit compares the counted frequency of binary
ones and zeroes, which shall be roughly equal in a
random stream. Each test can typically detect also
other types of patterns, but some others remain unde-
tected. For example, Monobit can detect bias from
randomness for the sequence (’011 011 011...’), but
the sequence (’01 01 01 ...’) will not be detected as
biased.
In practice, tests are grouped into testing suites
called batteries. We analyze tests belonging to com-
monly used batteries NIST STS, Dieharder, TestU01,
and recently introduced BoolTest. If tests are param-
eterized, the default settings from a battery are used.
Some tests in these batteries consist of more variants
(e.g., forward, backward, specific number of bits in
a searched pattern), resulting in 414 test variants in
total.
Randomness testing is based on statistical hypoth-
esis testing procedure that computes the statistical dis-
tance between the analyzed dataset and a synthetic
dataset produced by the idealized model (hypothesis).
Tests compute a certain type of statistic of bits and
evaluate how far is the computed statistic from the ex-
pected theoretical statistic for random data expressed
typically as the p-value (L’Ecuyer and Simard, 2007;
Marsaglia, 1995; Rukhin et al., 2010).
A small p-value below a chosen significance level
α leads to the rejection of the hypothesis (bias de-
tected). In such a case, the test forms a distinguisher
as it can distinguish analysed data from random data.
We can commit two types of error. Type I error when
the test rejects the hypothesis and data being gener-
ated by an unbiased random generator. Type II error
when the hypothesis is accepted although generated
by a biased generator.
The probability of the Type I error is equal to α
and is directly controllable. The probability of the
Type II error β is unknown but related to α – larger/s-
Large-scale Randomness Study of Security Margins for 100+ Cryptographic Functions
135

maller α corresponds to smaller/larger β. Also, the
size of the data affects both α and β.
Randomness testing is used for the two main ar-
eas: 1) To detect systematic bias or physical failures
of the TRNGs (true random number generators) and
2) To demonstrate insufficient confusion and diffusion
property (Menezes et al., 1996) of TRNGs. A physi-
cal device failure typically results in a constant or very
low variability output, which is easy to detect even by
simple tests like Monobit. A significantly more com-
plex bias is present for TRNGs with an insufficient
mixing property. The TRNG function designer typi-
cally improves the mixing property by increasing the
number of internal rounds (Menezes et al., 1996). It
should be noted that to conclude that a given gener-
ator is biased is a difficult problem due to the proba-
bilistic nature of randomness test result. In practice,
this problem is solved by repeated testing with addi-
tionally generated data until the observed bias is con-
firmed or bias disappears and the generator is declared
unbiased. Besides the probabilistic nature of test re-
sults, there are other problems concerned with the set-
tings of tests (trade-off between Type I and II errors,
which is also affected by the volume of the analysed
data), approximation used to compute p-values and
incorrect assumptions about their uniform distribu-
tion, incorrect test implementation, etc. We discuss
these problems in more detail in Section 4.1.
2.1 Building Function Testing Set
Every sequence we analyse in our experiments de-
pends on a cryptographic function (and its parame-
terization) included in the benchmarking dataset and
a structure of input data (counter – CTR, Low Ham-
ming Weight counter – LHW, pair of inputs with one
bit flipped and their parameterizations – SAC) pro-
cessed by the function. More details on these are pro-
vided below in Section 2.1.2. The sequences are pa-
rameterized by the following variables:
1. cryptographic function: a) the number of internal
rounds (on average, with range of five subsequent
rounds per function), b) key for stream and block
ciphers, seed for PRNG;
2. type (CTR, LHW or SAC) of processed input is
parameterized by: a) seed – defines seed of fixed
PRNG used to generate random blocks in SAC,
b) offset – defines initial value of CTR or LHW
counter,
3. the length of the output data generated (10 MB,
100 MB and 1000 MB).
The combination of used parameters – crypto-
graphic function (defined by a number of rounds and
a key in case of block ciphers), type of input (CTR,
LHW, SAC) and output data size (10, 100, 1000 MB)
– will be called configuration (shortly cfg) of the (po-
tentially) detectable biased generator. Each configu-
ration is used to generate three different sequences by
using different values of seed, offset and byte.
The following two sections explain the selection
of cryptographic functions, type of inputs and usage
of their parameters in more details.
2.1.1 Round-reduced Cryptographic Functions
The basic set of cryptographic functions was collected
mainly from various cryptographic function competi-
tions like AES or SHA-3 with an addition of well-
known functions with available source-code. Out of
these, we included only functions with available test
vectors and such that contain some internal round-
based structure and can be therefore round-reduced
to produce a function with a reduced complexity.
The rounds used for a particular function were it-
eratively selected so that there are at least two rounds
before and after the last round for which at least one
test detects a bias. In total, we analyzed 52077 round-
reduced function configurations (complete list of an-
alyzed functions is shown in Table 1).
2.1.2 Parameterized Input Data Generation
Three different data generation strategies are used to
analyze confusion and diffusion properties of the tar-
get function output, namely CTR, LHW and SAC.
The CTR strategy generates blocks of a particu-
lar size, each containing the current block index. In-
tuitively, the high bits are set to zero while the low
bits are iterating until the required amount of data is
generated. Note that block ciphers with extremely
small blocks, like 32-bit version SIMON and SPECK
ciphers, can produce only 2
32
· 32 bits ≈ 17.2 GB.
However, even shorter streams are having issues with
a too high uniqueness of blocks.
The LHW stands for Low Hamming Weight as
it generates input blocks with a fixed low Hamming
weight. The weight is derived from the block size as
it is required to avoid cycling of the generator, i.e.,
depleting all options on the block size. If the tested
function f has an input block size of 128 bits, and we
need to generate 100 MB of data, we set the Hamming
weight to 4, as 16
128
4
≈ 170 MB. The idea behind
the LHW strategy is to cover the whole input block
with small changes only, keeping the total Hamming
weight low, thus feeding the minimal possible entropy
to a function. Both CTR and LHW serve as low-
entropy input generators, allowing for inspection of
confusion properties of the cryptographic functions.
SECRYPT 2022 - 19th International Conference on Security and Cryptography
136

The SAC strategy aims to test the Strict Avalanche
Criterion (Webster and Tavares, 1985), where the
tested function shall generate two seemingly uncor-
related output blocks despite only a single bit flip in
the corresponding input blocks. It generates pairs of
blocks, where the first block in the pair is randomly
generated and the second one is almost the same ex-
cept for a single bit flip at a randomly selected po-
sition. Both blocks are then used as an input to the
tested function f . This strategy inspects mainly diffu-
sion properties of the cryptographic functions.
The strongest generating strategy is rnd, which
generates a random block using a given seed, with
the PCG64 generator (O’Neill, 2014). Similarly, ornd
strategy generates a random value only once, then re-
peats it each time a value is needed. The ornd usage:
generate random plaintext block, then repeat the same
value with different keys.
Let’s define a function configuration as a tuple
(function name, round). An input configuration de-
fines input streams fed to the function being ana-
lyzed, e.g., plaintext, key, seed. Function generates
output sequence that is analyzed with randomness
testing batteries. We have analyzed basic function
types: block ciphers, stream ciphers, hash functions,
PRNGs. Each function type differs in input configu-
rations being used.
A hash function takes an input string and trans-
forms it to the output block. An input configura-
tion is thus a configuration of an input stream of
blocks x
i
fed to the hash function. E.g., CTR con-
figuration for function f generates a stream of values:
( f (x
0
), f (x
1
),···) = ( f (x
i
))
i
. Hash functions use con-
figurations: {ctr, lhw, sac}.
PRNG takes an input seed and generates long
stream of output data. One testing approach is to
generate a seed randomly and analyze a long out-
put sequence of the PRNG. However, it does not
yield useful results as PRNG internal state changes
when generating output sequences. It is difficult to
spot randomness biases for randomness testing bat-
teries in this setting. Moreover, PRNGs usually do
not have internal round structure so it is not possible
to analyze weakened function versions, we have to
test PRNG in a full strength. We thus have two ap-
proaches when testing PRNGs. 1) Test N bytes with a
fixed seed, 2) an alternative testing approach by re-
peating the following: reseed PRNG with an input
stream block, capture B output bytes, reseed and cap-
ture again: ( f (seed=s
i
)[: B])
i
. An input configuration
defines seed stream. PRNGs testing strategies: {zero,
ctr.seed, lhw.seed, sac.seed, rnd.seed}.
Stream ciphers are similar to PRNGs in the test-
ing context. Feeding a specific plaintext to the stream
cipher does not bring benefit from the testing perspec-
tive as it is only XORed with the keystream generated
by the stream function, adding unnecessary entropy.
We thus only test the keystream itself, feeding zero
vector plaintext to the function.
Stream ciphers usually have internal round struc-
ture that makes analysis of a long keystream from the
weakened cipher possible. Input strategy zero: gener-
ate a random key k
0
, generate a long keystream with
the k
0
. The output sequence is: ( f (key=r
0
)[: N]),
where N is the desired keystream length. A .key test-
ing strategy generates a sequence of first B bytes of
the keystream for key k
i
: ( f (key=k
i
)[:B])
i
. Input
strategy defines how (k
i
) is generated. Stream func-
tion testing strategies: {zero, ctr.key, lhw.key, sac.key,
rnd.key}.
Block Ciphers: Take two inputs of a fixed length:
key, plaintext and output a fixed length block. We use
two different input configuration types. Input config-
uration: fix a random key k
0
, derived from a seed,
generate input blocks x
i
. ( f (key=k
0
,x
i
))
i
. Testing
strategies: {zero, ctr, lhw, sac}.
Alternative approach is to change a key and ob-
serve the function behavior. This testing strategy can
reveal e.g. sensitivity to weak keys. Key configura-
tion defines how (k
i
,x
i
) sequence is generated. The
tested output is then ( f (key=k
i
,x
i
))
i
. The simplest
key strategy is to generate k
i
via CTR mode and keep
x
i
= 0. We call such strategy ctr.key..zero.inp. Block
cipher testing strategies: {zero, ctr, lhw, sac, rnd.key},
∪ {ctr.key, lhw.key, sac.key} ×{..zero.inp,..ornd.inp}.
A stronger strategies with ..ornd.inp suffix gener-
ate a random plaintext block once and reuses the
same value with different keys, i.e., x
i
= x
j
=
randNext(seed).
Seeds: Using given strategies we obtain an out-
put sequence for a function and input configuration.
Then randomness testing batteries are used to assess
whether the sequence contains statistical biases. If
enough biases are found (defined later) we conclude
the hypothesis about an uniform output sequence dis-
tribution for the function configuration being rejected,
in short, function at a round r was rejected.
In order to reduce false-positives we use 3 differ-
ent input configurations parameters per the function
configuration F
c
. I.e., when using CTR generator,
we use an offset to generate 3 different counter se-
quences. Sequence 1 starts at offset 0, sequences 1,2
have offsets o
i
,o
2
such that sequences do not over-
lap on the lengths used for testing. Technically, if
the output length per one block is B bytes, setting
offset O is done by setting the most significant byte
of the counter to O, e.g., (S
2
)
0
= 2 ∗ 2
8∗8
,(S
2
)
1
=
2 ∗ 2
8∗8
+ 1,···
Large-scale Randomness Study of Security Margins for 100+ Cryptographic Functions
137

LHW generator offset is realized by setting ini-
tial LHW state so that the combination space is par-
titioned to 3 disjoint parts. Technically, we compute
a number of combinations for a weight w on B bits
as L =
w
B
. Offsets are then o
i
= L ∗
i
3
. Using rank-
ing algorithm we then compute o
i
th combination for
w
B
and use it as a starting position for LHW. As SAC
uses randomly generated values, we randomly gener-
ate seeds s
i
so that SAC generates sequences S
i
differ.
F
c
is rejected if at least 2 out of 3 output sequences
are rejected. The reason for the usage of three differ-
ent seeds is to make the likelihood of the (unwanted)
usage of a key with the value degrading the function
confusion and diffusion properties (called weak key)
very small. The weak keys are very infrequent or
shown to be non-existent for common cryptographic
functions with a full number of internal rounds. How-
ever, they are significantly more likely to occur with
the reduced number of rounds we are using.
CryptoStreams is highly configurable; we pre-
configured more than ten additional general testing
strategies. We provide the list of all our strategies and
their description at the GitHub repository
3
. The total
number of the data configurations analyzed is: 6264x
10 MB, 6526x 100 MB and 4569x 1 GB. In total, we
analyzed 5160.4 GB of data.
3 RESULTS
The following section summarizes basic observations
from collected testing data.
3.1 Study Limitations
We used default settings of tests as such parame-
ters are commonly used in practice. Usage of other
non-standard parameters may provide a different re-
sult. Due to high computational costs only {10, 100,
1000} MB data sizes were tested. Using larger data
sizes could reveal more subtle biases and detect more
rounds. Also, some tests were not run as they require
more data for analysis, e.g., Test U01 BigCrush.
From all possible data generation strategies, we
used only a small subset that we deemed the most
promising, as defined in Section 2.1.2. New genera-
tion strategies may reveal another unexpected biases.
Also, no detailed analysis of patterns found for par-
ticular cryptographic functions was performed.
3
https://github.com/ph4r05/SecurityMarginsPaper
3.2 Security Margins of Cryptographic
Functions
The number of rounds for which a distinguisher was
automatically constructed by at least one test can be
used to establish the security margin of a given cryp-
tographic function included in the CryptoStreams bat-
tery. We also performed an extensive literature survey
to identify the highest number of rounds for which
any distinguisher was published.
Classical techniques in cryptanalysis, such as lin-
ear or differential cryptanalyses, require determin-
ing some bias in the ciphertext, which then leads to
a recovery of (some) bits of key, plaintext or both.
The designers of cryptographic functions try to make
the function complex enough to hide any such bias,
usually by increasing the number of function’s inter-
nal rounds. For cryptographic functions now consid-
ered secure (like AES), neither the general-purpose
tests nor the custom tests by human cryptanalyst were
shown to detect bias in a function with a full number
of rounds as specified by its designers.
Still, we can weaken a function complexi-
ty/strength (e.g., in the number of rounds), while test-
ing the output for a bias presence. If the number of
rounds where the bias is detectable is too close to
the full number of rounds (unweakened function), the
function shall be considered less secure and in de-
mand for strength improvement (e.g., by increasing
the number of rounds). We define the security mar-
gin as the difference between the number of rounds,
for which a distinguisher can be still constructed and
the total number of rounds of that function. More pre-
cisely:
sec. margin( f ) = 1 −
max(i) : f
i
output is non-random
n
,
where f
i
stands for function f limited to i rounds and
n is the total number of rounds of the function f as
specified by its authors. For example, there exists a
distinguisher for a 3-round AES, but not for the 4-
round one. AES-128 has 10 rounds in total, so the re-
sulting security margin against analyzed randomness
tests is 70%.
Security Margins per Function Type. Results in
Table 2 indicate that security margins of all func-
tion types are similar when considering only input
type strategies. However, key type strategies reduce
security margins significantly. Also, hash functions
have typically greater security margins than block and
stream ciphers using key strategies.
Measured security margins of MPC hash func-
tions are high, indicating that testing batteries might
SECRYPT 2022 - 19th International Conference on Security and Cryptography
138
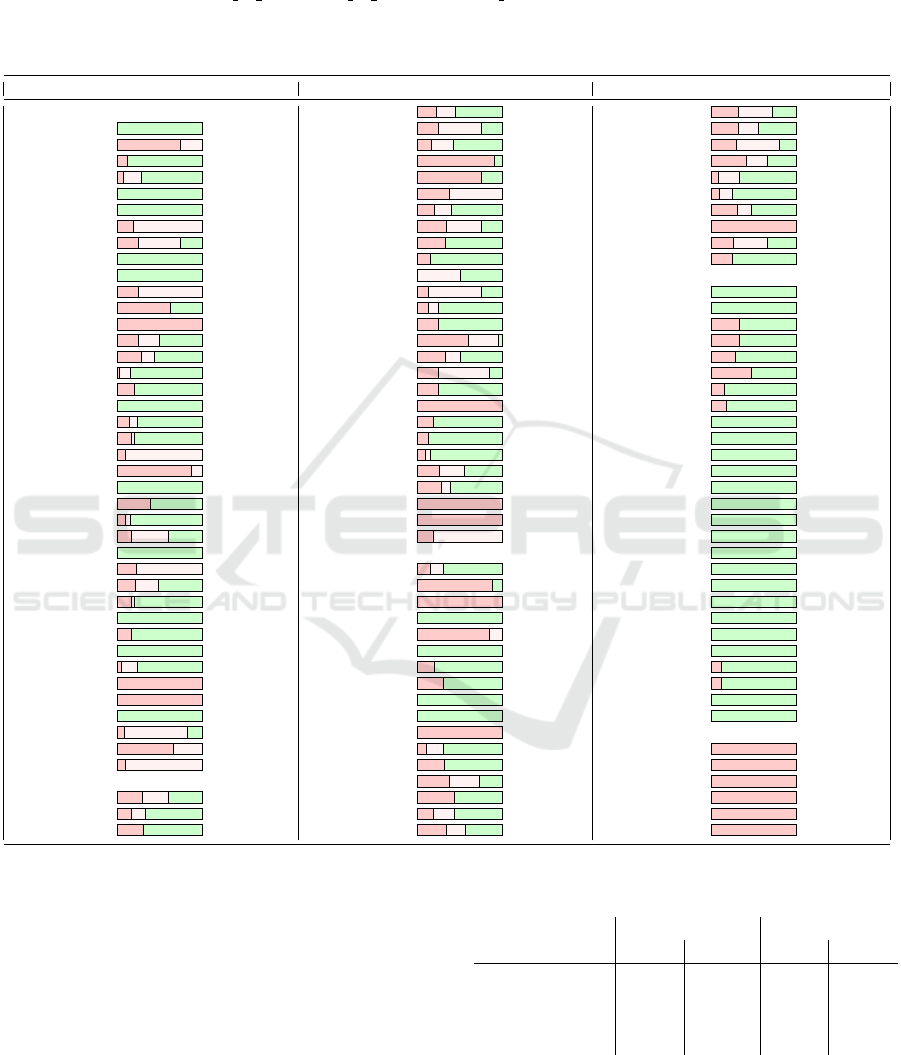
Table 1: The security margin for each tested cryptographic function included in the CryptoStreams testbed. The table depicts
the maximal number of rounds for which some bias was reliably detected for at least one data configuration used (red bar).
Additional rounds with a practical distinguisher published in research literature are shown as a pink bar (typically larger than
randomness tests). If no published and practical (complexity < 2
80
) attack is found, sign ”−” is used. The numerical value
of rounds is encoded as rounds by RTT/rounds by literature/rounds total. The average bar shows the median of observed
percentage security margin with first and third quantile in the parentheses. MPC functions (Aly et al., 2020) are crypto-
graphic functions optimizing their arithmetic complexity (used for example in zero-knowlege proof systems or multi-party
computation protocols).
Function Security margin Function Security margin Function Security margin
Hash functions CAMELLIA 4/8/18 RECT.K80 8/18/25
Abacus 0/-/280 CAST 3/9/12 RECT.K128 8/14/25
ARIRANG 3/4/4 FANTOMAS 2/5/12 R.RUNNER.K80 3/8/10
AURORA 2/-/17 GOST 29/20/32 R.RUNNER.K128 5/8/12
BLAKE 1/4/14 IDEA 6/4/8 SPARX-B64 2/8/24
Blender 0/-/32 KASUMI 3/8/8 SPARX-B128 3/8/32
BMW 0/-/16 KUZNYECHIK 2/4/10 SPECK 10/15/32
Boole 3/16/16 LBLOCK 11/24/32 TEA 32/5/32
Cheetah 4/12/16 LEA 8/8/24 TWINE 9/23/35
CHI 0/-/20 LED 7/-/48 XTEA 8/8/32
CubeHash 0/-/8 MARS 0/8/16 MPC functions
DCH 1/4/4 MISTY1 1/6/8 GMiMC.S45a 1/-/121
DynamicSHA 10/-/16 NOEKEON 2/4/16 GMiMC.S128e 1/-/342
DynamicSHA2 17/17/17 PICCOLO 6/5/25 LowMC.S80a 4/-/12
ECHO 2/4/8 PRIDE 12/19/20 LowMC.S80b 4/-/12
ESSENCE 9/14/32 PRINCE 4/6/12 LowMC.S128a 4/-/14
Gost 1/5/32 RC5-20 5/17/20 LowMC.S128b 120/-/252
Grostl 2/-/10 RC6 5/5/20 LowMC.S128c 20/-/128
Hamsi 0/-/3 ROBIN 16/16/16 LowMC.S128d 16/-/88
JH 6/10/42 ROBIN
⋆
3/-/16 MiMC.S45 1/-/116
Keccak 4/5/24 SEED 2/-/16 MiMC.S80 1/-/204
Lesamnta 3/32/32 SERPENT 3/5/32 MiMC.S128 1/-/320
Luffa 7/8/8 SHACAL2 21/44/80 Poseidon.S80b 0/-/8
MCSSHA-3 0/-/1 SIMON 19/26/68 Poseidon.BLS12 0/-/8
MD5 25/-/64 DES 16/16/16 Rescue.S45a 0/-/10
MD6 10/16/104 TRIPLE-DES 16/-/16 Rescue.S128e 0/-/10
RIPEMD160 14/48/80 TWOFISH 3/16/16 RescueP.128a 0/-/27
Sarmal 0/-/16 Stream ciphers RescueP.128b 0/-/27
SHA-1 18/80/80 Chacha 3/6/20 RescueP.128c 0/-/14
SHA-2 14/31/64 DECIM 7/-/8 RescueP.128d 0/-/14
SHA-3 4/5/24 F-FCSR 5/5/5 RescueP.S80a 0/-/18
Shabal 0/-/1 Fubuki 0/-/4 RescueP.S80b 0/-/18
SHAvite3 2/-/12 Grain 11/13/13 RescueP.S80c 0/-/9
SIMD 0/-/4 HC-128 0/-/1 RescueP.S80d 0/-/9
Skein 4/17/72 Hermes 2/-/10 Starkad.S80b 1/-/8
Tangle 80/80/80 LEX 3/-/10 Starkad.S128e 1/-/8
Tangle2 80/-/80 MICKEY 0/-/1 Vision.S45a 0/-/10
TIB3 0/-/16 Rabbit 0/-/4 Vision.S128d 0/-/10
Tiger 2/19/23 RC4 1/-/1 PRNGs
Twister 6/9/9 Salsa20 2/6/20 Std.LCG 1/1/1
Whirlpool 1/10/10 SOSEMANUK 8/-/25 Std.MTwister 1/1/1
Block ciphers Trivium 3/5.8/8 Std.SubCarry 1/1/1
AES 3/6/10 TSC-4 14/-/32 U01.ULCG 1/1/1
ARIA 2/4/12 CHASKEY 3/7/16 U01.UMRG 1/1/1
BLOWFISH 5/4/16 HIGHT 11/18/32 U01.XorShift 1/1/1
not be directly usable for this function family. We
hypothesize this is due to usage of algebraic building
blocks which are difficult to detect with randomness
testing batteries. To verify the claim, we tested a sim-
ple function f (x) = x
3
(mod p), where p is a 255-bit
prime. The function f was fed with a strongly biased
input distribution - normal distribution to produce 1
GB of output data. The output was tested with testing
batteries (after applying rejection sampling transfor-
mation, described in Section 4.2). There was no bias
detected in any of 10 tested streams. We thus con-
clude that even a simple algebraic function such as
Table 2: Aggregate security margins (SM, average and me-
dian values) for various function types and testing methods.
Function type
Input SM [%] Key SM [%]
avg med avg med
Hash 76.37 84.52 - -
Block cipher 78.84 80.62 68.86 74.64
Stream cipher 80.77 90 64.59 70
MPC 93.94 100 95.85 100
f can make the output indistinguishable from PRNG
stream for testing batteries. In fact, the described
function f is a basic building block of MiMC hash
function.
Large-scale Randomness Study of Security Margins for 100+ Cryptographic Functions
139
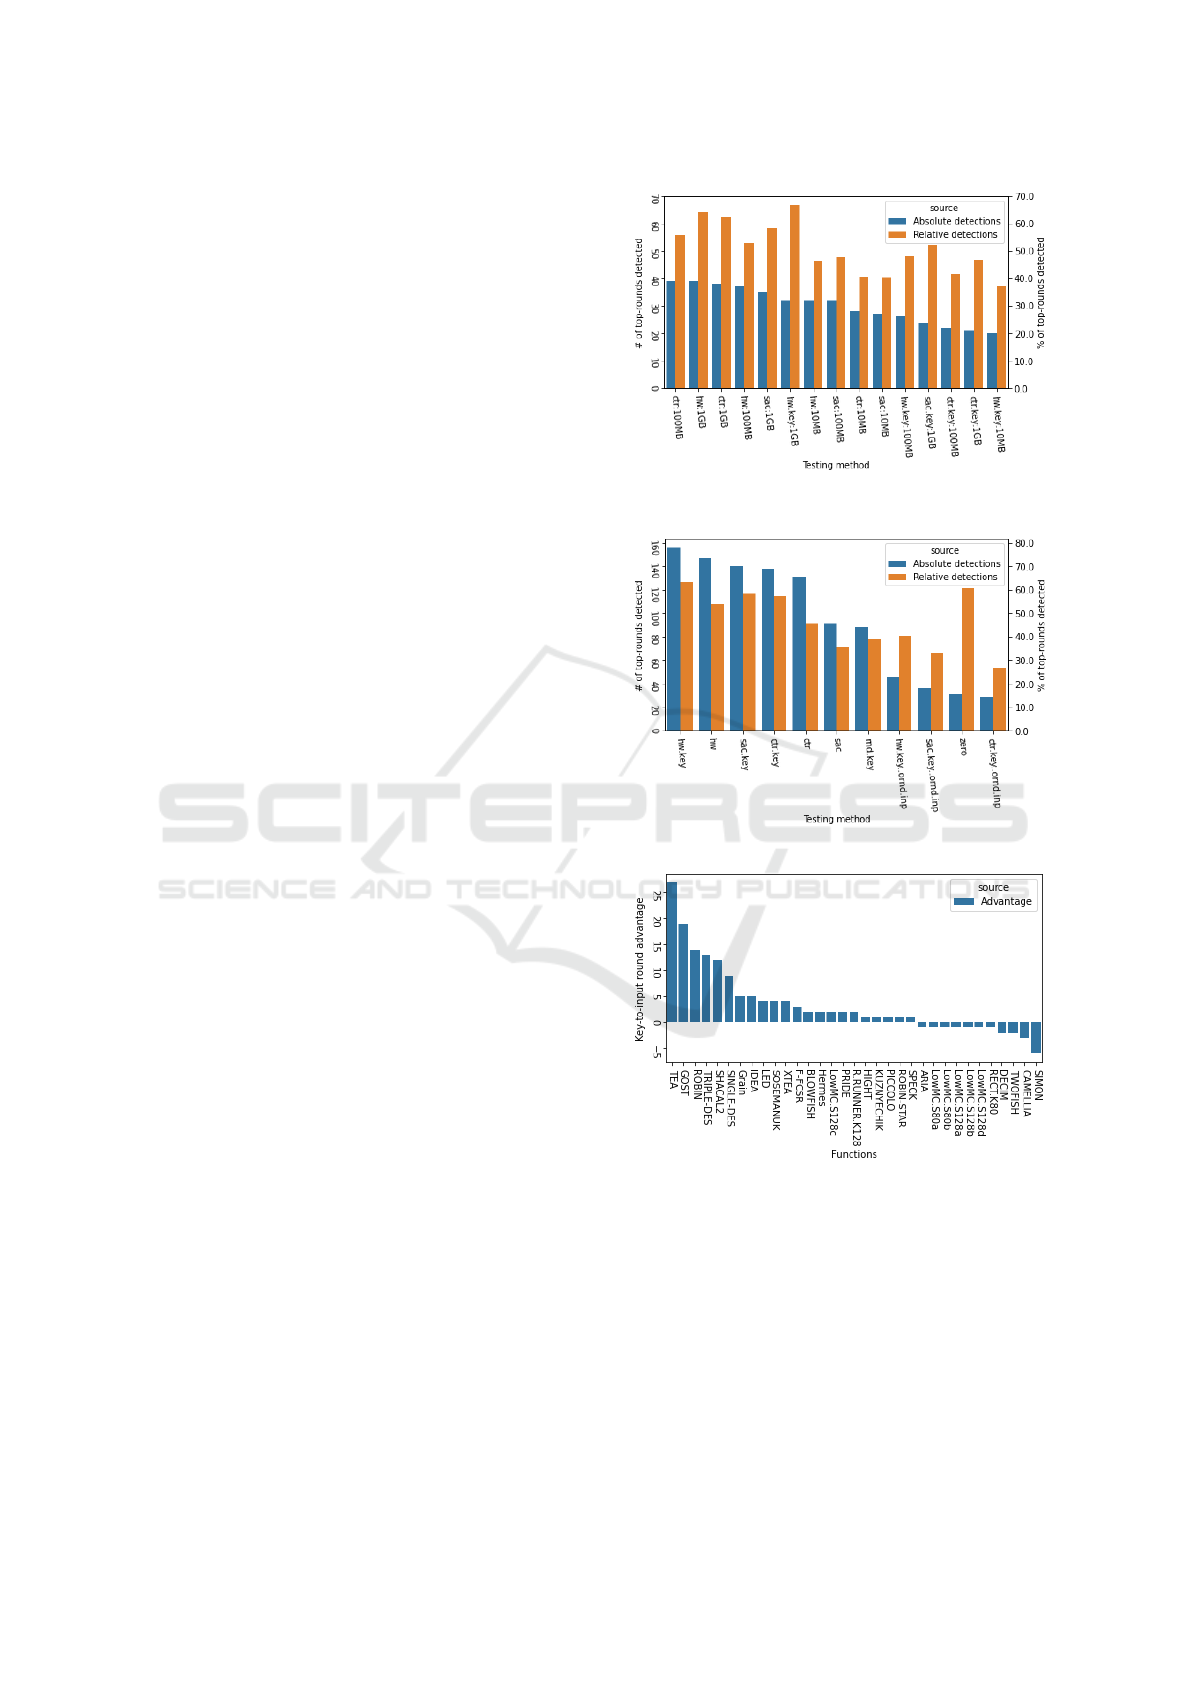
Used Methods. Figure 1 displays both absolute and
relative numbers per input generation methods for
breaking the highest broken round (top-round) of the
functions. From the results we can conclude that the
lhw strategy is very effective in breaking top-rounds,
both in input and key variants.
Also note that key variants have better relative suc-
cess rate than input variants, indicating that crypto-
graphic functions are more prone to biases when low-
entropy keys are used compared to low-entropy in-
puts. Also, strategy rnd.key is the most difficult to
detect as the entropy fed to the key of the function is
high, it still managed to detect 37% of configurations
it was used on.
Note that strategy zero is used for all stream func-
tions with zero input as they generate long keystream
with fixed random keys.
Considering input methods coupled with data
sizes we observe that large data set 1000 MB domi-
nate detection capabilities in all main methods {lhw,
ctr, sac}. Interestingly, {lhw, lhw.key} on 10 MB out-
perform ctr on 100 MB.
Key Method Dominance. We observed that in 24
(44.44%) cases the key variant was better than input
variant for given inputs, same performance was seen
in 19 cases (35.19%), input variant was better in 11
cases (20.37%). In some scenarios, the key to the in-
put advantage is quite significant.
For example, Triple-DES is detected only to round
3 with input strategies, but the key strategy manages
to detect all 16 rounds, even rnd.key, which is the
most difficult strategy to detect. That means there are
serious biases in Triple-DES output for some keys.
A hypothesis is that weak keys known for Triple-
DES were in the input stream, causing the cipher-
text to contain biases. On the other hand, the SI-
MON function was detected with key methods up to
14 rounds but input methods reached 19 rounds. Fig-
ure 1c shows key to input method advantage with re-
spect to the maximum round detected per given func-
tion.
RC4 is known to contain biases on the beginning
of the keystream. Experiments were not able to detect
biases using zero strategy, i.e., using keystream with
a random key. However, all tested key methods de-
tected biases with 100 MB of data and more, even the
most difficult rnd.key strategy.
Data Size. This paragraph focuses on detection ca-
pabilities when all variables are fixed, besides length
of the input data stream. We take results over all de-
tected rounds, not just a top-round detections. The
most observed event was that changing input data
(a) Testing methods breaking top-rounds, with
sizes.
(b) Figure 1a with aggregated sizes
(c) Key to input method detection advantage for
breaking the highest round of the given function.
Methods axis shows number of test methods reject-
ing the same round. Entries with no advantages are
skipped for better readability.
Figure 1: Methods breaking top-level rounds and key-to-
input methods advantage in breaking the highest rounds.
stream did not increase detection capability, with
1694 detections (80.94%).
In general, one would assume that bigger the in-
SECRYPT 2022 - 19th International Conference on Security and Cryptography
140
put stream the easiest is to spot biases for the ran-
domness tests. In particular, it means that given con-
figuration was not detected on lower input size but it
was detected by all higher data sizes. This turned out
to be the case for 397 detections (18.97%). For ex-
ample, AES round 3 using lhw.key strategy was not
detected on 10 MB input but since 100 MB. Similarly
for Blowfish round 3 with sac strategy.
We also observed an inverse effect, i.e., detection
was successful on a lower data size, but higher data
sizes did not detect the stream. This happened in a
single case (0.05%). Our hypothesis is that that bias
was lost in a noise as data size increased, i.e., it was
probably a fluke. The case is Kasumi round 3 with
the lhw.key strategy, bias was observed only in the
10 MB input stream. Considering no other strategy
could detect the same function configuration, we can
assume the detection was a fluke. Rest of the cases
are fluctuations where bias was either observed or un-
detected on a 100 MB data size, observed in a single
case (0.05%).
Table 3 shows a result subset of a maximal de-
tected round depending on a chosen method and in-
creasing input size for the method. Apparently, the
highest detected round is strongly dependent on the
mentioned parameters.
Table 3: Maximal breaking rounds for selected (function :
method) pairs depending on different input sizes.
Function : method 10 MB 100 MB 1 GB
MD5 : lhw 17 20 25
: sac 13 16 20
DES : lhw 4 6 7
: rnd.key 16 16 16
SIMON: ctr 17 18 19
: lhw 15 17 17
: lhw.key 11 11 12
GOST : ctr.key 10 11 12
: lhw.key 21 25 29
: lhw.key..ornd.inp 20 22 27
: rnd.key 1 1 1
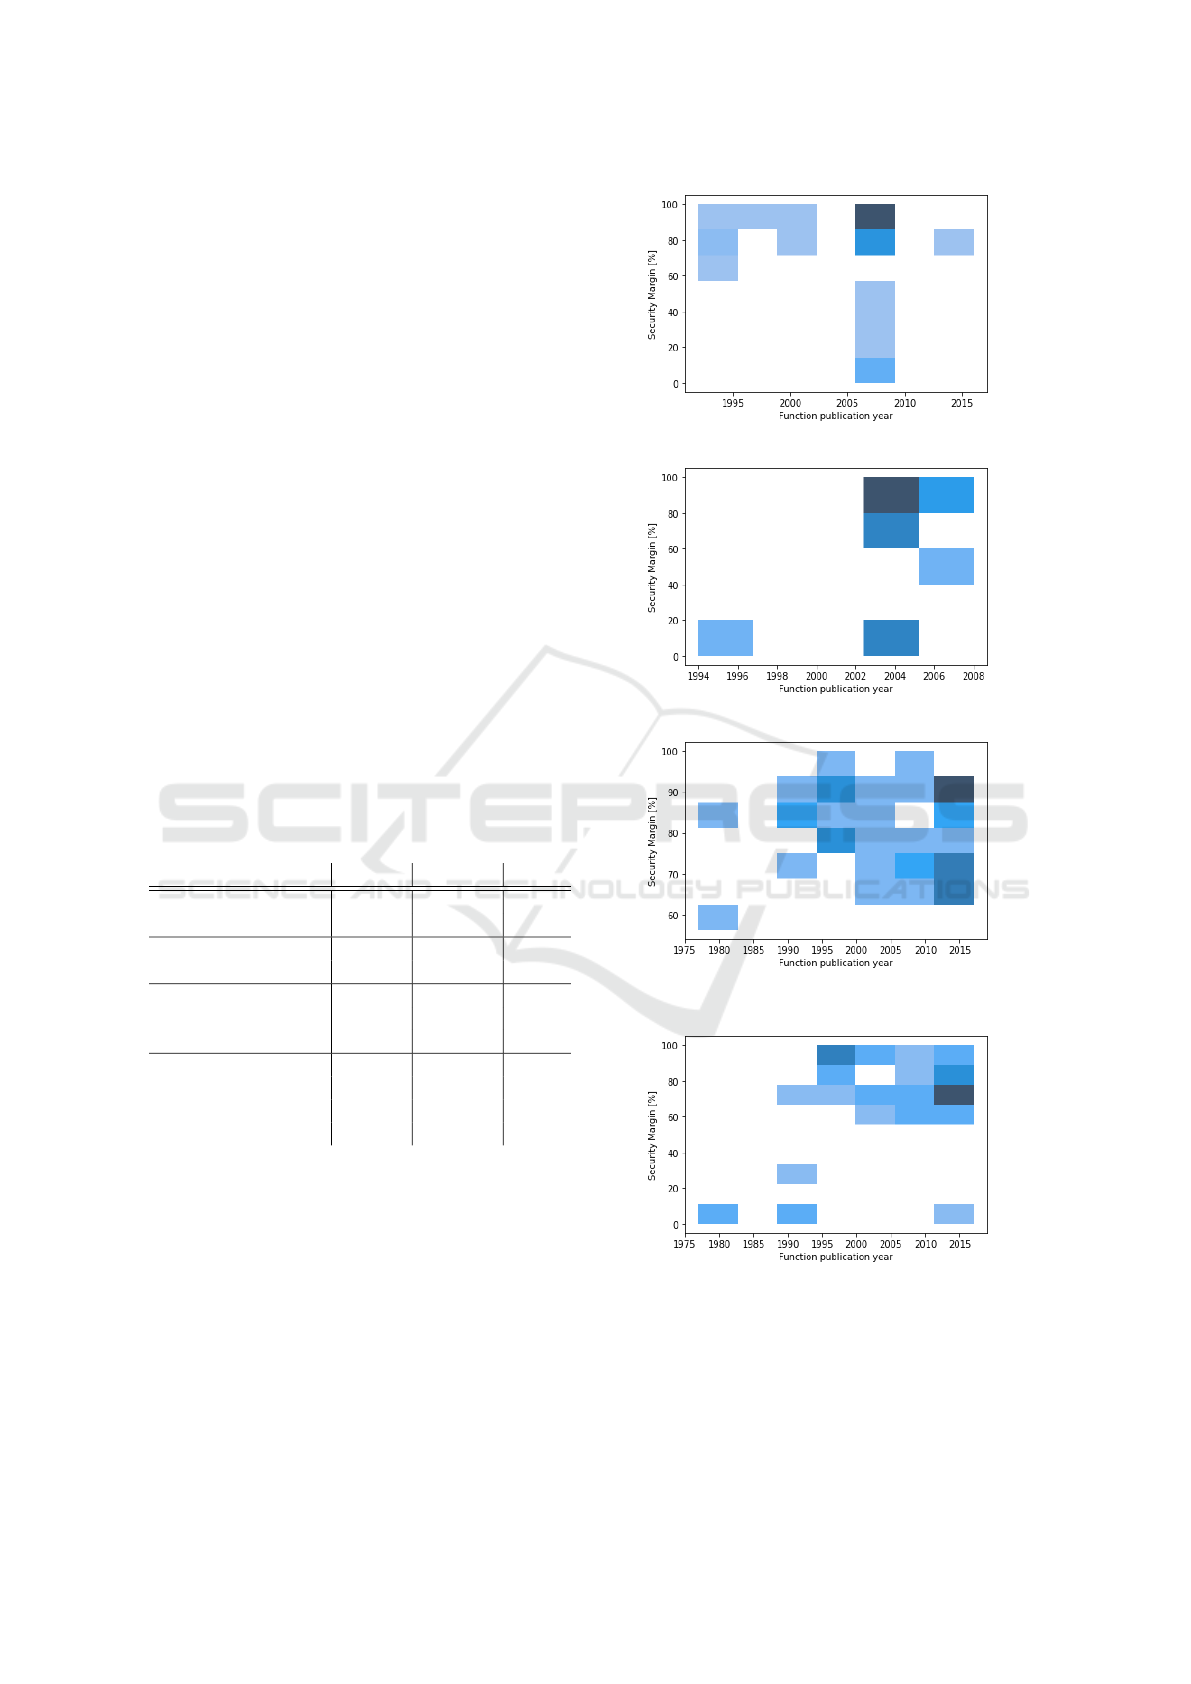
Function Publication Year. Figure 2 shows secu-
rity margin heat maps (the darker the more functions
belong to the bin) for particular function types based
on the year of a publication of the function. Note
that hash and stream function year variance is low as
majority of our function dataset comes from eStream
and SHA-3 competitions, thus many of the functions
were published in the same year. From the figures we
can conclude there is a high variance in security mar-
gins. Yet, we cannot conclude that older functions
have lower security margins.
(a) Security margin for hash functions
(b) Security margin for stream ciphers
(c) Security margin for block ciphers, input meth-
ods
(d) Security margin for block ciphers, key methods
Figure 2: Security margin heat maps based on the publica-
tion year of the functions analyzed. The results generally
show increased number of published functions around the
related competitions (e.g., AES or SHA-3), better security
margin for the functions introduced later, but with excep-
tions of the broken ones.
Large-scale Randomness Study of Security Margins for 100+ Cryptographic Functions
141

Bias Strength Measure. There are several ways to
define a measured bias strength. E.g., ratio of ran-
domness tests detecting the sequence as biased on
a level α, minimal p-value observed, number of re-
jected seeds, etc. Intuitively, lower rounds of a cryp-
tographic function should have stronger biases com-
pared to higher rounds. Experiments confirm that this
is true for majority of tested functions. To demon-
strate this, lets observe ratio of rejecting tests for the
SIMON function with the lhw input strategy on 100
MB of data, starting from round 11: 0.88, 0.83, 0.75,
0.68, 0.44, 0.37, 0.22, 0.07 (round 18), while round 19
is first with no bias detected with only 3/735 rejecting
tests. On the other hand, there are functions which do
not have such smooth bias progression, for example
LED using lhw with 100 MB, rounds {1,2,3} are all
detected with 0.93 tests, round 4 has 0 test detections.
4 RANDOMNESS TESTING FOR
MASSES
We created a practical, generally usable tool for ran-
domness testing, the Randomness Testing Toolkit
(RTT), which integrates four randomness testing bat-
teries (NIST STS, Dieharder, TestU01, and BoolTest),
under simple and unified command-line and web-
based interface. The main benefits are: a) the sim-
plicity of the randomness testing for the user, b) pre-
configured batteries and test configurations
4
c) unified
result interpretation, and d) significant parallelization
to test large amounts of data.
4.1 Test Detection Evaluation
The goal of our evaluation is to correctly (with min-
imal Type I and II errors) identify biased genera-
tors defined by the parameters (cryptographic func-
tion, round, key, strategy and size). P-values are
the only results of tests we use in our evaluation to
identify biased/unbiased generators. Interpretation of
a p-value (rejection/non-rejection of a hypothesis –
shortly fail/pass) is based on the significance level α
chosen by a tester. P-value below α indicates biased
statistic that is interpreted as “generator of the anal-
ysed data fails the given test”. Choice of the signifi-
cance level is crucial since it affects the probabilities
of both Type I and II errors.
Batteries use a conservative value α
FAIL
is used to
minimize Type I error, i.e. false-positive. Conserva-
4
E.g., TestU01 is a randomness testing library that re-
quires user to develop a testing program, choose which tests
to run, etc.
tive α determines a bigger Type II error as both errors
are related. The only way how to decrease Type II er-
ror, for fixed Type I error, is to increase the volume of
analysed data.
Each test of the original batteries computes
two types of p-values: a) standard “first-level” p-
value computed by a test for one sequence, b)
“second-level” p-value computed by uniformity test
(Kolmogorov-Smirnov, Anderson-Darling, etc.) for
a sequence of first-level p-values, checking whether
first level p-values are uniformly distributed on the
[0,1) interval.
In the RTT, the result of each test is a second-level
p-value. It is computed typically for several tens or
several hundreds of (first-level) p-values computed by
the test. Some tests compute several second-level p-
values (over the same set of first-level p-values) using
different uniformity tests. The p-values (first-level or
second-level) computed by the original batteries (and
also by the RTT) are not exact due to approxima-
tion methods used in the tests. The sequence fails a
given test if at least one of the second-level p-values
is smaller than the significance level. Approximation
of the null distribution is used in the computation of
first-level p-values. This introduces some small errors
that are accumulated in the second-level p-values. To
find suitable significance level α, we analyzed refer-
ence random data produced by full-round AES-128 to
determine number of false positives, taking approxi-
mation errors into account.
The initial analysis of data showed that
three tests behave differently than others. The
smultin MultinomialBitsOver from the Rabbit
sub-battery of TestU01 has a significantly biased
proportion of small p-values. Random Excursion and
Random Excursion Variant tests from the NIST STS
compute different numbers of first-level p-values for
a fixed size of the sequence hence significance of
their results varies. We excluded the results of these
three tests from all our experiments (including one
with the reference data).
BoolTest (Sys et al., 2017) battery comes in two
versions. BoolTest2 returns directly a p-value and it
works without precomputations. BoolTest1 is eval-
uated using confidence intervals of Z-scores from
empirically computed reference distibution (for each
BoolTest setting) using 10
5
of random sequences.
This gives the significance level α
BT 1
= 10
−5
for the
BoolTest, for RTT we use the same α
RT T
= 10
−5
.
4.2 Function Bias Classification
As mentioned in Section 2.1.2, we claim the input
configuration is rejected if at least 2 of 3 tested seed
SECRYPT 2022 - 19th International Conference on Security and Cryptography
142

variants are rejected. This section describes the de-
cision methodology for a seed variant to be claimed
rejected. We set global α = 10
−7
to minimize false-
positives across our dataset.
Reference Runs, Cut-off Threshold. We ran RTT
tests on 75 000 reference input configurations, i.e.,
full 10 round AES-128 using ctr input mode with a
random key. The reference test data results show be-
haviour of statistical tests on a good-quality pseudo-
random input data, namely tests p-value distribution
on a reference data and distribution of number of si-
multaneously failing tests per analyzed sequence with
α
T
= 10
−5
. From the reference test data we can estab-
lish a cut-off criteria on a number of simultaneously
failing test per sequence run to be 5% of performed
test with α ≤ 10
−7
. Reference runs showed that the
maximal number of simultaneously failing tests with
α
T
for a single sequence is 3 out of 216 tests (1.38%,
such event occurred 9 times, 0.016%). As the number
of analyzed sequences in our cryptographic function
dataset is smaller (54 500), the cut-off limit is set con-
servatively enough to avoid false-positives. Ideally,
a further study of reference p-value distributions and
number of test rejections per tested sequence would
be needed to model the distribution and to avoid com-
putation of reference data in sizes of the tested set.
It would also help setting cut-off limit precisely for
given α. The reference data study is left for a future
work.
Hommel Correction. In the ideal case, the propor-
tion of failed sequences for a given test is given by
the significance level α for an unbiased generator. In
such a case, the number of failed sequences is given
by n ∗ α for number of sequences n. It is clear that
the probability that a sequence (generated by an unbi-
ased or unbiased generator) fails one of the used tests
increases with the number of tests m. It is possible
to compute the actual significance level α
m
(sequence
fails m tests if it fails at least of the tests) for m tests
although we used α as the significance level for each
test using p-value correction methods.
If the number of tests rejecting the seed is below
the cut-off threshold, we apply the Hommel correc-
tion (Hommel, 1988) on all p-values collected from
the seed run, using given α to tell whether tested se-
quence is rejected. Hommel correction is used to de-
cide null-hypothesis rejection using set of positively-
correlated p-values representing results from ran-
domness tests and their associated alternate hypothe-
ses. The correction keeps the probability of a false-
positive of the p-value set below α. Note that p-values
are positively correlated as the tests test the same in-
put sequence and also due to overlap of features be-
ing assessed by the tests, i.e., a particular bias pattern
can cause multiple tests to reject the input stream. To
the best of our knowledge, this is a new method for
assessing biases in output of round-reduced crypto-
graphic functions using different positively-correlated
randomness tests.
BoolTest1 Rejection. BoolTest1 works with a pre-
computed reference distribution, thus the α
BT 1
is
fixed to an inverse to a number of reference re-
sults. As α
BT 1
< α BoolTest1 would never help re-
ject the tested sequence. We thus use observation
from cut-off threshold analysis. There are always 36
BoolTest1 tests executed per tested sequence. From
the reference data we observed that BoolTest1 results
have negligible correlation and rejection happens in
36n ∗ α
BT 1
on average. BoolTest1 is thus removed
from Hommel correction and we use BoolTest1 cut-
off threshold 3 to consider output sequence rejected
with α ≤ 10
−7
. Due to small correlation among
BoolTest1 test fails, distribution of a number of simul-
taneously failing tests per input can be easily simu-
lated without need to run BoolTest1 and approximate
it with Beta-Binomial distribution.
Prime Order Functions. Randomness testing bat-
teries are suited to test byte-aligned data. However,
cryptographic functions used in context of MPC /
zero-knowledge proofs using algebraic construction
can work in prime fields F
p
, where p is a prime. Such
function F output vectors F
m
p
. Testing batteries thus
cannot be na
¨
ıvely applied to output values x
i
< p, as
interval [p, 2
8⌈lg(p)/8⌉
) is not covered by the function
output. Thus batteries trivially reject the output even
though the output is uniformly distributed on the in-
terval [0, p). We thus need to apply an transforma-
tion T to the function output that transforms uniform
prime order elements x
i
to a uniform byte-aligned out-
puts x
′
j
before testing it with the batteries. The sim-
plest approach is to use a rejection sampling, i.e., find
byte-aligned boundary M = 2
8⌊lg(p)/8⌋
− 1 ≤ p. Out-
put x is then ignored if x > M. Rejection sampling
strategy requires more data to be generated as portion
of the generated data is discarded. We also used more
advanced transformations based on inverse function
sampling, i.e., directly stretching uniform distribution
from [0, p) to [0,M] using auxiliary randomness so all
F output values are used.
Large-scale Randomness Study of Security Margins for 100+ Cryptographic Functions
143

5 RELATED WORK
In this section, we firstly discuss published works
in cryptanalytical statistical testing, secondly the
analysis of tests of randomness in RTT. There ex-
ist many other statistical batteries except for those
used in RTT (NIST STS, Dieharder and TestU01):
Donald Knuth (Knuth, 1969), Diehard (Marsaglia,
1995), Crypt-X suite (Caelli et al., 1998), Prac-
tRand (Doty-Humphrey, 2014), RaBiGeTe (Pi-
ras, 2004), CryptoStat (Kaminsky and Sorrell,
2013), YAARX (Biryukov and Velichkov, 2014),
ENT (Walker, 2008), SPRNG (Mascagni and Srini-
vasan, 2000), gjrand (Jones, 2007) and the BSI test
suite (Schindler and Killmann, 2002).
There are two cryptanalytic approaches that are
based on the randomness testing. In the first approach,
a cryptographic function (hash, block or stream ci-
pher) is turned into a PRNG, and this PRNG is used
to generate a sequence of bits/bytes and a test of ran-
domness is applied to the sequence. In the second
approach, the cryptographic function (and its random-
ness) is analysed directly. Tests of randomness are ap-
plied here to check whether the given function forms
a random function or a random Boolean function.
Nice overview of papers covering both approaches
can be found in (Kaminsky, 2019), section “Related
Work”. Next, we will list only sources not included
in (Kaminsky, 2019) or papers that are the most rele-
vant to our approach.
One of the evaluation criteria for AES candidates
was “their demonstrated suitability as random number
generators.” Therefore, AES candidates were eval-
uated by NIST STS batteries under several testing
scenarios. Murphy in (Murphy, 2000) described the
methodology of testing and its weaknesses. Soto in
(Soto, 1999) reported randomness evaluation of fif-
teen AES candidates under nine categories of data:
Key Avalanche, Plaintext Avalanche (SAC with zero
key), Plaintext/Ciphertext Correlation (RPC), Cipher
Block Chaining Mode, Random Plaintext/Random
Keys (stream consisting of key, plaintext and cipher-
text tuple), Low Density Plaintext (LHW), Low Den-
sity Keys, High Density Plaintext (inversed LHW),
and High Density Keys. In the succeeding work (Soto
and Bassham, 2000), Soto and Bassham expanded re-
cent results with a study of round reduced candidates
with longer keys and the same data types (LHW, SAC,
etc). Kubicek et al. analysed the round reduced TEA
using evolutionary algorithms (Kub
´
ıcek et al., 2016).
Hernandez-Castro and Barrero in (Hernandez-
Castro and Barrero, 2017) evaluate tests in the Ent
battery using genetic algorithms. Authors of NIST
STS analysed the correlation of tests results in or-
der to eliminate redundant tests. NIST performed a
study to determine the dependence between the NIST
STS tests (Rukhin et al., 2010). They applied princi-
pal components analysis of m (no value specified) p-
values and extracted 161 factors, equal to the number
of tests (default settings of tests were not used). They
claimed that “there is no large redundancy among our
tests”. Yet some other works also analysed the cor-
relation of NIST STS tests (e.g., (S
´
ys et al., 2015))
and showed a correlation between NIST STS’s tests
leading to an estimate of the higher number of failing
test needed for rejection of randomness hypothesis.
Eskandari et al. in (Eskandari et al., 2018) automati-
cally construct distinguishers for 30 crypto primitives
using bit division property method and a new Salva-
tore framework.
6 CONCLUSIONS
Our paper provides the most extensive analysis of the
power of the commonly used randomness statistical
tests and their variants on the data produced by 109
cryptographic hash functions and block ciphers pub-
lished to date. To perform the analysis of 414 tests,
we modified the code of every function to make the
number of internal rounds configurable and executed
it on three types of highly redundant input blocks to
produce a stream of testing data.
All the tests were integrated under the same in-
terface allowing for an efficient evaluation using a
distributed computation cluster. We also designed a
unified framework for evaluating biases’ presence in
the output of a cryptographic function using differ-
ent randomness testing batteries. Our approach is re-
producible, and new functions can be later tested and
compared with existing results.
The security margin – as the ratio between the to-
tal number of function rounds and rounds with bias
still detectable (distinguisher) – was established for
all the tested functions and compared with the distin-
guishers published in the research literature. While
being around 77% on average (up to 23% of inter-
nal rounds still distinguishable), there is high vari-
ability among the functions analyzed. SHA-3 exhibits
a security margin of 83%, and ten functions, includ-
ing Blake, Gost, Skein, Mars, Serpent, Shacal2, and
XTEA have even more than 90%. Contrary to func-
tions with a large security margin, the functions de-
tected with a very small margin (Arirang, DCH, Dy-
namicSha2, Luffa, and Twister) were also shown to be
weak by existing research literature. The randomness
tests can be therefore seen as the simple automated
first step in cryptanalysis.
SECRYPT 2022 - 19th International Conference on Security and Cryptography
144

All our tools and results, including tests results
from both reference runs and cryptographic function
dataset, are publicly available
5
.
ACKNOWLEDGEMENT
Authors were supported by Czech Science Founda-
tion project (GA20-03426S). This work was partially
supported by the European cybersecurity pilot Cy-
berSec4Europe. Computational resources were sup-
plied by the project ”e-Infrastruktura CZ” (e-INFRA
CZ LM2018140) supported by the Ministry of Educa-
tion, Youth and Sports of the Czech Republic. Com-
putational resources were provided by the ELIXIR-
CZ project (LM2018131), part of the international
ELIXIR infrastructure.
REFERENCES
Aly, A., Ashur, T., Ben-Sasson, E., Dhooghe, S., and Szepi-
eniec, A. (2020). Design of symmetric-key primitives
for advanced cryptographic protocols. IACR Transac-
tions on Symmetric Cryptology, 2020(3):1–45.
Bernstein, D. J., Chang, Y.-A., Cheng, C.-M., Chou, L.-P.,
Heninger, N., Lange, T., and Van Someren, N. (2013).
Factoring RSA keys from certified smart cards: Cop-
persmith in the wild. In International Conference on
the Theory and Application of Cryptology and Infor-
mation Security, pages 341–360. Springer.
Biham, E. and Shamir, A. (2012). Differential cryptanalysis
of the data encryption standard. Springer Science &
Business Media.
Biryukov, A. and Velichkov, V. (2014). Automatic search
for differential trails in ARX ciphers. In Cryptogra-
phers’ Track at the RSA Conference, pages 227–250.
Springer.
Brown, R. G., Eddelbuettel, D., and Bauer, D. (2013).
Dieharder: A random number test suite. Open Source
software library, under development.
Caelli, W. et al. (1998). Crypt-X suite.
Doty-Humphrey, C. (2014). Practically Random: Specific
tests in PractRand.
Eskandari, Z., Kidmose, A. B., K
¨
olbl, S., and Tiessen, T.
(2018). Finding integral distinguishers with ease. In
IACR Cryptol. ePrint Arch.
Heninger, N., Durumeric, Z., Wustrow, E., and Halderman,
J. A. (2012). Mining your ps and qs: Detection of
widespread weak keys in network devices. In Pre-
sented as part of the 21st USENIX Security Sympo-
sium (USENIX Security 12), pages 205–220.
Hernandez-Castro, J. and Barrero, D. F. (2017). Evolution-
ary generation and degeneration of randomness to as-
sess the indepedence of the ent test battery. In 2017
5
https://crocs.fi.muni.cz/public/papers/secmargins
secrypt22
IEEE Congress on Evolutionary Computation (CEC),
pages 1420–1427. IEEE.
Hommel, G. (1988). A stagewise rejective multiple
test procedure based on a modified bonferroni test.
Biometrika, 75:383–386.
Jones, G. (2007). gjrand random numbers.
Kaminsky, A. (2019). Testing the randomness of crypto-
graphic function mappings. IACR Cryptology ePrint
Archive, page 78.
Kaminsky, A. and Sorrell, J. (2013). CryptoStat: a Bayesian
Statistical Testing Framework for Block Ciphers and
MACs. Rochester Institute of Technology, Rochester,
NY.
Ketamine (2018). Multiple vulnerabilities in Se-
cureRandom(), numerous cryptocurrency products
affected. https://lists.linuxfoundation.org/pipermail/
bitcoin-dev/2018-April/015873.html.
Knuth, D. E. (1969). The Art of Computer Programming,
volume 2. Addison-Wesley Longman Publishing Co.,
Inc., Boston, MA, USA, first edition.
Kub
´
ıcek, K., Novotn
`
y, J.,
ˇ
Svenda, P., and Ukrop, M. (2016).
New results on reduced-round tiny encryption algo-
rithm using genetic programming. INFOCOMMUNI-
CATIONS JOURNAL, 8(1):2–9.
L’Ecuyer, P. and Simard, R. (2007). TestU01: A C Li-
brary for Empirical Testing of Random Number Gen-
erators. ACM Transactions on Mathematical Software
(TOMS), 33(4).
Marsaglia, G. (1995). Diehard: a battery of tests of random-
ness.
Mascagni, M. and Srinivasan, A. (2000). Algorithm 806:
SPRNG: A scalable library for pseudorandom num-
ber generation. ACM Transactions on Mathematical
Software (TOMS), 26(3):436–461.
Matsui, M. (1993). Linear cryptanalysis method for des ci-
pher. In Workshop on the Theory and Application of of
Cryptographic Techniques, pages 386–397. Springer.
Menezes, A. J., Van Oorschot, P. C., and Vanstone, S. A.
(1996). Handbook of applied cryptography. CRC
Press.
Murphy, S. (2000). The power of NIST’s statistical testing
of AES candidates. Preprint. January, 17.
O’Neill, M. E. (2014). Pcg: A family of simple fast
space-efficient statistically good algorithms for ran-
dom number generation. Technical Report HMC-CS-
2014-0905, Harvey Mudd College, Claremont, CA.
Piras, C. (2004). RaBiGeTe Documentation.
Rukhin, A., Soto, J., Nechvatal, J., Smid, M., Barker,
E., Leigh, S., Levenson, M., Vangel, M., Banks, D.,
Heckert, A., Dray, J., and Vo, S. (2010). A Statisti-
cal Test Suite for Random and Pseudorandom Number
Generators for Cryptographic Applications.
Schindler, W. and Killmann, W. (2002). Evaluation crite-
ria for true (physical) random number generators used
in cryptographic applications. In International Work-
shop on Cryptographic Hardware and Embedded Sys-
tems, pages 431–449. Springer.
Soto, J. (1999). Randomness testing of the AES candi-
date algorithms. NIST. Available via csrc. nist. gov,
page 14.
Large-scale Randomness Study of Security Margins for 100+ Cryptographic Functions
145

Soto, J. and Bassham, L. (2000). Randomness testing of
the advanced encryption standard finalist candidates.
Technical report.
Sys, M., Klinec, D., and Svenda, P. (2017). The Efficient
Randomness Testing using Boolean Functions. In
14th International Conference on Security and Cryp-
tography (Secrypt), pages 92–103. SCITEPRESS.
S
´
ys, M., Klinec, D., and
ˇ
Svenda, P. (2017). The efficient
randomness testing using boolean functions. In 14th
International Conference on Security and Cryptogra-
phy (Secrypt), pages 92–103. SCITEPRESS.
S
´
ys, M.,
ˇ
R
´
ıha, Z., Maty
´
a
ˇ
s, V., Marton, K., and Suciu, A.
(2015). On the interpretation of results from the NIST
statistical test suite. Romanian Journal of Information
Science and Technology, 18(1):18–32.
Walker, J. (2008). Ent: A Pseudorandom Number Sequence
Test Program.
Webster, A. and Tavares, S. E. (1985). On the design of s-
boxes. In Conference on the theory and application of
cryptographic techniques, pages 523–534. Springer.
SECRYPT 2022 - 19th International Conference on Security and Cryptography
146
