
Behavior Modeling of a Distributed Application for Anomaly Detection
Amanda Viescinski
1 a
, Tiago Heinrich
1 b
, Newton C. Will
2 c
and Carlos Maziero
1 d
1
Federal University of Paran
´
a, Curitiba, Brazil
2
Federal University of Technology - Paran
´
a, Dois Vizinhos, Brazil
Keywords:
Intrusion Detection, Distributed Computing, Security.
Abstract:
Computational clouds offer services in different formats, aiming to adapt to the needs of each client. This
scenario of distributed systems is responsible for the communication, management of services and tools
through the exchange of messages. Thus, security in such environments is an important factor. However,
the implementation of secure systems to protect information has been a difficult goal to achieve. In addition
to the prevention mechanisms, a common approach to achieve security is intrusion detection, which can be
carried out by anomaly detection. This technique does not require prior knowledge of attack patterns, since
the normal behavior of the monitored environment is used as a basis for detection. This work proposes a
behavioral modeling technique for distributed applications using the traces of operations of its nodes, allowing
the development of a strategy to identify anomalies. The chosen strategy consists of modeling the normal
behavior of the system, which is arranged in sets of
n
-grams of events. Our goal is to build functional and
effective models, which make it possible to detect anomalies in the system, with reduced rates of false positives.
The results obtained through the evaluation of the models highlight the feasibility of using
n
-grams to represent
correct activities of a system, with favorable results in the false positive rate and also in terms of accuracy.
1 INTRODUCTION
Distributed architectures are responsible for perform-
ing communications among services, processes, and
applications, in order to carry out different operations
that can be shared with different users and services.
This type of communication requires data sharing be-
tween operations in distinct networks, environments,
or even infrastructures. Considering that, data will
travel through several networks, some of which may be
unknown, raising concerns about security, and impor-
tant factors to guarantee the confidentiality, integrity,
and availability of the these data.
One of the strategies used to achieve these guaran-
tees is intrusion detection, which aims to monitor the
system components, such as the network (Mishra et al.,
2017; Borkar et al., 2017; Jose et al., 2018; Khraisat
et al., 2019) and local storage and processes (Lano
¨
e
et al., 2019), allowing to identify abnormal operations
and incidents. Often, this monitoring is carried out by
an Intrusion Detection System (IDS), which can con-
a
https://orcid.org/0000-0002-9125-1598
b
https://orcid.org/0000-0002-8017-1293
c
https://orcid.org/0000-0003-2976-4533
d
https://orcid.org/0000-0003-2592-3664
sist of software and/or hardware deployed at different
points of the system (Benmoussa et al., 2015).
The main goal of an IDS is to distinguish between
benign and malicious behavior. Thus, these systems
are based on pattern recognition. The recognition ap-
proaches most adopted by IDS are: signature detection,
which is based on the identification of standard threat
strategies; and anomaly-based detection, in which the
normal behavior of the monitored system are used as
a basis for detection.
In the anomaly-based detection approach, models
are constructed from the observation of legitimate or
expected behaviors of the system components (for ex-
ample, users, network connections, or applications).
In this way, a behavioral model is used as a reference
during the monitoring of the system, in order to enable
the identification of unknown patterns (Callegari et al.,
2016).
This identification procedure will rely on the use
of a global clock, to verify the sequence of events in a
system. In a distributed system, the ordering of events
ends up being a complex task, as a result, approaches
end up applying solutions that do not require the syn-
chronization of events since the identification process
performed by an IDS is aimed at only one host. Which
Viescinski, A., Heinrich, T., Will, N. and Maziero, C.
Behavior Modeling of a Distributed Application for Anomaly Detection.
DOI: 10.5220/0011267200003283
In Proceedings of the 19th International Conference on Security and Cryptography (SECRYPT 2022), pages 333-340
ISBN: 978-989-758-590-6; ISSN: 2184-7711
Copyright
c
2022 by SCITEPRESS – Science and Technology Publications, Lda. All rights reserved
333

will only notify a higher entity if any anomaly is found
(Totel et al., 2016).
A frequent issue in the behavioral modeling of
systems is related to the volume of data to be manipu-
lated. When monitoring even small software systems,
an enormous amount of data is produced (Lorenzoli
et al., 2006). Therefore, dealing with the collected
data in such a way as to generate enough information
to identify the normal behaviors of a system may be
challenging. In this sense, one of the main goal is to
properly extract, store, and interpret meaningful data.
The contributions usually found in the literature
focus on the construction of representative models of a
distributed system using automata. This technique con-
sists of modeling known behaviors by states and tran-
sitions representing possible events and state changes
in the system. Aiming at the identification of anoma-
lies and intrusion detection, this paper proposes a new
technique for the construction of behavioral models of
distributed applications through the operation traces of
their nodes. The partial models obtained are arranged
in sets of
n
-grams of events and combined to obtain
more generic, yet representative models.
Thus, the contributions of the present work are:
•
The representation of normal behaviors of a dis-
tributed system through n-grams of events;
•
The construction of models that effectively repre-
sent normal behaviors;
•
A strategy to assess the ability to detect anomalous
behavior using the models generated;
•
A validation of the model using real-world data
(extracted from a distributed application); and
•
A detailed assessment of the feasibility of the pro-
posed model.
The reminder of this paper is structured as follows:
Section 2 presents works that have been carried out in
the context of this research; Section 3 describes our
proposal; Section 4 presents the experimental evalua-
tion of the proposed solution; and Section 5 concludes
the paper and discusses future work.
2 RELATED WORK
Intrusion detection in distributed applications through
the identification of abnormal behaviors is widely stud-
ied in the literature, using mainly automata. In this
context, the identification of anomalous subsequences
in sequences of application events based on the Com-
mon Object Request Broker Architecture (CORBA) ar-
chitecture is explored by Stillerman et al. (1999). Text
messages in log files are used by Fu et al. (2009) in
the construction of automata that represent the normal
flow of each component of the system and a Gaus-
sian model that checks the execution time between
state transitions, allowing to detect anomalies related
to reduced bandwidth and also delay between state
transitions.
Automata and temporal properties are combined by
Totel et al. (2016) to model the possible states that the
system can assume and the sequence in which these
states occur, creating a lattice that identifies new se-
quences that were not perceived with the ordering of
events. These sequences are then joined and general-
ized and as the number of traces to create the automata
increases, more states are learned, but fewer temporal
properties are met. The work is extended by Lano
¨
e
et al. (2019), seeking to increase efficiency in the con-
struction of the automaton, through the use of the most
significant sequences in the lattice, to the detriment
of the whole, and the generation of several interme-
diate models that are generalized several times until
obtaining a final and stable model.
Automata are also combined with n-grams for the
detection of anomalies in Web systems. An
n
-gram is
a contiguous sequence of
n
items from a given sample,
typically text, and are used in various areas in com-
puter science, mainly in natural language processing,
sequence analysis, and data compression (Broder et al.,
1997). In the approach presented by Jiang et al. (2006),
n
-grams represent the contiguous subsequences of re-
quests between the components of a trace and the au-
tomata are used to connect the
n
-grams to characterize
those traces. A technique based on the payload of
network packets capable of detecting content-based
attacks, carried out in application protocols such as
Hypertext Transfer Protocol (HTTP) and File Transfer
Protocol (FTP), is presented in Angiulli et al. (2015),
with the
n
-grams generated from sliding windows and
applied to learn frequent byte sequences from each
block. The authors conclude that a low value of
n
makes it difficult to recognize attacks while a high
value of
n
makes it easier to identify an anomaly but
also produces more false positives. Other proposals
that present the use of
n
-grams to detect anomalies in
Web systems are described by Zolotukhin et al. (2012)
and Vartouni et al. (2018).
In addition, Wressnegger et al. (2013) seek to iden-
tify environments where anomaly detection is more
favorable than classifying
n
-grams as benign and mali-
cious, or vice versa. The study discusses types of data
that can be represented in
n
-grams, such as text and
binary network protocols, as well as traces of system
calls, evaluating the criteria cited for each type of data.
Anomaly detection techniques in distributed appli-
cations are strongly focused on automata and temporal
SECRYPT 2022 - 19th International Conference on Security and Cryptography
334

properties, with the use of
n
-grams for this purpose be-
ing explored only in Web applications and application
protocols. These works present satisfactory results and
demonstrate the feasibility of using
n
-grams in mod-
eling systems for anomaly-based intrusion detection.
However, they do not show whether their solutions are
applicable in distributed systems and do not consider
the ordering between the information that is present in
the dataset. Consequently, the relationship between the
sequences of states of the system is also ignored and
the distributive characteristics of the system are not
considered by these works. Thus, the purpose of the
present work is to explore this gap in the current litera-
ture, applying
n
-grams in the construction of models
for distributed applications, using system event logs
as a basis for modeling, which is not covered by the
presented related work.
3 ANOMALY DETECTION
BASED ON n-GRAMS
Intrusion Detection Systems (IDS) have been widely
used to automatize the intrusion detection procedure.
Among the detection techniques used, the anomaly-
based approach is more effective when identifying new
attacks, compared to the signature-based one (Liao
et al., 2013). Anomaly-based methodology can be
split into two phases: (1) the learning phase, in which
the model that defines the normal behavior for the ap-
plication is built, using data from the real environment
or synthetically generated data; and (2) the detection
phase, where the current behavior of the system is
compared to the previously built model, searching for
anomalous behavior. Thus, any deviation from the
normal behavior model is considered an attack.
The modeling technique proposed in this work con-
sists in representing the system behaviors by n-grams
of events. These are extracted from a dataset of correct
event sequences collected from the system under study.
The general objective of this work is to achieve the
construction of models of normal behaviors of real dis-
tributed applications that allow the creation of effective
anomaly-based intrusion detection systems.
We consider a distributed application as a set of
processes that are coordinated through the message
exchange over a network. In each process, sending
or receiving a message is considered an event. In
addition, each process records its events at the node
that executes it, respecting the local ordering.
Another relevant premise is that the message
exchange between system processes is carried out
through reliable communication channels. This can
be made possible, for example, through the use of the
Transmission Control Protocol (TCP) (Beschastnikh
et al., 2014), and spurious messages are expected to
occur.
We do not assume the presence of a global physical
clock. Our time assumption is based on a logical clock,
which, through the happen-before relation (Lamport,
1978), allows us to order events in a global order of
causality of events. Thus, the
n
-grams used in our
model are built using the causal information extracted
from the nodes’ logs. Such
n
-grams capture the causal
relations among the events, which are more suited to
represent the behavior of a distributed system than
simpler event sequences observed in each node. The
use of a global logical clock allows the evaluation of a
distributed structure effortlessly, since there is no need
to synchronize the entire architecture by a physical
global clock. Finally, our strategy differs from related
work in the field that focus only on individual logs and
not global ones.
3.1 Modeling
The modeling technique proposed in this work as-
sumes that there is a dataset with the records of events
that occurred in a given distributed application. This
dataset will be composed of a set of executions which
different duration times. The main motivation is to cap-
ture the greatest possible diversity of heterogeneous
behaviors. The more representative the dataset is, the
better to understand how a model is adapting and how
well it behaved in the environment. The set of all
registered executions in the dataset is defined as E.
An execution
E
i
represents possible behaviors that
may occur in the system. Thus, an execution
E
i
∈ E
is defined as the set of traces
T
of the processes that
are part of it:
E
i
= {T
i1
, T
i2
, . . .}
. In each execution
of a distributed application, multiple processes are in-
volved (
p
1
, . . . , p
j
). The number of processes involved
may vary depending on the execution. Each trace
corresponds to a process, regardless of whether they
are on the same host or not. Therefore,
j
defines the
maximum number of processes involved in executing
E
i
.
In this paper, a trace is the event log file of each
process. As such, a trace
T
i j
is defined by the sequence
of events that occurred in the process
p
j
during execu-
tion
E
i
in chronological order:
T
i j
= [e
i j1
, e
i j2
, . . . ]
,
where
e
i jk
is the
k
-th event that occurred in the pro-
cess
p
j
during execution
E
i
. In simplified form, we
can write
T = [e
1
, e
2
, . . .]
, subtending process
p
j
and
execution
E
i
when they are not needed. Consequently,
E
i
corresponds to a single distributed execution of the
system, which contains j traces.
The construction of a model depends on ensuring
Behavior Modeling of a Distributed Application for Anomaly Detection
335

that only correct behaviors of the system are used,
that is, traces without attacks or any type of anomaly.
Therefore, the set of correct traces is defined by
C
,
being a subset of
E
(
C ⊆ E
). The correct trace col-
lected individually by the process must be composed
of events that characterize finite executions of the ap-
plication to be modeled. This implies that each ex-
ecution
E
i
must have a proper termination (without
deadlocks). Stored events must not be encrypted and
must contain relevant information, for example, source
and destination nodes.
3.2 n-Grams Definition
An
n
-gram is defined as a sequence of consecutive
causally-related events of length
n
, which can be de-
scribed as
seq = [e
1
e
2
. . . e
n
]
. The set of all the dis-
tinct
n
-grams of size
n
observed in a given execution
E
is defined by
G(E, n)
. It is obtained using a three-step
algorithm applied to the traces present in E:
1.
The traces
T
are analyzed to find the send-receive
event pairs, i.e. the events corresponding to send-
ing a message
m
by a node and receiving
m
by an-
other node; messages that does not have a sending
event or a receiving event are considered spurious
and ignored;
2.
The logical timestamps of all events
e
in all traces
T ∈ E
are calculated, using the Lamport’s algo-
rithm (Lamport, 1978), and events on the same
process are considered causally linked; this is cru-
cial to define inter-node causal relations;
3.
For each event
e
in each trace
T
, all the possible
sequences of
n
consecutive causally-related events
starting at
e
are found, possibly involving more
than one node. Each of such sequences constitutes
an n-gram.
Fig. 1 shows an example of an execution with
two clients and one server, containing all the events
(identified by letters) and two sequences with
4
-grams
that can be captured in this execution. From event a, it
is possible to construct four sets with
4
-grams: abcd,
aefb, abci and aefg. Similarly, taking event m as the
beginning, it is possible to build the
4
-gram sets mghn,
mnok e mnop, besides the set mghi already highlighted
in the figure. In the execution of Fig. 1, there are in
all 27 distinct
n
-grams of with
n = 4
. In addition, we
can form several other event sequences using different
values for n.
3.3 Model Definition
The
n
-gram calculation technique presented in the Sec-
tion 3.2 allows to extract the behaviors of a single
C1
S
C2
Physical
Time
a
e
f
g
m n o
p
h
i
j
k
l
b c d
Figure 1: Example of n-grams from an execution.
execution
E
. Considering the characteristics of the
dataset, this procedure must be repeated for each ex-
ecution
E
. Only after obtaining the
n
-grams of all
executions can global models of the system be built.
The proposed modeling technique includes two
strategies, based on elementary operations of set the-
ory, for building global models. Each strategy aims
to build a
M
model to represent the normal behavior
of the system. Therefore, a
M
model is simply a set
of
n
-grams of same length that attempts to represent
the correct behavior of the system under study. Only
the correct (
E ∈ C
) executions of the system should
be used to build such a model.
The first proposed strategy comprises grouping
all the
n
-grams of the
E
executions that compose the
dataset, removing the
n
-gram replicas to keep only
one instance of each
n
-gram. In summary, a union
model
M ∪ (n)
defined by the set of the
n
-grams of
size
n
present in at least one correct execution will be
constructed: M ∪ (n) = ∪G(E, n) ∀E ∈ C.
In the second strategy, we group them into a sin-
gle model, each unique
n
-gram that appears in all
correct executions. Thus, is defined a simple inter-
section model
M ∩ (n)
by the set of the
n
-grams of
size
n
present in all correct executions:
M ∩ (n) =
∩G(E, n) ∀E ∈ C.
A desired feature of the dataset is that each cor-
rect execution describes a specific behavior. These
executions are expected to be distinct from each other.
Therefore, the requirement that an
n
-gram be present
in all of them can be very restrictive, making the model
small (with few
n
-grams) and consequently very selec-
tive. Theoretically, this can lead to a high false-positive
rate in detection using it as a baseline.
Seeking to reduce the excessive selectivity of the
simple intersection model, we divided the set of correct
executions into subsets. After that, partial models of
them were built using the union logic. Finally, the
intersection logic was applied on top of the built partial
models to get a more comprehensive final intersection
model, what we call the wide intersection model.
Formally explaining the construction of the wide
intersection model: first, the set of correct executions
C
is divided into
p
partitions
P
1... p
, balanced with each
other (about the number and size of runs of each). For
each partition P
i
, we calculated a partial model union
SECRYPT 2022 - 19th International Conference on Security and Cryptography
336

M
0
i
from their executions
E
:
M
0
i
(n) = ∪G(E, n) ∀E ∈
P
i
. The partial models
M
0
i
are combined into a wide
intersection model
Mu
, using intersection logic; in
this way, this model will contain the
n
-grams present
in all partial models: M u (n) = ∩M
0
i
(n) ∀i ∈ {1... p}.
A wide intersection model
Mu
encompasses the
others, being a hybrid between the union model
M∪
and the simple intersection model
M∩
and can repre-
sent both: if we made a single partition (
p = 1
), we
have
Mu = M∪
; if we made a partition for each cor-
rect execution (
p = |C|
), we have
Mu = M∩
. The
choice of the value of
p
(
1 ≤ p ≤ |E|
) is a parameter
to be evaluated in future work.
In this paper, each
n
-gram of the model represents
a small part of the correct behavior of the system. In
this way, the model construction phase is performed
offline, as well as the detection phase. Hence, offline
anomaly detection using a
M
model is performed as
follows: i) Given an execution
E
to be analyzed, of
it extracts the set of
n
-grams
G(E, n)
; if all
n
-grams
of
G(E, n)
are present in the model
M
(i.e., if
G
is
contained in
M
), the execution is normal; otherwise, it
is anomalous:
G(E, n) ⊆ M?
yes → correct execution
no → anomalous execution
4 VALIDATION
Considering the validation of the proposed models,
it proposed a validation scenario using data collected
from a real distributed application and, for this purpose,
we choose the dataset built by Lano
¨
e et al. (2019) that
represents a real distributed application with several
components. The dataset represents the normal and
anomalous behavior, which interests us in this work.
Finally, it is important to note that is well-adjusted,
the data representation used to extract the information
needed to build the n-grams.
4.1 Scenario
The scenario presented in the dataset consists of ex-
ecutions of
XtreemFS
(Quobyte Inc, 2020), a fault-
tolerant distributed file system. Four main components
are needed to provide its services:
•
Object Storage Device (OSD), responsible for stor-
age;
•
Metadata and Replica Catalog (MRC), performs
metadata storage, directory tree management, and
access control;
•
Directory Service (DIR), connects all other com-
ponents and register system services; and
•
Clients that perform system requests and manage
file states (such as volume creation/mounting and
file creation).
The dataset produced by Lano
¨
e et al. (2019) con-
sists of 126 executions; each execution contains traces
for all nodes in the system. The data gathering lasts
between one minute and five hours, resulting in traces
of an average size of 39 KB. The number of nodes in
the system also varies. In some of them, there may
be up to two active clients (making requests for the
application) and in others, none.
All nodes in the system were configured to record
their individual traces, containing information about
events of sending or receiving messages. No infor-
mation regarding the local physical time was stored
with the events, only their sequence, thus causality
information should be later rebuilt. For this, the local
events at each node are stored sequentially, following
their occurrence. During the traces analysis, the order
of local events and the relationship between matching
sending and receiving events is used to rebuild causal-
ity dependencies among them and to define a partial
order on the events (Totel et al., 2016).
Two types of behavior are represented, (i) situa-
tions of normal behavior of the system, in which in-
formation was collected during a period of execution
with expected behaviors, and (ii) situations of abnor-
mal behavior of the system, in which information was
collected during a period when the system was under
attack, with 16.3% of the collected data represents
abnormal behavior. In order to collect traces of exe-
cutions with anomalous behaviors of the system, an
insecure version of
XtreemFS
was implemented by
Lano
¨
e et al. (2019), so that four known attacks against
its integrity could be carried out:
•
NewFile attack, which adds metadata of a file on
the MRC server but does not insert its contents on
the OSD server;
•
DeleteFile, which deletes the file’s metadata on
the MRC server but keeps its content on the OSD
server;
•
Chmod, which changes the file access policy on
the MRC server, even without authorization; and
•
Chown attack, which modifies the owner of the file
in the MRC metadata.
Each attack was carried out in four different con-
texts: (c1) no active clients; (c2) with customers active
in the environment, but before carrying out operations;
(c3) after the operations are carried out and; (c4) orig-
inated from an address that does not belong to the
customer. The traces of these executions allow the
evaluation of the detection efficiency of each model
Behavior Modeling of a Distributed Application for Anomaly Detection
337

previously built based on the normal behavior of the
system.
4.2 Results
For each correct execution,
E
present in the dataset
was calculated grams with different values of
n
, from
3
to
15
. Grams smaller than
3
cannot describe a correct
behavior adequately, and those larger than
15
present
a high computational cost during the model building
and anomaly detection phase.
To evaluate the effectiveness of the built models,
it is necessary to analyze their classification capacity
in the face of correct executions that were not used
during their construction. For this, after obtaining the
grams of all executions,
C
was separated into training
and validation data. So we have
C
segmented into
p
validation partitions
PV
p
, p = 1 . . . p
individual. We
distributed the executions in each
PV
p
to balance the
size and number of traces. In summary,
PV
p
,
C
and
A
are partitions
1
of
E
, i.e.,
|PV
p
| = C
,
C ∪ A = E
e
C ∩ A =
/
0.
Seeking to increase the efficiency of the model cre-
ation algorithm, was created a single file containing all
the grams found in the traces that make up each parti-
tion, i.e., we built partial union models for validation
MV
0
i
from the E executions of each partition.
Next, was generated the validation models
MV
in
a
k
-fold cross-validation scheme (Arlot and Celisse,
2010). For the evaluations presented in this paper,
we consider
k = 5
. In this scheme, we separated a
partition of executions for validation and combined
k − 1
partitions to produce the models, resulting in
k
validation models (
MV
1...k
). We combined the parti-
tions following the logic of union and intersection, as
described in Section 3.3.
To evaluate
MV ∪
and
MV u
, each
MV
was tested
using all correct traces
C
that were not adopted to
compose the model, separated during the model con-
struction. The result returned by the test of each
MV
is the percentage of
n
-grams found in the models in
relation to the total of
n
-grams present in the analyzed
trace.
As the relationship
⊆
only defines whether a trace
t
belongs to the model or not, that is, a binary decision
(correct or suspicious), it becomes necessary to adopt
a less rigid criterion. For this reason, an acceptance
rate was adopted, seeking to make the classification of
normal and anomalous behaviors more flexible. Thus,
it was considered as a result returned by the test of
each model
M
, the percentage of
n
-grams present in
the analyzed trace that are also found in the models.
1
A set X can be divided into disjoint subsets called par-
titions P
i
such that ∀i ∪ P
i
= X and ∀(i, j) P
i
∩ P
j
=
/
0.
This parameter will reflect the limit to what the system
will define as an anomaly, mirroring an identification
behavior that would occur in an IDS.
In order to understand which acceptance rate is
most appropriate for each type of model, the accuracy
was evaluated for each model according to the varia-
tion in its acceptance rate. For the union validation
models
MV ∪
, an adequate acceptance rate of 99.4%
was obtained, with
n = 3
and
n = 6
. Thus, if a trace
t
has 99.4% of its known grams, it is considered normal
according to MV ∪.
The same evaluation was performed for the wide
intersection validation models
MV u
. In this scenario,
the accuracy was lower when compared to
MV ∪
,
with 60% being the maximum amount reached, for
n = 9
and
n = 12
. For an acceptance rate of 100%
(
t ⊆ MV u
), in almost all cases the accuracy achieved
was 46%. This was due to the models classifying any
t
as suspect, that is, anomalous traces were classified
correctly, however, all the correct traces were erro-
neously classified also as suspicious. Otherwise, for
a
≤ 55%
acceptance rate, the models classify any
t
as
normal. Thus, the acceptance rate adopted for these
models was 75%.
With the appropriate acceptance rate for both mod-
els built, the next assessment refers to the false positive
rates (
T
FP
). The results presented are an arithmetic
average of the
k
validation models built, a practice
commonly adopted for the
k
-fold cross-validation. Fig.
2 shows the
T
FP
achieved by the models
M
accord-
ing to the values of
n
. As expected,
MV u
had the
highest rate compared to
MV ∪
, reaching a 54% dif-
ference at
n = 15
. This shows that collecting only the
most popular
n
-grams generates very restricted models
that are unable to distinguish correct behavior from an
anomaly. Another point that can be observed in Figure
2 is that the higher the value of
n
, the more specific
the
n
-grams become. Consequently, the amount of
behavior represented is reduced, making the models
more prone to errors.
Seeking to analyze how satisfactory the results re-
turned by the built models are, the true positive rate
T
T P
was verified, shown in Fig. 3. A first point to note
is that small
n
(
≤ 4
) values are not able to adequately
represent a behavior, classifying any
t
as a normal ac-
tivity. Still analyzing the size variation of the
n
-grams,
MV u
evolves its detection capacity significantly as
the values attributed to
n
increase. This behavior in-
dicates that
MV u
allows the identification of attacks
more easily, but, on the other hand, the difficulty of
correctly identifying normal traces increases.
In this scenario,
MV ∪
proved to be stable regard-
less of the variation in
n
, remaining at
T
T P
≈ 58%
.
However, there is a difficulty in detecting
c1
(no active
SECRYPT 2022 - 19th International Conference on Security and Cryptography
338
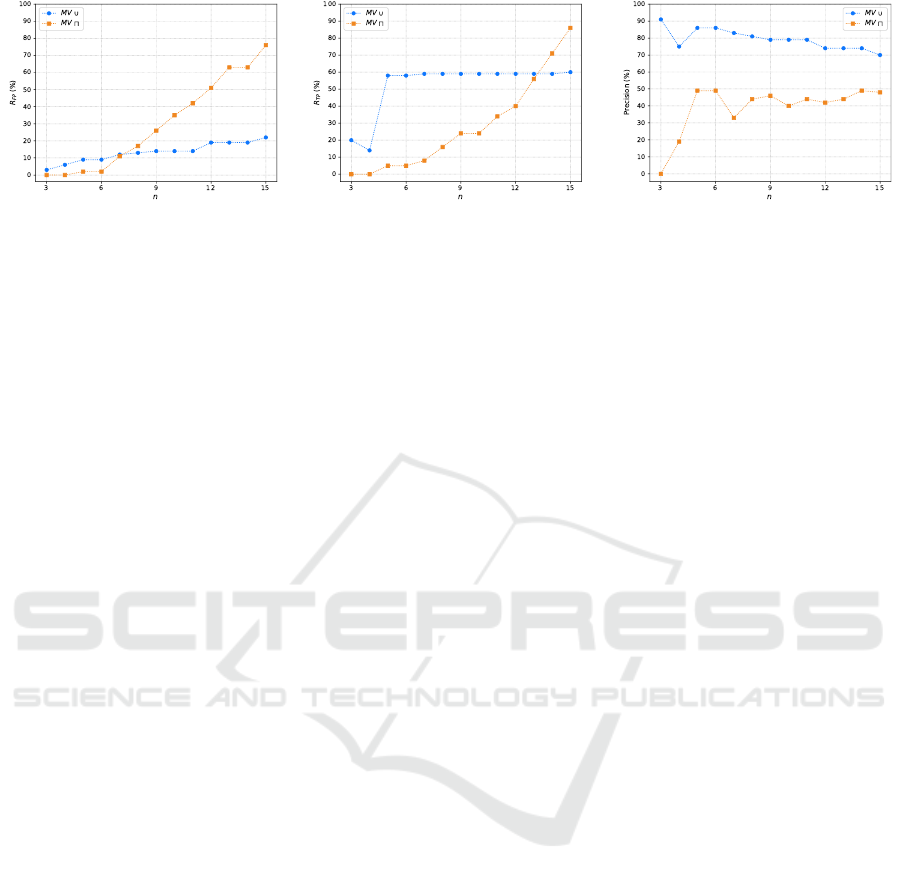
Figure 2: Rate of false positives for
different amounts of
n
in
MV ∪
and
MV u.
Figure 3: True positive rate for differ-
ent amounts of
n
in
MV ∪
and
MV u
.
Figure 4: Accuracy for different
amounts of
n
in
MV ∪
and
MV u
.
clients), where in none of the attacks the correspond-
ing traces were classified as suspect. This highlights
two points: (i) it is presumable that the traces used for
the construction of the models do not contain a suf-
ficient number of normal behaviors within that same
context (however, without the attack) to adequately
represent the system; (ii) the models are able to de-
tect only anomalies in scenarios where there are active
customers, abnormal traces that precede correct cus-
tomer activities are classified as normal behaviors. On
the other hand, the detection capacity was satisfactory,
since with a relatively small size of
n
the results are
similar to larger grams and higher processing costs can
be avoided.
Finally, it is necessary to find out how accurate the
models are, i.e., what is the relevance of the classi-
fications that use them as a basis. Fig. 4 shows the
precision (
P
) obtained by each model as a function of
n
. Analyzing
MV ∪
, it is possible to state that the in-
crease in the size of the
n
-grams is not a good strategy,
as the amount of incorrect results tends to increase. As
for
MV u
, it is not possible to make the same state-
ment, since its behavior remained stable in most of the
tested cases.
Considering all the analysis performed, the most
suitable size for the
n
-grams in union-based models
is
n = 6
, since: it presented the best accuracy (
75%
)
compared to the other sizes; the
T
FP
is reasonable
(
9%
), in addition to being among the lowest presented
by the model; its detection capacity (
T
T P
) is similar to
that of n-grams larger; and the dispersion of results is
minimal (
86%
), that is, it returns more relevant than
irrelevant results.
Thus, it can be verified that the union strategy gen-
erates models with good capacity to differentiate a
correct behavior from an anomaly. On the other hand,
the intersection strategy generates more restricted mod-
els, tending to classify most behaviors as anomalous.
Regarding the sizes of the
n
-grams, it is noted that
larger sizes of
n
are more effective in detecting attacks,
due to representing more specific behaviors.
5 CONCLUSION AND FUTURE
WORK
This paper proposed a technique to model the normal
behavior of a distributed application using
n
-grams
of events. The procedures for obtaining the
n
-grams
through the execution traces of a real distributed appli-
cation and the construction of normality models of the
system, through set operations, were described. The
proposed technique does not depend on a global clock
to understand the relationship between the events that
occurred in the system, being one of the contributions
of this work.
Two strategies for constructing normality models
(union and wide intersection) were evaluated. The
models were evaluated in relation to their ability to
represent the normal behavior of the system and de-
tect anomalies. For this evaluation, we used a dataset
containing real executions of a distributed application
and a set of real attacks executed in different contexts.
The results obtained show that the union-based models
offer a good capacity to model normal behavior, show-
ing promising results in terms of accuracy and true
positive rates. The intersection-based models proved
to be more sensitive to detect anomalies, but they do
not model the normal behavior as well as the union-
based. In addition, we observed that
n
-grams with
greater value to
n
detect attacks more easily, but are
more prone to false positives. Within the context of
the research, the analysis around the relationship of
total pertinence between the sets proved to be an im-
practicable approach, since the models are unable to
represent all possible behaviors that can occur within
a system.
The initial results are promising, but some ques-
tions remain open and will be explored in future re-
search. There is a visible need to increase the number
of normal executions and attacks based on traces, in or-
der to have a broader and more balanced representation
of possible behaviors. Thus, we planned to increase
dataset size for both normal executions and attacks,
Behavior Modeling of a Distributed Application for Anomaly Detection
339

seeking to obtain a broader and more balanced repre-
sentation of the possible behaviors of the distributed
application.
Finally, the construction of intersection-based mod-
els presented a significant constraint, the flexibility
during the combination of these subsets is an oppor-
tunity to circumvent this limitation and to build less
restricted models. Another approach is to introduce
the notion of generalization in the representation of
the
n
-grams, in order to obtain a more comprehensive
(and at the same time more compact) representation of
the normal behavior of the system.
ACKNOWLEDGEMENTS
This study was financed in part by the Coordena
c¸
˜
ao de
Aperfei
c¸
oamento de Pessoal de N
´
ıvel Superior - Brazil
(CAPES) - Finance Code 001. The authors also thank
the UFPR and UTFPR Computer Science departments.
REFERENCES
Angiulli, F., Argento, L., and Furfaro, A. (2015). Exploiting
n
-gram location for intrusion detection. In Intl Conf on
Tools with Artificial Intelligence, Vietri sul Mare, Italy.
IEEE.
Arlot, S. and Celisse, A. (2010). A survey of cross-validation
procedures for model selection. Statistics Surveys, 4.
Benmoussa, H., Abou El Kalam, A., and Ait Ouahman,
A. (2015). Distributed intrusion detection system
based on anticipation and prediction approach. In Intl
Conf on Security and Cryptography, Colmar, France.
SciTePress.
Beschastnikh, I., Brun, Y., Ernst, M. D., and Krishnamurthy,
A. (2014). Inferring models of concurrent systems
from logs of their behavior with CSight. In Intl Conf
on Software Engineering, Hyderabad, India. ACM.
Borkar, A., Donode, A., and Kumari, A. (2017). A survey on
intrusion detection system (IDS) and internal intrusion
detection and protection system (IIDPS). In Intl Conf
on Inventive Computing and Informatics, Coimbatore,
India. IEEE.
Broder, A. Z., Glassman, S. C., Manasse, M. S., and Zweig,
G. (1997). Syntactic clustering of the web. Computer
Networks and ISDN Systems, 29(8).
Callegari, C., Pagano, M., Giordano, S., and Berizzi, F.
(2016). A novel histogram-based network anomaly
detection. In Intl Conf on Security and Cryptography,
Lisbon, Portugal. SciTePress.
Fu, Q., Lou, J.-G., Wang, Y., and Li, J. (2009). Execution
anomaly detection in distributed systems through un-
structured log analysis. In Intl Conf on Data Mining,
Miami, FL, USA. IEEE.
Jiang, G., Chen, H., Ungureanu, C., and Yoshihira, K. (2006).
Multiresolution abnormal trace detection using varied-
length
n
-grams and automata. IEEE Transactions on
Systems, Man, and Cybernetics, 37(1).
Jose, S., Malathi, D., Reddy, B., and Jayaseeli, D. (2018).
A survey on anomaly based host intrusion detection
system. Journal of Physics: Conference Series, 1000.
Khraisat, A., Gondal, I., Vamplew, P., and Kamruzzaman,
J. (2019). Survey of intrusion detection systems: tech-
niques, datasets and challenges. Cybersecurity, 2(1).
Lamport, L. (1978). Time, clocks, and the ordering of events
in a distributed system. Communications of the ACM,
21(7).
Lano
¨
e, D., Hurfin, M., Totel, E., and Maziero, C. (2019).
An efficient and scalable intrusion detection system
on logs of distributed applications. In Intl Conf on
ICT Systems Security and Privacy Protection, Lisbon,
Portugal. Springer.
Liao, H.-J., Lin, C.-H. R., Lin, Y.-C., and Tung, K.-Y. (2013).
Intrusion detection system: A comprehensive review.
Journal of Network and Computer Applications, 36(1).
Lorenzoli, D., Mariani, L., and Pezz
`
e, M. (2006). Inferring
state-based behavior models. In Intl Wksp on Dynamic
Systems Analysis, Shanghai, China. ACM.
Mishra, P., Pilli, E. S., Varadharajan, V., and Tupakula, U.
(2017). Intrusion detection techniques in cloud envi-
ronment: A survey. Journal of Network and Computer
Applications, 77.
Quobyte Inc (2020). XtreemFS - fault-tolerant distributed
file system. http://www.xtreemfs.org.
Stillerman, M., Marceau, C., and Stillman, M. (1999). Intru-
sion detection for distributed applications. Communi-
cations of the ACM, 42(7).
Totel, E., Hkimi, M., Hurfin, M., Leslous, M., and Labiche,
Y. (2016). Inferring a distributed application behav-
ior model for anomaly based intrusion detection. In
European Dependable Computing Conf, Gothenburg,
Sweden. IEEE.
Vartouni, A. M., Kashi, S. S., and Teshnehlab, M. (2018).
An anomaly detection method to detect web attacks
using stacked auto-encoder. In Iranian Joint Congress
on Fuzzy and Intelligent Systems, Kerman, Iran. IEEE.
Wressnegger, C., Schwenk, G., Arp, D., and Rieck, K.
(2013). A close look on
n
-grams in intrusion detec-
tion: anomaly detection vs. classification. In Wksp on
Artificial Intelligence and Security, Berlin, Germany.
ACM.
Zolotukhin, M., H
¨
am
¨
al
¨
ainen, T., and Juvonen, A. (2012).
Online anomaly detection by using n-gram model and
growing hierarchical self-organizing maps. In Intl Wire-
less Communications and Mobile Computing Conf, Li-
massol, Cyprus. IEEE.
SECRYPT 2022 - 19th International Conference on Security and Cryptography
340
