
Creating an Automatic Road Sign Inventory System using a Fully
Deep Learning-based Approach
Gabriele Galatolo, Matteo Papi, Andrea Spinelli, Guglielmo Giomi, Andrea Zedda
and Marco Calderisi
Kode Srl, Lungarno Galilei 1, Pisa, Italy
Keywords: Deep Learning, Computer Vision, Object Recognition, Object Tracking, Image Processing, Traffic Sign
Recognition.
Abstract: Some road sections are a veritable forest of road signs: just think how many indications you can come across
on an urban or extra-urban route, near a construction site or a road diversion. The automatic recognition of
vertical traffic signs is an extremely useful task in the automotive industry for many practical applications,
such as supporting the driver while driving with an in-car advisory system or the creation of a register of
signals for a particular road section to speed up maintenance and replacement of installations. Recent
developments in deep learning have brought huge progress in the image processing area, which triggered
successful applications like traffic sign recognition (TSR). The TSR is a specific image processing task in
which real traffic scenes (images or frames from videos taken from vehicle cameras in uncontrolled lighting
and occlusion conditions) are processed in order to detect and recognize traffic signs within it. Traffic Sign
Recognition is a very recent technology facilitated by the Vienna Convention on Road Signs and Signals of
1968: during that international meeting, it was decided to standardize traffic signs so that they could be
recognised more easily abroad. Finally, this work summarizes our proposal of a practical pipeline for the
development of an automatic traffic sign recognition software.
1 INTRODUCTION
In the last decade, the field of computer vision has
made great strides in the execution of complex tasks.
Some of them, before the advent of proper
technologies, would have required a huge effort from
an algorithmical and experimental point of view,
including specific knowledge about the management
of the images –e.g. edge detection and image
thresholding for the object recognition case.
The increase in computational power, driven by
the development of GPUs as a tool for both graphics
purposes and for generic processing, and the
evolution of deep learning applied to computer vision
has produced significant results in tasks such as:
object classification (Krizhevsky et al., 2012), object
recognition (Redmon et al., 2016) within an image or
on a streaming of images, identification of an object
as a unique entity within a video (Wojke et al., 2017)
(i.e., object tracking), segmentation of images (He et
al., 2017) into its semantic components, and so on.
A field where these tools have been focused is the
one concerning traffic road signs, due to its
application in several research topics, such as neuro-
imaging or autonomous-driving. In the latter case,
several works cocentrate on the recognition or
classification of traffic road signs, from static images
(Stallkamp et al., 2011), from video (Wong et al.,
2018), in both normal and challenging meteorological
and light conditions (Dogancan et al, 2019).
However, in these studies the key-point is to
"consume" the information about the traffic road
signs at the moment in which they were recognized.
In this paper we present the implementation part
of a proof of concept of a wider project and we
concentrate on a more complex task that involves an
end-to-end process of recognition and creation of a
traffic road signs registry using video images starting
from video recorded with a general purpose camera.
Thus, using the previously cited techniques, we set up
an elaboration pipeline able to start from a video,
which includes an associated GPS track, and to
automatically create the geolocalized registry of road
signs for a video-recorded road segment. The
geolocalization phase consists of extracting GPS data
from the video source and properly synched with
102
Galatolo, G., Papi, M., Spinelli, A., Giomi, G., Zedda, A. and Calder isi, M.
Creating an Automatic Road Sign Inventory System using a Fully Deep Learning-based Approach.
DOI: 10.5220/0011266100003277
In Proceedings of the 3rd International Conference on Deep Learning Theory and Applications (DeLTA 2022), pages 102-109
ISBN: 978-989-758-584-5; ISSN: 2184-9277
Copyright
c
2022 by SCITEPRESS – Science and Technology Publications, Lda. All rights reserved
detected road signs. The detection phase consists of
an object detection task aimed to isolate the portion
of an image corresponding to the candidate sign. The
recognition phase consists of a series of supervised
learning methodologies to decide whether a candidate
sign belongs to the group of road signs or not, and
then according to its formal features, the sign is
classified in a particular label class.
The main problems to be addressed are: the
presence of noise; the mismatch between the video
track and the GPS-track and the consequent strategy
to assign the coordinates of the roadsign; the ability
to distinguish between highways and freeways signs,
and what they represent.
The paper is organized as follows: in section 2 we
will explore the related works and how we
differentiate from them; in section 3 we propose our
implementation of the elaboration pipeline, focusing
on the most important aspects of the problems we
resolved; in section 4 we describe the experiments we
executed on some real cases; finally, we will conclude
with final considerations about the project and some
future work and improvements.
2 RELATED WORKS
In literature, as we highlighted in the introduction,
most of the papers are focused on one of the single
task that ultimately composes an automatic tool to
create a geolocalized registry of traffic road signs.
Anyway, some works address the whole problem of
getting an automatic inventory of the existing road
signs using several techniques apart from images.
One direction is to use the LIDAR technology to
get spatial information of the environment as cloud
points and then apply the so-obtained information
methods to detect specific signals. The LIDAR cloud
points could be analyzed by using Histogram of
Gradients and SVM for classification, as suggested in
(Shanxin et al. 2019).
Another approach, used by (Tabernik, Skočaj,
2020), is to analyze images and use a masking
technique, for example by using the Mask R-CNN
models, to detect and cut the precise portion of the
image that contains road signs; at the same time, the
model also returns the classification of the road sign.
However, the aforementioned papers still focus
on the detection and recognition part of the process.
Some companies implementing street view
applications, such as Mapillary, provide a different
direction to get information about road signs.
Basically in this case the task’s focus is on the
analysis of all the objects from a video recorded,
using complex systems to segment each part of the
images, get information about the road lanes,
vehicles, and other objects like lampposts or shops
(Neuhold et al., 2017) (Cermelli et al., 2020). This
approach is then completely image-based, and it does
not rely on any other physical tool.
However, we must observe that these systems
provide more general services related to the road
surface, while our focus is on the development system
module that strictly analyzes road signs. This includes
the recognition of the positioning on the carriageway
and the detailed description related to those road signs
that present more information than a single
pictogram. Furthermore, the road signs that are taken
into account from these services are a subset of the
existing ones, while in our case (since the task’s main
focus is the inventory of all the road signs) we aim to
recognise also several signals different from warning
sings and simple indication (e.g. one way or obligated
direction) such as: more details on complex road
signs, temporary signals, complimentary road signs
and so on.
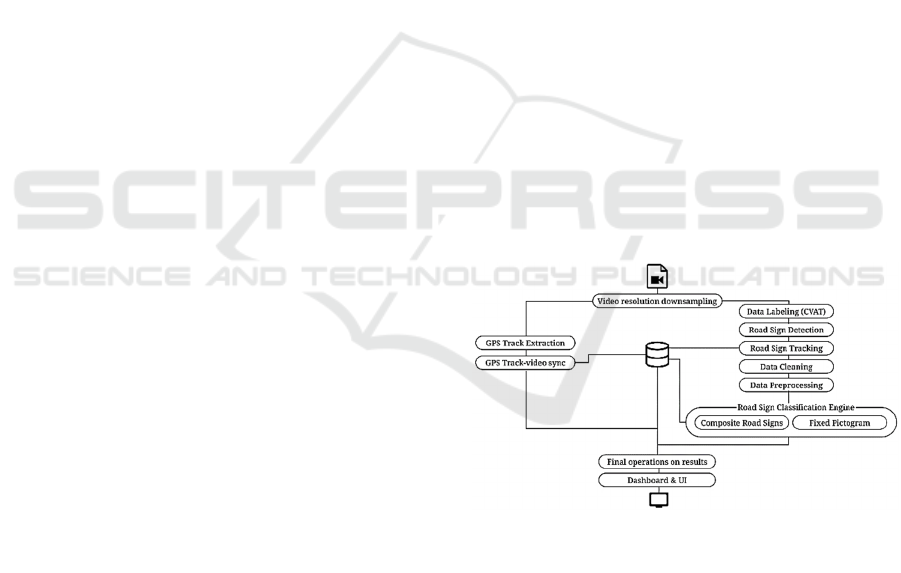
3 METHODOLOGY
Our implementation of the Traffic Sign Recognition
system exploits several well-known algorithms by
assembling them in a semi-linear pipeline.
Figure 1: Schematic representation of the system.
Firstly, we trained a four class object detection
model to detect the single road sign and provide a
rough estimation of its type. The bounding boxes
resulting from the output of the detection algorithm
were used within a tracking system to create a single
track of the detected sign. Each track was thus aligned
with the GPS data and then stored in a database.
The outputs of the tracking (bounding boxes and
labels) are used to crop images to isolate the
corresponding signs inscribed within the bounding
box. This enters into a filtering module for data
Creating an Automatic Road Sign Inventory System using a Fully Deep Learning-based Approach
103
cleaning: a convolutional neural network,
implementing a binary classification model, that
refines the output of the tracking phase by eliminating
the cropped images containing noise and
unrecognisable portions of signs.
We used a binary data classification to clear the
whole image dataset removing wrong crops or
images that contain a small part of a road sign.
The outputs of this filter are then given as input to
the last classification module of the workflow: the
road sign classification engine.
This module is responsible for classifying the
cropped road signs according to the existing labels
(77 for this PoC, but 504 in total for the roll-out
phase).
3.1 Data Preprocesisng and Labelling
The video used for the analysis of traffic signals is
one 13-minutes-video in 4K resolution (3840 x 2160
pixel) with 3 channels RGB shot from GoPro Hero
Silver 7 dashcam.
In order to speed up the frame processing, the
videos are preprocessed by applying a video
resolution reduction: this changes the resolution from
3840 x 2160 to 854 x 480 pixels, keeping the same
frame rate of 30 fps. The frame collection has been
subdivided into two parts: the first 11 minutes frames
were used for supervised learning (80% training and
20% validation) and the remaining 2 minutes frames
were used for the demonstrative demo of the
application. The dataset extracted from the video
provided us with a portion of the final dataset,
comprising only a few dozen of specific signs. To
enrich our dataset, increasing the number of samples
for each road sign labelled in the video, we use a
selected part of the GTSRB - German Road Sign
Dataset (Houben et al., 2013) and part of the DITS -
Data set of Italian Traffic Signs (Youssef et al., 2016).
3.2 Road Signs Detection
Object detection is a computer vision technique that
allows to identify and locate objects of certain classes
within an image or video. In particular, object detection
draws bounding boxes around the detected objects,
which allow us to locate the object in an image.
In our case, we need a quick response from
detection on videos in order to provide the following
ML steps with input data for their tasks and tests.
Therefore we opt for one-staged methods and in
particular implying state-of-the-art model YOLO
version 3, which already has been proven successful
in the detection of traffic signs. YOLO (You Only
Look Once) employs convolutional neural networks
(CNN) to detect objects in real-time. As suggested by
the name, YOLO uses a single forward propagation
through a neural network to detect objects in a single
image. The model gives as an output different class
probabilities and bounding boxes simultaneously.
3.3 Road Signs Tracking
The next step in the pipeline is object tracking of to
the traffic signs throught the frames of the recorded
video. Object tracking is the application of deep
learning methodologies in which we take as input a
set of object detections and develop a unique
identification for each of the detected objects and then
track them as they move around frames in a video. In
other words, object tracking is the task of
automatically identifying objects in a video and
interpreting them as a set of trajectories with high
accuracy. For this task we used DeepSORT5, an
extension of SORT (Simple Real-time Tracker).
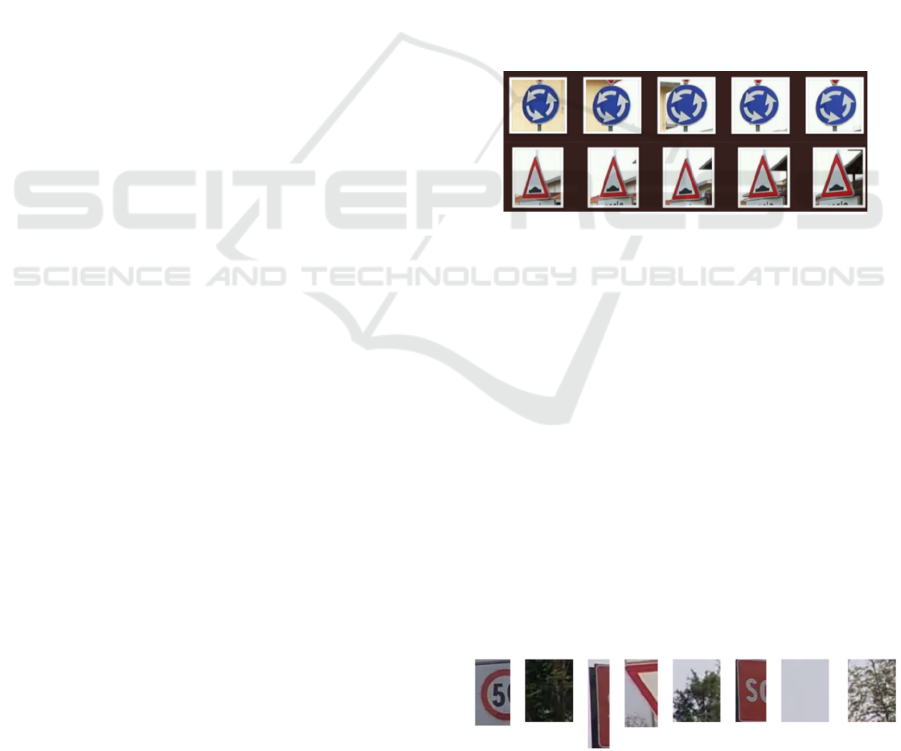
Figure 2: Outputs of the tracking module for two road signs.
In the example shown in figure 2, we show two
outputs of two road signs detected for 5 consecutives
frames.
3.4 Binary Classification for Noise
Removal
What we find out at this stage of the pipeline is the
presence of a good amount of noisy instances cropped
out of the frames. This is mainly due to the YOLO
network that produce bounding boxes containing
portions of the landscape (i.e. trees, sky and
environmental elements) or portions of signs
(captured just before the car surpasses the road sign)
too little to be considered relevant in later steps of
training.
Figure 3: Some bounding boxes to be filtered out from the
subsequent processing.
DeLTA 2022 - 3rd International Conference on Deep Learning Theory and Applications
104

To solve this binary classification task, we opted
for the use of a convolutional neural network, that we
present more in detail in the Experimental Setup and
Testing section.
3.5 Road Signs Classification Engine
At the final stage of the pipeline, the processed
images actually representing road signs, as per our
hypothesis after the cleaning phase, pass as input to
the Road Data Signs Classification Engine.
Basically, the classification engine is composed
by two subsystems, each of which is dedicated to the
classification of a very specific type of road element:
the first one, the Fixed Pictogram classification
subsystem, is used to recognize all those road signs
represented by fixed pictograms; the second, the
Composite Road Sign classification subsystem, is
used to get information and a more detailed
classification of all those indications and information
signals that contains several indications and/or a
richer and variable semantics, as shown in figure 4.
3.5.1 Fixed Pictogram Classification
Subsystem
Starting with deep learning methodologies and
architectures related to the Traffic Sign Recognition
task, we experimented convolutional neural networks
for this stage. Before training the network, it was
necessary to balance the dataset doing an
undersampling of signs with a huge number of images
and a data augmentation for those classes of signs with
few images. For the oversampled road signs we
considered 200 as a reasonable threshold of instances.
For data augmentation, we used various settings of
some image parameters such as random zoom, a shift
in width or height, a brightness range and a crop range.
We will detail the network and the preprocessing phase
in the Experimental Setup and Testing section.
3.5.2 Composite Signs Classification
Subsystem
Pictogram-based road signs are just one of the two
main families of traffic road signs. On the other hand,
we can define all those signals that are somehow
composed of several sub-pictograms, arrows, and
descriptions with variable text.
Figure 4: Examples of composite road signs.
In this case, the road signs contain a complex
semantic derived by how the internal pictograms are
placed, the presence and the directions of the arrows
–if any– and by the written component, as shown in
the figure 4.
At this stage of the project we implemented a
rough estimation of the most important features of
these indications. This estimation is based on a colour
mapping study of the road signs under examination,
in order to identify an approximative description.
For example, the middle road sign in the figure 5
will be detected as: “Freeway indication signal, with
touristic indication and other signals”
Going into detail, each image is given as input to
a function that executes three fundamental steps.
Firstly the number of distinct colours used in the
image is reduced up to a subset of k different ones
using the colour quantization. Secondly, the k-colours
generated after quantization are mapped into a family
colour, using the standard RAL Palette. Thus, the
color distribution map from the quantized vector is
created in the following way: if the i-th colours of the
given k, using the RGB values, matches with one of
those are contained in the RAL Palette, we set the i-
th family consequently using the associated family
colour; otherwise, we calculate the euclidean
distance, still using RGB values, from the i-th colour
and all the elements of the RAL Palette assigning to
the i-th colour the family of the most similar colour
found into the palette. Finally, counting the number
of pixels that belong to each group of colours returns
the macro colour distribution.
Once created the colour distribution map of the
image, a set of rules based on this distribution is used
to define the nature of a specific signal. For example,
a greener road sign is probably a highway indication.
3.6 Road Signs Geolocalization
In order to assign a precise location to each road sign
detected, we need to know the GPS track of the path
recorded with the camera and the output of the
tracking algorithm which identifies programmatically
each signal in the picture stream that composes the
video.
We used the results of the video tracking phase
since we assume that the last frame in which the sign
is visible during the recording phase is the one with
the timestamp that can be used to match the
corresponding coordinates with the nearest
timestamp in the GPS track. For example in figure 2,
for both cases the 5th frame will be identified as the
selected time-stamped image for that signal to be used
for GPS mapping.
Creating an Automatic Road Sign Inventory System using a Fully Deep Learning-based Approach
105

The video has a fixed and known "sampling
time", because it depends on how many frames per
second are set up for the recording (30 fps in our
case); the GPS track instead is not recorded at a fixed
amount of time, due to technical reasons, e.g. missing
or weak signal.
So, in general, we can consider the two tracks
coming from different devices. To synch the selected
frames, one per unique signal, we use this simple
algorithm: assume t
frame
the timestamp of the last
frame where we detect a signal, assign the coordinate
at the timestamp t
i
gps
in the GPS track for which:
|t
frame
–
t
i
gps
|
<
|
t
frame
–
t
j
gps
|
, i ≠
j
(1)
4 EXPERIMENTAL SETUP AND
TESTING
To experiment the entire process we used two videos
which differ for the context where they have been
recorded. In the first one, we have 5 minutes of a
recording made on an highway; in this case we have
the most similar context to the one we used to train all
the models (detection, tracking, noise removal, and
classification), which derived from another video
recorded on an highway. The second one, is a 9
minutes video recorded on a mountain freeway road
section, which has a different context in terms of
number and types of road signs.
All the stages of the processing pipeline have
been executed on a machine equipped with 2 Intel(R)
Xeon(R) CPU @ 2.30GHz, 12 GB RAM and a GPU
NVidia Tesla T4 with 16GB of dedicated RAM.
4.1 Experimental Setup of the Models
4.1.1 Object Detection Network
For the stage of road sign detection, we used the well-
known YOLO network, in particular the Darknet
implementation (Redmon 2016). We used the default
settings, modifying just those parts that depend on the
number of classes to be detected, 4 in our case: the
indication road signs, prescription road signs,
integrative road signs, and temporary road signs.
After 9000 iterations, the performances of the best
model trained are summarized in the table 1.
Table 1: YOLO best model’s performances.
Precision Recall
F1-
Score
Average
IoU
mAP@
50
85.6% 77% 81.12%
75.96% 72.4%
If we examine the detail of the performances we
can do some further considerations.
Table 2: YOLO best model’s performances detail for each
road sign category.
Category
True
Positive
False
Positive
ap
(average
precision)
Indication 1284 213
84.12%
Prescription 314 40
67.18%
Integrative 24 24
50%
Temporary 45 7
88.32%
As we can clearly see in the table above, emerges
the fact that we used a heavily unbalanced dataset, if
we consider the distribution of the categories.
However, we chose to use this dataset because the
main task of the network, at this stage, is the
recognition of the road sign itself; the possibility to
categorize each road sign with this initial rough
estimation is just a nice-to-have feature that can be
used also in the following to improve the overall
analysis.
4.1.2 Noise Removal Network
The noise removal network is, as already described
earlier, a simple convolutional neural network which
implements a binary classification model. The
architecture of the model is shown in figure 5. The
chosen architecture employed 3 convolutional layers
with ReLU activation, 3 max-pooling layers, 2
dropout layers, 1 flatten layer and 1 fully connected
layer before the last dense layer with sigmoid
activation.
Figure 5: Schematic representation of the CNN
implmenting the noise removal task.
Thus adopting a solution with low
parametrization, 30785 parameters, we reduced the
consumption of resources (both computational and
spatial) for a task clearly important but for which we
can tolerate some misclassification.
DeLTA 2022 - 3rd International Conference on Deep Learning Theory and Applications
106

To train this network we used a dataset with 10k
images grouped in two classes, noise and road signs.
In the table 3, the performances of the network
on a test set of 3k images.
Table 3: Noise Removal Network performances (test set).
Precision Recall F1-Score Accuracy
93.66% 62.53%
75% 74.75%
4.1.3 Road Signs Classification Network
Due to the importance of this step of the pipeline, we
tested different kinds of networks with the aim of
choosing the best one to use in the multi-classes
classification task.
On one side LeNet (Lecun et al., 1998), a simple
low configuration network, on the other ResNet-34
(He et al., 2016), a complex high configuration
network. We had in our datasets 77 classes of road
signs; the entire dataset consisted of 21477 images,
while we use other 8482 images (approximately 100
per class) as a test set.
As reported in the previous section, the initial
dataset was very unbalanced. In addition to the
enrichment via external data sources and the
undersampling of the numerous road signs images,
we used a vector of class weights to penalize the more
present classes and to promote the less common ones.
This corrective, inspired by (Tomz et al., 2003), was
used by means of the Sklearn implementation.
In the table 4 we can see the performances of the
two experimented networks on the test set
Table 4: Experimented models’ performances.
Model Parameters Accuracy
LeNet Improved 2.588.507
97.5%
ResNet 21.341.197
90.19%
The comparison between the final performances
of the two models on the test set and the memory
occupation, given by the number of parameters of the
network, clearly lets us choose as model of
classification the one trained using the LeNet
architecture.
4.2 System Performance on Test Data
Once the processing pipeline was deplo, we tested it
using the two videos we mentioned in the
introductory part of this section. In particular, the test
results we show in the following are characterized by
the fact that they could be read from different point of
views. By dataset: HWAY for the one recorded on the
highway, and FWAY for the one recorded on the
freeway. By type of matching considered: ‘Category’
for the matching between main categories of the road
signs (e.g. Prescription Signal), ‘Full’ for the
matching between main categories and the detail of
the road signs (e.g. Prescription Signal and Speed
Limit 70 Km/h).
Table 5: Detection and Classification Accuracies.
HWAY
Dataset
FWAY
Dataset
Average
Category 96.29% 92.78%
94.63%
Full – Top1 64.48% 44.32%
55.12%
Full – Top3 84.95% 61.16%
73.61%
As we can see in the table 5, the matching using
the main category reaches a higher accuracy, because
in most cases the shape and the colours make it
simpler to get the main categorization of each road
sign. On the other hand, to get more accurate results
for full detection we need an improvement for what
concerns images with very different light, weather
and context conditions, and an increase in the initial
dataset size as well. Nonetheless, the accuracies we
get for the full matching cases are quite good if we
consider the way in which the system will be finally
used by the operator.
Figure 6: Examples of detection from the prototypal UI of
the system.
In fact, the system provides not only the most
probable class for each road sign (the Top1 case) but
also a list of 3 possible alternatives, whether the
probability is over a certain threshold for the latter
ones, from which the operator can choose to correct
the detection (the Top3 case). In this case, we reach
good performances, even though the initial dataset
was not so exhaustive.
In the next table we detail the Full matches
grouped by main categories, where available within
the dataset.
Creating an Automatic Road Sign Inventory System using a Fully Deep Learning-based Approach
107

Table 6: ‘Full’ matches detail grouped by categories.
Category
HWAY
Dataset
FWAY
Dataset
Average
Full – Top1
Indication 58.82% 16.67%
41.37%
Prescription 67.27% 51.61%
58.97%
Integrative 72.21% -
72.21%
Temporary - 63.64%
63.64%
Full – Top3
Indication 76.42% 36.72% 66.57%
Prescription 88.27% 55.61% 71.94%
Integrative 84.72% - 84.72%
Temporary - 68.12% 68.12%
Thus, while we have to improve the system to
return the correct result as first, we can see in any case
how the response improve significantly for all the
categories of road signs when search for the correct
one in the Top3 suggestions. This fact open to us the
possibility to create a system that, even though not
foolproof, anyway allow the user to correct in several
cases the wrong "best" detection by using another one
of the suggested ones in the top three results.
Finally, in the figure 6, we show some of the
detections as the UI of the prototypal system presents
them to the human operator after completing the
video analysis. The images that are shown represent
the main frame in which the road sign has been
detected and, in the top-left box of each image, the
bounding box created by the YOLO network and used
subsequently in the classification stage.
In particular, we reported here four examples of
interesting cases. On the left, we have two road signs
correctly identified and classified (examples of what
we called ‘Full’); in the top-left case, we have a fixed-
pictogram, while in the bottom-left case we have a
composite road sign, which is recognized in detail as:
“Highway indication sign with freeway and urban
indications”
On the right, we have two cases of wrongly
detected road signs: the bottom-right detection shows
an advertising panel detected as a road sign, even
though a road sign is contained in the bounding box.
This case is considered as an erroneous image that
should be filtered out from the noise removal stage.
On the top-right, we have a case in which the road
sign in the bounding box doesn't belong to any of the
classes we have in our initial dataset: anyway, this
case is significant since it is clear how the system tries
to fit as best as possible in order to return to the
operator what the "system thinks" to be the better
choice.
5 FUTURE WORK
Currently, we developed all the basic steps of the
pipeline; with a larger number of videos in order to
increase the initial dataset, including heavier weather
or light conditions, we will already be able to boost
the number of possible road signs that the system can
detect and raise at the same time the precision in the
classification. All of these improvements can be
gained just using the existing models and
architectures. Furthermore, we still have some work
to improve the overall process.
Firstly, we need to implement a system to
reconcile road signs that are recognized twice or
more; this is caused by a known possibility of the
object tracker losing the tracking for one or more
instants, and consequently assigning a new identifier
to an already seen object. In this case, we need to
reduce the number of errors by implementing online
recovery strategies to retrieve the existing identifier,
or to do a post-processing analysis to identify all the
different sets of road signs that actually can be
merged.
Secondly, we can improve the recognition of the
non-pictogram-based road signs using neural
networks for image captioning, in order to have a
symbol-based tool to describe all the signals that
cannot be statically categorized.
Finally, we can further improve the point above
by investigating more techniques that combine
detection of sub parts of a complex road sign, then
another object detection task, with graph neural
networks that, considering the disposition of the
symbols and their schematic relationships, can return
more detailed information about a specific road sign.
6 CONCLUSIONS
In this paper, we present an organic approach to the
development of a system that automatically analyses
streams of video to create a road sign inventory. Since
this represents the result of a proof of concept of a
wider project that is still in development, all the
material we presented is in a preliminary phase. In
DeLTA 2022 - 3rd International Conference on Deep Learning Theory and Applications
108

particular, we created a proof of concept of a pipeline
that uses techniques related to the object detection in
video record to detect all visible traffic signals at any
given time; object tracking methodologies to assign a
unique identity to each object detected through time;
convolutional neural networks to filter out noise
images and to get the class of each road sign; colour
quantization and processing about colour distribution
to get details of the road signs not pictogram-based.
With the pipeline developed so far, we showed
how it is possible to implement a simple process that
is able, with existing architectures even with low
parametrization, to create a tool that aids the operators
of road maintenance to have a clear status, both in
terms of positioning and in terms of quantity, of the
installed road signs.
Further work must be done to make the overall
system to be more effective in a production
environment automating the workflow as much as
possible.
ACKNOWLEDGEMENTS
The project has been funded and supported in the
context of a wider project of processes automatization
of Sias S.p.A., that provided data we used to create
the PoC and the support to create and evaluate the
datasets and the entire workflow. We would also like
to thank the key figures in Sias S.p.A. Luca Furloni,
Paolo Strazzullo, and Matteo Lazzarini, which
actively supported us throughout all the
implementation stages.
REFERENCES
He K., Gkioxari G., Dollar P., Girshick R. (2017) Mask R-
CNN, in Proceedings of the IEEE International
Conference on Computer Vision (ICCV), pp. 2961-
2969
Redmon J., Divvala S., Girshick R., Farhadi A. (2016) You
Only Look Once: Unified, Real-Time Object Detection,
in Proceedings of the IEEE Conference on Computer
Vision and Pattern Recognition (CVPR), pp. 779-788
Wojke N., Bewley A., Paulus D. (2017) Simple online and
realtime tracking with a deep association metric, in
IEEE International Conference on Image Processing
(ICIP) 3645-3649
Krizhevsky A., Sutskever I., Hinton G. (2012) ImageNet
Classification with Deep Convolutional Neural
Networks, in Neural Information Processing Systems.
25
Stallkamp J., Schlipsing M., Salmen J., Igel C. (2011) The
German traffic sign recognition benchmark: a multi-
class classification competition, in Neural Networks
(IJCNN), The 2011 International Joint Conference on,
pages 1453–1460. IEEE
Houben S., Stallkamp J., Salmen J., Schlipsing M., Igel C.,
(2013) Detection of traffic signs in real-world images:
The German traffic sign detection benchmark, in The
2013 International Joint Conference on Neural
Networks (IJCNN), pp. 1-8, doi:
10.1109/IJCNN.2013.6706807
Wong A., Shafiee M. J., St. Jules M., (2018) MicronNet: A
Highly Compact Deep Convolutional Neural Network
Architecture for Real-Time Embedded Traffic Sign
Classification, in IEEE Access, vol. 6, pp. 59803-
59810, doi: 10.1109/ACCESS.2018.2873948
Dogancan T., Min-Hung C., Ghassan A. (2019) Traffic Sign
Detection Under Challenging Conditions: A Deeper
Look into Performance Variations and Spectral
Characteristics, in IEEE Transactions on Intelligent
Transportation Systems. PP. 1-11.
10.1109/TITS.2019.2931429.
Shanxin Z., Cheng W., Lili L., Chenglu W., Chenhui Y.,
Zhemin Z., Jonathan L. (2019) Automated Visual
Recognizability Evaluation of Traffic Sign Based on 3D
LiDAR Point Clouds, in Remote Sensing. 11. 1453.
10.3390/rs11121453
Youssef A., Albani D., Nardi D., Bloisi D. (2016) Fast
traffic sign recognition using colour segmentation and
deep convolutional networks, in International
conference on advanced concepts for intelligent vision
systems. Springer, Cham, p. 205-216.
Tabernik D., Skočaj D., (2020) Deep Learning for Large-
Scale Traffic-Sign Detection and Recognition, in IEEE
Transactions on Intelligent Transportation Systems,
vol. 21, no. 4, pp. 1427-1440, doi:
10.1109/TITS.2019.2913588.
Neuhold G., Ollmann T., Bulò S. R., Kontschieder P.
(2017) The Mapillary Vistas Dataset for Semantic
Understanding of Street Scenes, in 2017 IEEE
International Conference on Computer Vision (ICCV),
pp. 5000-5009, doi: 10.1109/ICCV.2017.534
Cermelli F., Mancini M., Rota Bulò S., Ricci E., Caputo B.
(2020) Modeling the Background for Incremental
Learning in Semantic Segmentation. 9230-9239.
10.1109/CVPR42600.2020.00925.
Tomz M., King G., Zeng, L. (2003) ReLogit: Rare Events
Logistic Regression, in Journal of Statistical Software,
8(2), 1–27. https://doi.org/10.18637/jss.v008.i02
Redmon J. (2016) Open Source Neural Networks in C, URL
http://pjreddie.com/darknet/
Lecun Y., Bottou L., Bengio Y., Haffner P. (1998)
Gradient-based learning applied to document
recognition, in Proceedings of the IEEE, vol. 86, no. 11,
pp. 2278-2324, doi: 10.1109/5.726791.
He K., Zhang X., Ren S., Sun J. (2016) Deep Residual
Learning for Image Recognition, in 2016 IEEE
Conference on Computer Vision and Pattern
Recognition (CVPR), pp. 770-778, doi:
10.1109/CVPR.2016.90.
Creating an Automatic Road Sign Inventory System using a Fully Deep Learning-based Approach
109
