
Multilinear Modeling and Simulation of a Multi-stack PEM Electrolyzer
with Degradation for Control Concept Comparison
Aline Luxa
1 a
, Niklas J
¨
ores
1 b
,Carlos Cateriano Y
´
a
˜
nez
1,2,3 c
, Marina Nascimento Souza
1 d
,
Georg Pangalos
1 e
, Leona Schnelle
2 f
and Gerwald Lichtenberg
2 g
1
Application Center for Integration of Local Energy Systems, Fraunhofer IWES, Hamburg, Germany
2
Faculty of Life Science, HAW Hamburg, Germany
3
Universitat Polit
`
ecnica de Val
`
encia, Instituto Universitario de Autom
´
atica e Inform
´
atica Industrial, Val
`
encia, Spain
Keywords:
Multilinear Simulation, Energy Systems, PEM Electrolyzer, Multi-stack Operation, Controller Design,
Degradation, Wind Energy.
Abstract:
Hybrid energy systems, e.g., with wind energy and hydrogen production, have a high model complexity due
to their multi-physics nature, which poses major control challenges for the optimization of plant operation.
This work aims at addressing this issues by introducing a highly efficient modeling and simulation framework.
A proton exchange membrane (PEM) electrolyzer stack, including degradation and controller, has been mod-
eled using the multilinear class. This class enables the automatic append of individual models, which is used to
stack a 100 multi-stack PEM electrolyzer model. Moreover, the multilinear class models can be represented as
tensors, which allows for efficient decomposition methods and formats. This is used to considerably enhance
the simulation performance of the system, making the simulation of a one year multi-stack electrolyzer opera-
tion possible, with a reasonable computational cost. In the simulation, two different high-level control modes
are compared regarding overall degradation gain and electrolyzer efficiency. The developed modeling and
simulation framework has proven its suitability for big-scale complex models, enabling efficient simulations
for controller analysis.
1 INTRODUCTION
The transition of the energy system from centralized
to local holds a variety of challenges, which can be
tackled by model-based approaches. For this, simu-
lation problems are getting larger with an enormous
number of states. Therefore, innovative modeling
methods are needed to be able to solve control and
optimization tasks.
The future power grid will be constructed of
a multitude of local energy systems. These are
formed by combinations of renewable energy gen-
eration units, consumers, and energy storage sys-
tems. This results in a modeling problem for con-
a
https://orcid.org/0000-0002-3025-3274
b
https://orcid.org/0000-0003-2471-3892
c
https://orcid.org/0000-0001-5261-2568
d
https://orcid.org/0000-0003-2523-5669
e
https://orcid.org/0000-0001-5094-8033
f
https://orcid.org/0000-0002-2600-8110
g
https://orcid.org/0000-0001-6032-0733
trolling numerous local energy system (LES). One
possible composite of LES is a coupled wind park
with electrolyzers for hydrogen production. Accord-
ing to the coalition agreement 2021to2025, Germany
has a 10 GW goal of electrolysis capacity until 2030.
To achieve this goal, Germany would need to build
several plants in the larger MW range, many of which
are already being planned. Trianel and Stadtwerke
Hamm signed a joined venture with the goal to in-
stall 20 MW electrolyzer capacity in the natural gas
power plant Hamm-Uentrop by 2022. Shell, Mit-
subishi Heavy Industries, Vattenfall and W
¨
arme Ham-
burg signed a declaration of intent to build 100 MW
installed capacity of electrolysis in the port of Ham-
burg, which is supposed to be in operation in 2025
(Geitmann, 2022).
In the near future, the mass production of proton
exchange membrane (PEM) electrolysis stacks in the
larger kW to MW range is expected. Systems of mul-
tiple GW capacity will be mostly composed of stacks
between 1 and 2 MW (P. Ayivor et al., 2018). There-
fore, electrolyzer systems with a nominal capacity in
52
Luxa, A., Jöres, N., Yáñez, C., Souza, M., Pangalos, G., Schnelle, L. and Lichtenberg, G.
Multilinear Modeling and Simulation of a Multi-stack PEM Electrolyzer with Degradation for Control Concept Comparison.
DOI: 10.5220/0011263300003274
In Proceedings of the 12th International Conference on Simulation and Modeling Methodologies, Technologies and Applications (SIMULTECH 2022), pages 52-62
ISBN: 978-989-758-578-4; ISSN: 2184-2841
Copyright
c
2022 by SCITEPRESS – Science and Technology Publications, Lda. All rights reserved

the larger MW to GW area will be constructed of
several hundred stacks. In a modular approach for
a high power electrolysis system, stacks are usually
connected in parallel or sometimes in series, which
is then called string or cascade. Larger systems with
smaller stacks are constructed with strings connected
in parallel.
There are many stack manufactures that offer
modular scale-up solutions, e.g., Green Hydrogen
Systems (GHS) alkaline electrolyzer system is scal-
able up to 20 MW, while GHS current portfolio
is offering options in the range from 125to390 kW
(Green Hydrogen Systems, 2022). Similarly, H-
TEC SYSTEMS offers a PEM electrolyzer of 1 MW
containing 9 stacks (H-TEC SYSTEMS GmbH,
2022). Enapter approaches the market with a
highly modular anion exchange membrane (AEM)
system with nominal capacity of 1 MW composed
of 420 stacks (Enapter, 2022). Therefore, the mod-
eling problem of control and operation optimization
for the multi-stack electrolyzer (mELY) emerges.
When operating an mELY, there is the conflict be-
tween optimizing efficiency and stack lifetime. Gain-
ing a higher efficiency by running more stacks in par-
tial load conflicts with degradation of each stack, de-
pending on the load. A central main controller has
to decide between partial load operation and shutting
down stacks completely to prevent aging. Therefore,
electrolyzer degradation plays a special role in the
modeling problem and cannot be neglected. The in-
troduction of degradation models into control applica-
tions is known generally but is not yet done for mELY,
to the best of the authors’ knowledge (Zagorowska
et al., 2020). It can be assumed that this is because
suitable degradation models and powerful modeling
approaches are missing.
Overall, the main purpose of the paper is build-
ing the base for the optimization of large controlled
mELY systems considering stack degradation, by us-
ing the multilinear time-invariant (MTI) model class.
The MTI model class, which current developments
can be explored in (Lichtenberg et al., 2022), is
a powerful modeling tool, when it comes to com-
bining submodels of a system. The possible auto-
matic model generation can be coupled with model
reduction methods, for decreased complexity and in-
creased simulation performance. With the MTI model
approximation of nonlinear models, basic nonlinear
phenomena are representable. Furthermore, the MTI
models allow deterministic runtimes with a rank, that
is increasing linearly, and not exponentially with the
order of the system(Lichtenberg et al., 2022). There-
fore, the MTI framework is chosen for the autom-
atized combination of the submodels: electrolyzer,
electrolyzer controller, degradation, and main con-
troller for renewable power distribution, for an arbi-
trary number of stacks. The modeling framework al-
lows to later on substitute every submodel easily, if,
e.g., degradation models develop further. The evalua-
tion of the simulation results help to decide for differ-
ent control schemes for mELY operation.
First, in section 2 multilinear modeling and the
applied methods for model reduction are introduced.
Afterwards, the used individual models are described
in section 3, including the electrolyzer, electrolyzer
controller, and degradation, which will be composed
to the total single-stack electrolyzer (sELY) model.
In section 4 the main controller model and the stack-
ing for the mELY model composition is described.
The section 5 contains a code to code validation of
the stand alone MTI electrolyzer stack model approx-
imation by comparing nonlinear, linear, and multilin-
ear simulation results. Furthermore, the total mELY
system is simulated with renewable power input from
wind data. Afterwards, the analysis of the simulation
results is executed in section 6. Finally, in section 7
the key findings are derived, and further steps are de-
scribed for future work.
2 MULTILINEAR MODELING
In the following chapter, the explicit multilinear time-
invariant (eMTI) model description will be intro-
duced, which is an extension to the standard linear
time-invariant (LTI) class. In contrast, to LTI the
eMTI class allows for multiplication of states and/or
inputs (Pangalos et al., 2013).
Explicit multilinear models are no universal ap-
proximators per se like other model classes (Hornik
et al., 1989). However, they are able to model
general polynomial dependencies by either extension
of the state space (Kruppa, 2018) or using implicit
forms (Lichtenberg et al., 2022). This chapter also
includes the model reduction methods.
2.1 Multilinear Tensor Modeling
The state and output equations of an explicit multi-
linear model in tensor representation as introduced
in (Pangalos et al., 2013; Lichtenberg et al., 2022) is
given as
˙
x =
h
F
|
M(x,u)
i
, (1a)
y =
h
G
|
M(x,u)
i
, (1b)
where
h
∼
|
∼
i
denotes the contracted prod-
uct, F ∈ R
n+m
z }| {
2 ×. .. ×2 ×n
and G ∈ R
n+m
z }| {
2 ×. .. ×2 ×l
contain the
Multilinear Modeling and Simulation of a Multi-stack PEM Electrolyzer with Degradation for Control Concept Comparison
53

parameters of the model and M(x,u) ∈ R
n+m
z }| {
2 ×. .. ×2
is
the monomial tensor given in canonical polyadic
(CP) decomposed form as
M(x,u) =
1
x
1
,...,
1
x
n
,
1
u
1
,...,
1
u
n
,
(2)
with number of states n, number of inputs m, and
number of outputs l. An example for n = 2 and m = 1
is given as
=
1
x
2
1
u
1
x
1
=
1
x
1
x
1
u
u
x
2
u
x
2
x
1
x
2
x
1
x
2
u
.
In case of full tensors, the contracted product is
calculated as illustrated by the following example
for a tensor X ∈ R
2×2×3
and a tensor Y ∈ R
2×2
. To
calculate the contracted product Z =
h
X
|
Y
i
∈ R
3
,
the matching dimensions, which are highlighted
in red, have to be multiplied element-wise
=
z
1
z
2
z
3
x
211
x
221
x
111
x
121
x
212
x
222
x
112
x
122
x
213
x
223
x
113
x
123
y
21
y
22
y
11
y
12
=
z
1
z
2
z
3
x
211
x
221
x
111
x
121
x
212
x
222
x
112
x
122
x
213
x
223
x
113
x
123
y
21
y
22
y
11
y
12
=
.
z
1
z
2
z
3
x
211
x
221
x
111
x
121
x
212
x
222
x
112
x
122
x
213
x
223
x
113
x
123
y
21
y
22
y
11
y
12
The element-wise multiplication is shown exemplar-
ily for z
1
as
z
1
= x
111
y
11
+ x
121
y
12
+ x
211
y
21
+ x
221
y
22
. (3)
To calculate the state update, when the model is
in CP tensor form with parameter tensors given as
F =
F
x
1
,...,F
x
n
,F
u
1
,...,F
u
m
,F
φ
, (4a)
G =
G
x
1
,...,G
x
n
,G
u
1
,...,G
u
m
,G
φ
, (4b)
the contracted product simplifies to
˙
x=F
φ
F
T
1
1
x
1
~· · ·~
F
T
n
1
x
n
~
F
T
n+1
1
u
1
~· · ·~
F
T
m+n
1
u
m
, (5a)
y=G
φ
G
T
1
1
x
1
~· · ·~
G
T
n
1
x
n
~
G
T
n+1
1
u
1
~· · ·~
G
T
m+n
1
u
m
, (5b)
where ~ denotes the element-wise or Hadamard prod-
uct.
2.2 Reduction of Simulation Complexity
To reduce simulation complexity, the transition ten-
sors F and G can be approximated using tensor de-
composition methods. The decomposition can be per-
formed by using the alternating least squares algo-
rithm (Kolda, 2006). In general, low values for the
ranks r
F
and r
G
are desired. However, a trade-off can
be seen between the rank and the approximation error.
Adequate values for r
F
and r
G
can be determined by
a parameter study, comparing the results of the mini-
mum possible rank for a solution of the optimization
and higher ranks until the error is acceptable (Bro and
Kiers, 2003). The approach on how to perform the CP
decomposition for MTI models is explained in (Pan-
galos et al., 2013; Lichtenberg et al., 2022).
The CP decomposed parameter tensor, as shown
in (4), can be normalized by applying different nor-
malization methods to the columns of the factor matri-
ces F
i
,i = x
1
,...,x
n
,u
1
,...,u
m
,φ as shown in (Licht-
enberg et al., 2022) for 1-norm and in (Schnelle et al.,
2022) for the euclidean 2-norm. The normalized pa-
rameter tensor
e
F=
h
e
F
x
1
,...,
e
F
x
n
,
e
F
u
1
,...,
e
F
u
m
,
e
F
φ
i
∈R
n+m
z
}| {
2 ×. .. ×2 ×n
,(6)
is defined by normalized factor matrices
e
F
i
∈ R
2×r
with i = 1...n + m, rank r, and
e
F
φ
∈ R
n×r
with arbi-
trary values.
With the so called sparse-norm, the columns of
the factor matrices of the not normalized CP tensor F
were normalized to their first elements such that all
first elements get fixed to one. This leads to a normal-
ized representation where only the second elements
need to be stored in a vector
˜
f
i
=
f
2,1
f
1,1
,
f
2,2
f
1,2
,··· ,
f
2,r
f
1,r
∈ R
1×r
, (7)
where f
1, j
∈ R\{0}, with j = 1 · · · r. The vectors can
SIMULTECH 2022 - 12th International Conference on Simulation and Modeling Methodologies, Technologies and Applications
54

be stored in a matrix
e
F =
˜
f
x
1
.
.
.
˜
f
x
n
˜
f
u
1
.
.
.
˜
f
u
m
=
e
F
x
e
F
u
∈ R
(n+m)×r
, (8)
and the MTI model is fully defined by this matrix and
e
F
φ
= F
φ
~ (λ
1
,λ
2
,...,λ
r
) ∈ R
n×r
, (9)
by element-wise multiplication with the weights of
normalization λ
j
=
∏
n+m
i=1
F
i
(1, j).
3 SINGLE-STACK
ELECTROLYZER MODELING
In this section all individual submodels for the sELY
combination will be described, followed by their
composition. Later on, the sELY units will be stacked
to build the total system for mELY simulation. The
shown example is a purely continuous-time problem
with all real variables. The current approach is re-
stricted to models with concentrated parameters de-
scribed by ordinary differential equations (ODE) and
not distributed parameters described by partial differ-
ential equations (PDE).
3.1 Electrolyzer Model
For this paper, a 46 kW PEM electrolyzer model
from literature is used to demonstrate the combi-
nation of the subsystems in eMTI format for large
mELY operations (Espinosa-L
´
opez et al., 2018). The
nonlinear model is built up in MATLAB/Simulink,
which is the base for the eMTI approximation, gener-
ated by the projection method (Kruppa et al., 2014).
The thermal dynamic electrolyzer model has two
states, i.e., temperature T and cooling power state x
PI
,
two inputs, i.e., current i
ely
and membrane degrada-
tion r
d
, and two outputs, i.e., voltage v
ely
and stack
efficiency η
ely
. Thus, the state, input and output vec-
tors are
x =
T
x
PI
,u =
i
ely
r
d
,y =
v
ely
η
ely
. (10)
The ODE for describing the thermal dynamic
states are introduced in the following. The temper-
ature change is described by
dT
dt
=
1
C
th
z
1
∑
k=1
˙
W
k
+
z
2
∑
k=1
˙
Q
k
+
z
3
∑
k=1
˙
H
k
!
, (11)
with z
1
power
˙
W , z
2
heat
˙
Q and z
3
enthalpy
˙
H streams,
and the lumped thermal capacity C
th
(Espinosa-L
´
opez
et al., 2018). As introduced in (Lichtenberg et al.,
2022), the cooling heat
˙
Q
cool
is directly controlled by
a PI controller, with state space model
˙
Q
cool
= x
PI
+ K
P
∆T, (12a)
dx
PI
dt
= K
I
∆T. (12b)
The electrolyzer efficiency is defined as
η
ely
=
˙n
H
2
H
s
p
ely
, (13)
containing the higher heating value of hydrogen H
s
and the output hydrogen molar stream ˙n
H
2
, which is
defined in (Espinosa-L
´
opez et al., 2018). For calcu-
lations of the electrolyzer voltage, cathode activation
overpotential and mass transfer losses are neglected.
Therefore, the equation reduces to
v
ely
= v
ocv
+ v
ohm
+ v
act−an
, (14)
including the open circuit voltage v
ocv
, ohmic overpo-
tential v
ohm
, and anode activation overpotential v
act−an
(Espinosa-L
´
opez et al., 2018).
For performing a multilinearization, an operating
range needs to be defined for the application. PEM
electrolyzers can be operated in overload for some
time, which is mostly limited by the thermal man-
agement (Kopp et al., 2017). Also, there could be
a restriction regarding a minimum load, which is in-
fluenced by the power consumption of ancillary com-
ponents. This would add a boolean state variable for
the electrolyzer operation for actually being turned on
or off. In mELY operation, running below minimum
load can mostly be prevented by completely turning
off stacks and shifting the power to different ones. Al-
lowing minimum or overload operation would there-
fore add another two boundary conditions to the main
controller introduced in subsection 4.1. Nevertheless,
for this demonstration there is no benefit in this, since
the degradation model cannot yet include the effect
of start-stop events. Therefore, the operating range
is assumed to be 0to100 % of the nominal load p
nom
of 46 kW for each stack, at the state of begin of life
(BoL) (no degradation). Even though the electrolyzer
is only operated until 100 % load, the upper and lower
bounds for multilinearization of the model using the
projection method were determined with a load up to
150 % and 40 nodes. This was assumed to generate a
higher accuracy at the nominal operation point. Due
to limited space, the parameter tensors of the multi-
linear model of the electrolyzer are not shown here.
3.2 Electrolyzer Controller Model
Each electrolyzer stack has an individual integral
feedback controller, which is tracking the error of the
Multilinear Modeling and Simulation of a Multi-stack PEM Electrolyzer with Degradation for Control Concept Comparison
55
power reference given by the main multi-stack con-
troller and the current power of the stack, see Figure 2.
A key feature of this controller is the multilinear term
that calculates the current stack power. Thus the con-
troller can not be represented as a linear system but as
an MTI system. The stack controller can be expressed
in CP representation as follows,
F
ctrl
=
"
1 0
0 1
,
0 1
1 0
,
1 0
0 1
,
−K
I
K
I
T
#
,
(15a)
G
ctrl
=
0
1
,
1
0
,
1
0
,
1
, (15b)
where K
I
= −1.28e−4 is the gain for the integrator.
3.3 Degradation Model
The current density, temperature, and pressure are
factors that affect the PEM membrane electrode as-
sembly (MEA) degradation mechanisms. Some of
these mechanisms are: thinning of the membrane, de-
composition of catalyst layer, and passivation of the
porous transport layer (PTL). The mechanisms are
caused by thermal and chemical stress, catalyst par-
ticle agglomeration at high temperature, dissolving
of catalyst particles at high current densities, poison-
ing by metallic species, and oxidation of metals (Bahr
et al., 2020). Separating the individual effects of each
mechanism is very challenging. The study (Rakousky
et al., 2017) reports degradation rates under different
current densities, discovering catalyst degradation on
the anode and increase of contact resistance at the ti-
tanium PTL as the two main degradation causes. In
(Frensch et al., 2019) degradation rates under constant
current and three different dynamic profiles are stud-
ied, concluding that anode catalyst degradation plays
a minor role compared to ohmic resistance change.
In (Bahr et al., 2020) a neural network application to
describe the degradation rate is developed, by apply-
ing experimental results of accelerated aging tests to
a data trained model. The study reports degradation
rates according to current density and can be further
developed with a broader database and under differ-
ent temperature and pressure conditions. However,
such a data-based model has no insight into changes
of electrochemical parameters and rely on the exper-
imental data. While predominant mechanisms have
been investigated, up to date there is still no model
for the description of aging due to fluctuant operation
of PEM electrolysis.
In addition, stacks of an mELY system degradate
at different rates according to the operation condi-
tions. Therefore, the electrochemical model param-
eter of each stack can vary. As stated before, there
are no generic phenomenological degradation models
for PEM electrolyzers published, that can represent
the influence on partial or dynamic load, as well as
start-stop events. Nevertheless, for this work it is not
essential to apply a degradation model that describes
the electrochemical processes in detail. However, it
will be demonstrated, how the degradation model can
be integrated into the mELY system. The degrada-
tion model in this work is therefore to be considered
as an estimate. It cannot be validated, as data over
years of operation, even with accelerated aging tests,
would be needed, which are currently non-existing.
The combination of models establishes a basis to in-
clude more sophisticated degradation models to be
developed later on.
The first assumption for the model is that
the degradation only affects the membrane resis-
tance (ohmic overpotential), and therefore just one
electrochemical parameter. This is based on the find-
ings of (Rakousky et al., 2017) and (Frensch et al.,
2019) mentioned above, as well as on own experi-
mental work, which is not published yet. To describe
the variation of resistance, a total voltage drop rate,
according to nominal operation time, is assumed. In
(Buttler and Spliethoff, 2018) a rate of 4to8 µV h
−1
is
given, while 7 µV h
−1
total degradation rate is given
by (Kosonen et al., 2016). In this case 7 µV h
−1
degra-
dation rate at nominal load is used as base assump-
tion. The overall degradation is fitted to the mem-
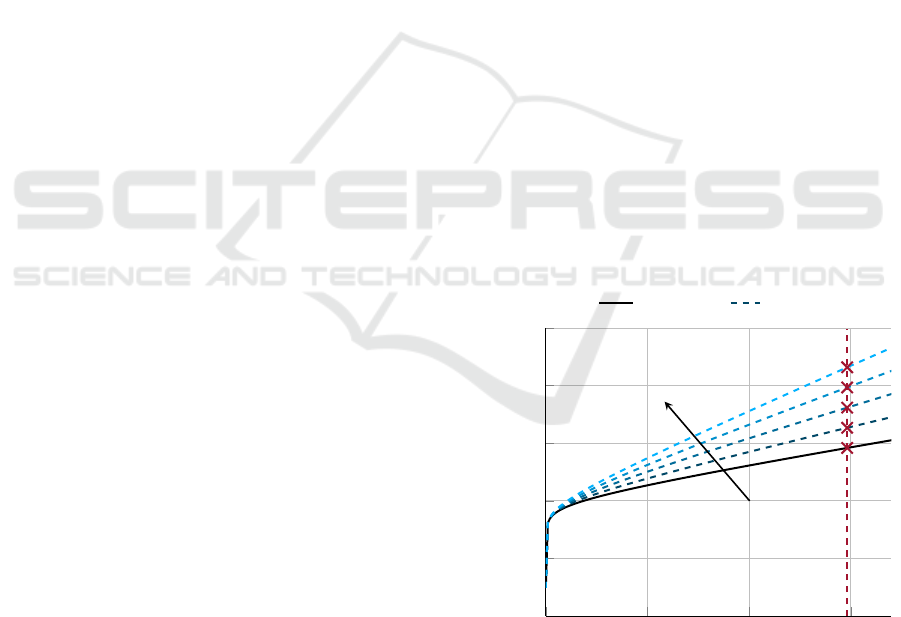
brane resistance as displayed in Figure 1.
0
0.5
1
1.5
1.2
1.4
1.6
1.8
2
2.2
Current density in A/cm
2
Cell voltage in V
begin of life degraded
time
Figure 1: IV-curve fitted to total degradation at nominal
load.
The single cell starting IV-curve (BoL) in Fig-
ure 1, which is not yet affected by degrada-
tion, is calculated by the base PEM electrolyzer
model from (Espinosa-L
´
opez et al., 2018) at 60
◦
C
SIMULTECH 2022 - 12th International Conference on Simulation and Modeling Methodologies, Technologies and Applications
56
and 35 bar cathode pressure. The aging process
of 7µV h
−1
is displayed at 1.48 A cm
−2
(46 kW at no
degradation) for 10 years with 4000 full load hours
(FLH) operation per year. The assumption of 10
years is a conservative lifetime estimation of different
sources (Buttler and Spliethoff, 2018; IRENA, 2020;
Cihlar et al., 2020) and at 4000 FLH green hydro-
gen gets cost competitive to fossil fuel based hydro-
gen (Agora Energiewende and Guidehouse, 2021).
As the voltage increases over time, the slope of
the IV-curve changes, which can be fitted as displayed
in Figure 1. The fit was done by an optimization,
adjusting the slope of the IV-curve by changing r
d
,
until the degradation point was crossed. By this, the
values for r
d
until end of life (EoL) were estimated.
The deviation of the description of v
ohm
in (Espinosa-
L
´
opez et al., 2018) is implemented into the elec-
trolyzer model as
v
ohm
= (R
mem
+ r
d
)i
ely
. (16)
In the following, the degradation resistance could be
analyzed over time and fitted by a linear function,
with a slope f
1
equal to the degradation rate. For the
overall degradation model, the aging is assumed to be
in linear proportion to the input current with 0 % at
no load and 100 % of f
1
at nominal load. This leads
to the general ODE description of
dr
d
dt
= i
ely
f
1
. (17)
The model for the degradation is linear and can
therefore be formulated as eMTI model in CP repre-
sentation as
F
deg
=
1
0
,
0
1
, f
1
, (18a)
G
deg
=
1 0
0 1
,
0 1
1 0
,
1 0
0 1
. (18b)
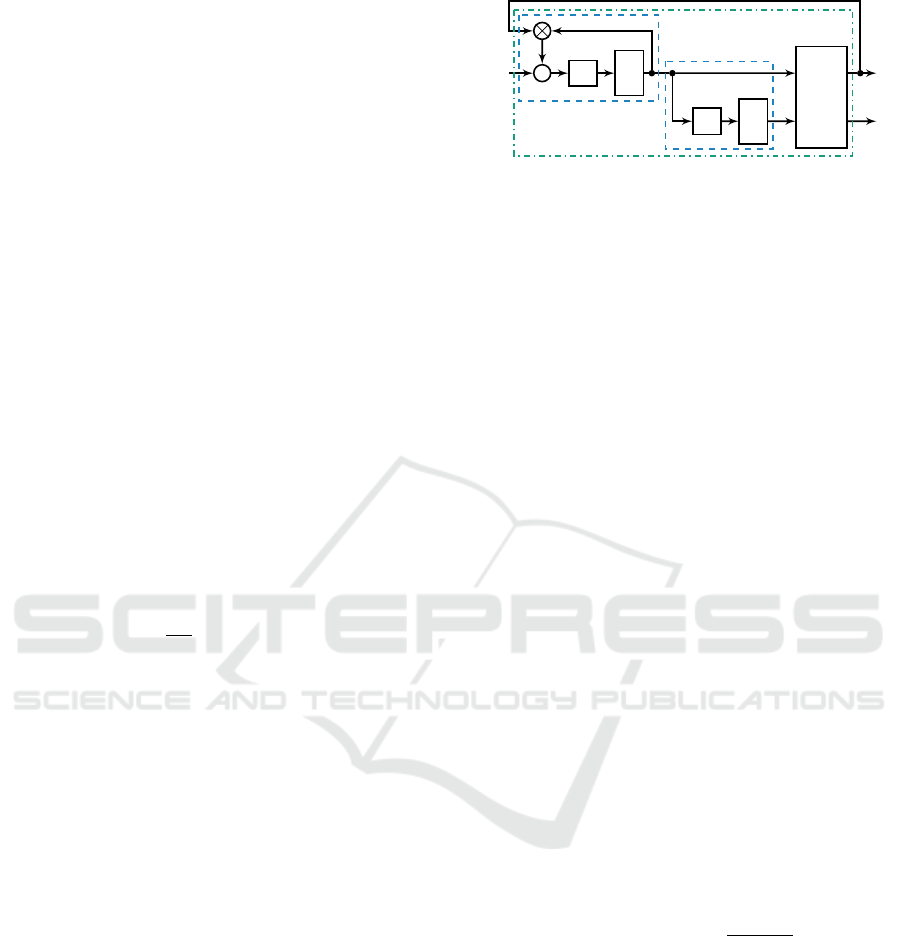
3.4 Series Composition of Models
The submodels will be connected in a series connec-
tion, which is described for eMTI models in (Licht-
enberg et al., 2022). The block diagram in Figure 2
shows the single input, multiple output (SIMO) degra-
dation and multiple input, single output (MISO) con-
troller system in composition with the electrolyzer
model. In further descriptions, the combination of the
three models will be referred to as sELY.
The upper bound on the rank of the sELY model
in CP form is r
F
= 12 and r
G
= 13. This can further
be reduced by using the alternating least squares algo-
rithm. A good approximation for the sELY was found
with r
F
= 6 and r
G
= 4, which reduces the memory
requirement by more than half.
p
ref
p
−
k
I
Z
ELY
i
f
1
Z
r
d
v
η
Controller
Degradation
sELY
Figure 2: Scheme of the series connection of the elec-
trolyzer controller, degradation and electrolyzer model.
4 MULTI-STACK
ELECTROLYZER
For the mELY simulation, the main controller is cre-
ating the power input vector p
ref
by distributing the
total wind power. The sELY models are composed
into one system and receive p
ref
as input. The power
distribution options and the composition method are
described in the following.
4.1 Main Controller Model
The main mELY controller is a high-level controller
with the principal objective of generating the power
set point for each individual stack
p
ref
=
p
ref
1
.
.
.
p
ref
N
, (19)
where p
ref
i
≥ 0 for all i ∈ [1, · · · , N] and N is the num-
ber of stacks in mELY. Then p
ref
is supplied as an
input to mELY as seen in Figure 3.
There are two feedforward operation modes. In
the base mode (mode 1 - equal), the wind power input
data p
wind
will be distributed equally to each stack,
resulting in the same power reference
p
ref
(t) = min
p
nom
,
p
wind
(t)
N
, (20)
for each unit. This is equivalent to a set of P con-
trollers with the same gain for each stack, and a sat-
uration to prevent values above the single stack nom-
inal power p
nom
. Here, the difference in the initial
conditions of the degradation model of each stack, is
expected to be the main driver for the overall mELY
performance.
In the second mode (mode 2 - max), the power is
distributed in such a way that the number of fully shut
off stacks is maximized, while still providing the to-
tal requested power with the remaining online stacks.
Multilinear Modeling and Simulation of a Multi-stack PEM Electrolyzer with Degradation for Control Concept Comparison
57

This can be formulated as a minimization problem
min
p
ref
N
∑
1
σ(p
ref
i
)r
d0
i
, (21)
s.t.
N
∑
1
p
ref
i
= min (p
wind
,N p
nom
), (21a)
where σ is the Heaviside step function and r
d0
i
is the
initial degradation of the i
th
stack.
This mode implies that almost all the remaining
online stacks will be operating at nominal power, ex-
cept when the total requested power is not a multiple
of the nominal stack power, in which case one stack
will need to take the remainder. In this strategy, the
stacks with the lowest initial degradation will be se-
lected first for nominal operation, such that the ones
with the most initial degradation are shut off to im-
prove the overall mELY efficiency.
p
wind
Controller
p
ref
sELY
1
p
ref
1
v
1
v
1
η
1
sELY
2
p
ref
2
v
2
v
2
η
2
sELY
N
p
ref
N
v
N
v
N
η
N
.
.
.
v
η
mELY
Figure 3: Multi-stack operation scheme.
4.2 Composition
For the connection of systems, three different op-
tions, i.e., series, parallel, and feedback have been in-
troduced in (Lichtenberg et al., 2022).
In the case of an mELY, all subsystems can be fed
with different amounts of power between minimum
and maximum load. They work independently, with-
out influencing each other, see Figure 3. Therefore,
the sELY eMTI models are not connected in series,
parallel or feedback, when considering an indepen-
dent power supply for each unit. Hence, the append
connector must be implemented for eMTI systems,
which is grouping the submodels by appending their
inputs and outputs (The MathWorks, Inc., 2022).
An eMTI model is fully defined with the nor-
malized factor matrices
e
F ∈ R
(n+m)×r
and the ma-
trix
e
F
φ
∈ R
n×r
. The append connector can then be
applied easily by having the factor matrices of the in-
dividual stacks on the diagonal for the mELY
e
F
mELY
=
e
F
x,1
0
x
··· · · · ··· ··· ·· · 0
x
0
x
.
.
.
.
.
.
.
.
.
.
.
.
.
.
.
.
.
.
.
.
.
.
.
.
0
x
··· 0
x
e
F
x,N
0
x
··· ··· 0
x
0
u
··· ··· 0
u
e
F
u,1
0
u
··· 0
u
.
.
.
.
.
.
.
.
.
.
.
.
.
.
.
.
.
.
.
.
.
.
.
.
0
u
0
u
··· ··· ··· ··· ··· 0
u
e
F
u,N
,
(22a)
e
F
φ,mELY
=
e
F
φ,1
0
φ
··· 0
φ
0
φ
.
.
.
.
.
.
.
.
.
.
.
.
.
.
.
.
.
.
0
φ
0
φ
··· 0
φ
e
F
φ,N
, (22b)
where
e
F
mELY
∈ R
N(n+m)×r
and
e
F
φ,mELY
∈ R
Nn×r
are
the factors of a system with N stacks and 0
x
∈ Z
n×r
=0
and 0
u
∈ Z
m×r
=0
and 0
φ
∈ 0
n×r
are zero matrices. For
each stack i the corresponding factors
e
F
x,i
,
e
F
u,i
,
and
e
F
φ,i
are generated as given by (8) and (9).
Remark: While doing the appending of
e
F
mELY
,
the order for the states and inputs must be maintained,
such that all factor matrices for the states
e
F
x,N
and
then the factor matrices for the inputs
e
F
u,N
are ap-
pended first. It can be seen, that these matrices con-
tain several zeros which are not needed to describe
the system behavior. Here, we can make use of the
sparsity to reduce memory requirements.
5 SIMULATION RESULTS
In this section, the simulation results of the eMTI
electrolyzer model individually and the mELY opera-
tion are presented.
5.1 Electrolyzer Individual Operation
To display the advantage of eMTI class, one elec-
trolyzer stack model is compared to LTI and non-
linear simulation in Figure 4. The whole opera-
tion range over the planned 10 years electrolyzer
lifetime is reproduced by cycling the input current
from 0to100 % of the nominal loads current at no
degradation (i
nom
= 429.87 A, for 46 kW stack
power with 0 % degradation). In a real operation the
cycling would happen much faster and arbitrarily, ac-
cording to renewable energy production. Neverthe-
SIMULTECH 2022 - 12th International Conference on Simulation and Modeling Methodologies, Technologies and Applications
58

less, for this demonstration the extended constant cur-
rent input operation periods allow seeing the effects
of degradation more clearly. The degradation is in
a range between 0 % at BoL and 100 % at the esti-
mated EoL, as described in subsection 3.3. As it can
be observed in Figure 4 (b), the model can also dis-
play operation after EoL. Overall, the output variables
of the eMTI model follow the nonlinear behavior over
time, with a stronger deviation at the lower bound-
aries of the operation range. This could be caused by
the increased range of the upper bounds to 150 % for
the multilinearization. The accuracy of the linear ap-
proximation is very good in the beginning at the lin-
earization point, but deviates at partial load, which is
getting worse over time.
The states were also analyzed, which are not dis-
played here for brevity. According to the degradation
caused rise of overpotentials, the change in tempera-
ture is increasing during fast load changes, which can
roughly be represented either by the LTI and eMTI
model. The requirement for standard Nafion
TM
mem-
branes to stay below 90
◦
C (Christoph Edler, 2018) is
fulfilled at any time.
5.2 Multi-stack Electrolyzer Operation
For the mELY operation of 100 stacks, wind data has
been used to produce a power profile. The wind data
of the year 2021 was taken from a measuring station
at 110 m height on the Fraunhofer IWES test field in
Bremerhaven, with a sample rate of 10 min. By us-
ing an Enercon E-115 2.500 (2.5 MW) power curve,
the wind data was translated to the power profile. Af-
terwards, it was scaled up to fit the 4.6 MW power
demand of the mELY at nominal load (0 % degrada-
tion). For both operation modes, the same power data
was used as input to the main controller. Also, the ini-
tial degradation value was set from 0to50 % linearly
so that the 1
st
stack (sELY
1
) is not degraded at the
beginning and the 100
th
(sELY
100
) stack is degraded
by 50 %. In Table 1, the mean electrolyzer efficiency
over the whole year is compared. If p
ref
= 0, the ef-
ficiency value is not considered for the mean value
calculation. The degradation gain of the entire plant
in Table 1 is a mean value of all stacks.
Table 1: Comparison of two control modes for the power
distribution of a 100 stack mELY operation (one year).
Mode η
ely,mean
Degradation
in % gain in %
1 - equal 86.78 9.61
2 - max 82.33 9.35
The mean efficiency of mode 1 is higher, as can be
observed for the 100 stacks in Figure 5. Since mode 1
results into long periods of partial load operation this
behavior is reasonable. This can also be the reason
for the increased efficiency of sELY
86
and sELY
100
in
mode 2. The mean plant degradation gain is 0.26 %
less for mode 2. Theoretically, with the linear degra-
dation model and the same overall current input, the
degradation gain should be the same for both modes.
The deviation can result from the inaccuracy of the
controller and degradation models. In Figure 6, dif-
ferent aging rates can be observed for sELY
1
, sELY
50
and sELY
100
, showing a correlation of the degradation
slope and the individual stack load.
To perform the simulation an S-Function was im-
plemented using a MATLAB-file. For the simulation
settings, a fixed time-step was used with automated
solver detection and T
s
= 36.9 s, which represents
the fastest dynamics of the electrolyzer. The overall
run time of the simulation was 2.81 h using MAT-
LAB R2021b. The simulations are performed on a
computer equipped with an Intel®Core™ i7-9850H
CPU @ 2.60GHz and 16 GB RAM.
6 DISCUSSION
In this section, the eMTI model accuracy and
the mELY simulation results are evaluated.
6.1 Multilinear Model Accuracy
Regarding the individual models for the electrolyzer
controller, degradation, and main controller, no mul-
tilinear approximation was needed, since the systems
are either linear or multilinear right away. However,
when combining the submodels to the overall sELY
model, an approximation was performed to improve
computational time.
To generate the eMTI electrolyzer model approx-
imation, the projection method was used. Overall, re-
garding the electrolyzer model accuracy, the follow-
ing basic statements can be made:
• the eMTI model is more accurate than the LTI
model over the total operating range,
• the LTI model is exact at operational current with
no degradation (linearization point),
• the LTI model cannot handle model changes due
to degradation,
• the eMTI model accuracy is rated as sufficient for
this application.
For future improvements, a reasonable strategy would
be to re-linearize after a certain amount of time
Multilinear Modeling and Simulation of a Multi-stack PEM Electrolyzer with Degradation for Control Concept Comparison
59
0
100
200
300
400
500
(a)
current in A
0
25
50
75
100
125
(b)
degradation until EoL in %
0 2 4
6
8 10
70
75
80
85
90
95
100
t / years
(e)
efficiency in %
0 2 4
6
8 10
90
100
110
120
130
t / years
(d)
voltage in V
Nonlinear
LTI eMTI
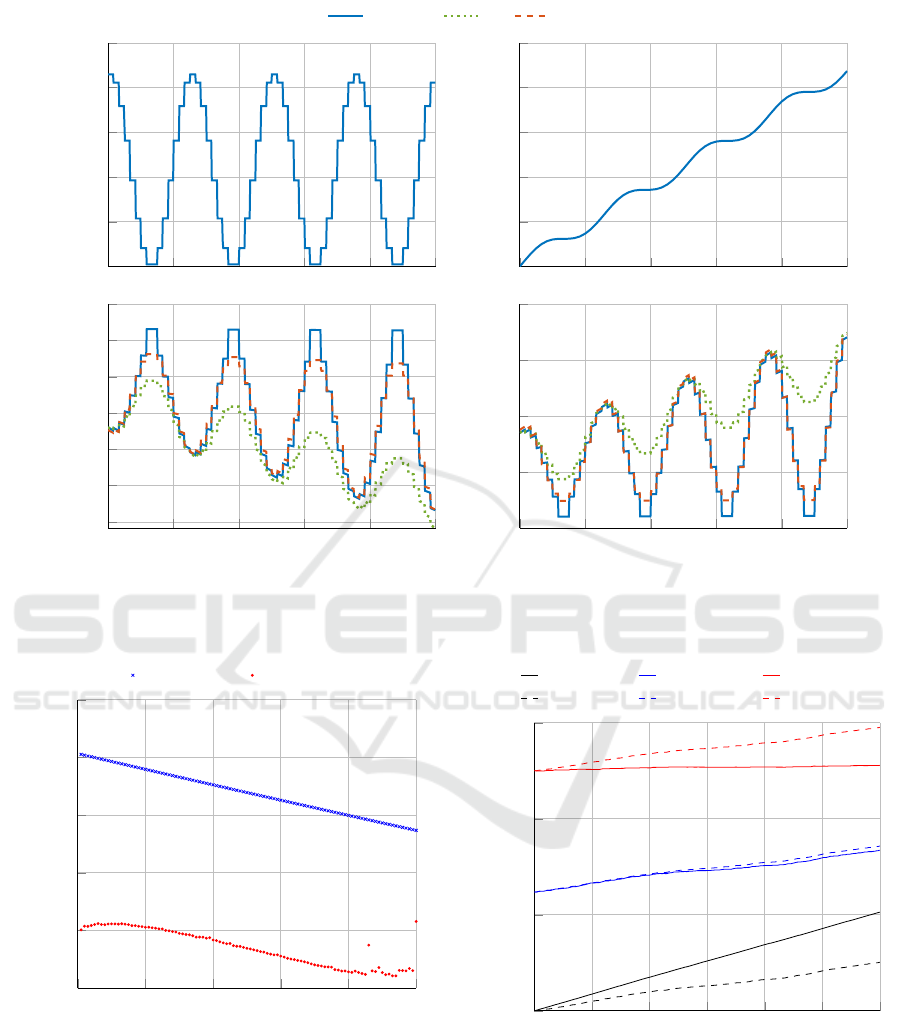
Figure 4: Individual electrolyzer operation for comparison of LTI, eMTI and nonlinear simulation.
0 20 40
60
80 100
0.8
0.82
0.84
0.86
0.88
0.9
stack number
mean efficiency in %
Mode 1 - equal Mode 2 - max
Figure 5: Mean values for the individual stack efficiency
over one year of operation.
(degradation), wherefore the LTI model stays more
accurate over time. Nevertheless, this would not make
up for low performance of the LTI model in partial
load. Therefore, a combination of LTI and eMTI rep-
resentation is considered optimal, which can even be
combined in a single MTI system, by switching from
0 2 4
6
8 10 12
0
20
40
60
time in month
degradation until EoL in %
sELY
1
max sELY
50
max sELY
100
max
sELY
1
equal sELY
50
equal sELY
100
equal
Figure 6: Comparison of degradation for 3 of 100 stacks
over one year of operation.
eMTI to LTI near the operational point. A different
option to enhance the accuracy of the eMTI represen-
tation would be to implement a weighting function to
the projection method, such that the approximation at
the nodes near nominal load is considered more im-
SIMULTECH 2022 - 12th International Conference on Simulation and Modeling Methodologies, Technologies and Applications
60

portant (Kruppa et al., 2014). This would at the same
time mean a reduced accuracy at the other nodes of
the grids, representing the operation range. Overall,
the eMTI electrolyzer model accuracy can be consid-
ered sufficient for this simulation task.
6.2 Multi-stack Electrolyzer Operation
The results in subsection 5.2 show a clear influence of
the main controller operation mode on the mELY per-
formance. With the same total power input and sim-
ply changing the power distribution to the stacks, the
efficiency can be enhanced. By including more com-
plex degradation phenomena also overall degradation
could be prevented. Therefore, this model provides
a base for a large optimization problem, with vari-
ous options for the cost function, e.g., the total eco-
nomic benefit of the plant from BoL to EoL or sus-
tainable hydrogen production. Therefore, the degra-
dation model needs to be developed further, since
there is no influence of, e.g., temperature, dynamic
load changes or start-stop events included yet. By
also considering the effect of load changes on aging,
it could be beneficial for specific stacks to buffer the
dynamic behavior.
The mELY model is built by appending the eMTI
models. This can be achieved by extending the ap-
pend function from MATLAB for the MTI class.
This process is considerably simpler than construct-
ing mELY with general nonlinear models in Simulink.
Modeling of the mELY in a single eMTI model
makes a further tensor decomposition possible, which
results in reduced memory and computational re-
sources for the simulation. However, the decompo-
sition method must be chosen carefully, as the struc-
tural zeros are removed due the factorization. This
can lead to inaccurate decompositions. An analysis of
appropriate decomposition methods will be part of fu-
ture work. In addition, implementing the S-Function
in C instead of using a MATLAB-file will increase the
simulation speed significantly.
7 CONCLUSIONS
In this paper, a modeling and simulation framework
for an mELY operation has been developed. For this
purpose, a single electrolyzer stack eMTI model, with
degradation input was thoroughly tested. The intro-
duced eMTI electrolyzer model has shown sufficient
accuracy for the application. The nonlinear behavior
and the dynamics of the mELY could be represented
by the eMTI model for the whole operation range.
However, modeling errors of the eMTI class could be
larger than for general nonlinear represention.
By including the append connector into the MTI
model class, the combination of 100 sELY units with
individual degradation and power controller model
could be done automatically. The performed model
reduction methods on the eMTI system were essen-
tial to reduce computational cost and generate output
data for one year. The output data of the mELY op-
eration showed that different control schemes have a
strong influence on the overall electrolyzer efficiency.
A similar effect can be observed in the single stack
level, where the degradation gain changes with the
load profile of each control concept.
In general, eMTI models are suitable to represent
energy systems with large number of states. This
enables the implementation of modern model-based
control methods. By this work, the MTI model class
has been further established for engineering applica-
tions. This is important since the promising MTI tools
are not part of general educational programs, or as
well-tried as linear or nonlinear tools yet.
For future work, an electrolyzer model with im-
proved accuracy, by either using a weighting func-
tion or a combination with an LTI model, will be pur-
sued. Also, there are numerous options for further
simulation performance enhancement, like the use
of different tensor decomposition methods for find-
ing low rank approximations or the implementation
of the S-Function in C. Prospectively, the submod-
els can be improved and easily exchanged. To up-
grade the degradation model, observers can be used
with accelerated stress test data, to find further corre-
lations between aging, current, temperature, pressure,
and load changes. For the electrolyzer efficiency, the
ancillary components can be considered, as well as
a minimum load range. Also, an option for over-
load could be included, with consideration of heat and
hydrogen flow management limitations. This can be
implemented in a main advanced feedback controller
model. By considering the degradation state and ef-
ficiency feedback, the main controller could perform
a multi-criteria optimization. Overall, this modeling
approach sets the base for various further develop-
ments, while also serving as a controller test bench.
Future studies are currently focused in mELY power
distribution operation schemes, which can be imple-
mented by electrolyzer operators for a larger return of
invest and plant lifetime.
ACKNOWLEDGEMENTS
This work was partly supported by the Free and
Hanseatic City of Hamburg and by the project
Multilinear Modeling and Simulation of a Multi-stack PEM Electrolyzer with Degradation for Control Concept Comparison
61

SONDE of the Federal Ministry of Education and Re-
search, Germany (Grant-No.: 13FH144PA8).
REFERENCES
Agora Energiewende and Guidehouse (2021). Making re-
newable hydrogen cost-competitive: Policy instru-
ments for supporting green H
2
.
Bahr, M., Gusak, A., Stypka, S., and Oberschachtsiek, B.
(2020). Artificial neural networks for aging simula-
tion of electrolysis stacks. Chemie Ingenieur Technik,
92(10):1610–1617.
Bro, R. and Kiers, H. A. (2003). A new efficient method
for determining the number of components in parafac
models. Journal of Chemometrics: A Journal of the
Chemometrics Society, 17(5):274–286.
Buttler, A. and Spliethoff, H. (2018). Current status of water
electrolysis for energy storage, grid balancing and sec-
tor coupling via power-to-gas and power-to-liquids: A
review. Renewable and Sustainable Energy Reviews,
82:2440–2454.
Christoph Edler (2018). Untersuchung der Einsatz-
moeglichkeiten von Hochleistungselektrolyseuren
fuer Netzdienstleistungen. diploma thesis, TU Wien,
https://repositum.tuwien.at/handle/20.500.12708/
7708.
Cihlar, J., Villar Lejarreta, A., Wang, A., Melgar, F., Jens,
J., and Rio, P. (2020). Hydrogen generation in eu-
rope: Overview of costs and key benefits. Luxem-
bourg. Publications Office of the European Union.
Enapter (2022). The AEM Multicore: Lowest-Cost Flexible
Hydrogen at Megawatt-Scale. https://www.enapter.
com/aem-multicore, Accessed: 28.02.2022.
Espinosa-L
´
opez, M., Darras, C., Poggi, P., Glises, R., Bau-
cour, P., Rakotondrainibe, A., Besse, S., and Serre-
Combe, P. (2018). Modelling and experimental val-
idation of a 46 kW PEM high pressure water elec-
trolyzer. Renewable Energy, 119:160–173.
Frensch, S. H., Fouda-Onana, F., Serre, G., Thoby, D.,
Araya, S. S., and Kær, S. K. (2019). Influence of
the operation mode on PEM water electrolysis degra-
dation. International Journal of Hydrogen Energy,
44(57):29889–29898.
Geitmann, S. (2022). HZwei - Das Magazin f
¨
ur Wasser-
stoff und Brennstoffzellen. Hydrogeit Verlag. Issue 1,
January 2022.
Green Hydrogen Systems (2022). HyProvide™: A-Series.
https://greenhydrogensystems.com/wp-content/
uploads/2021/02/A-Series-brochure-120421.pdf,
Accessed: 28.02.2022.
H-TEC SYSTEMS GmbH (2022). H-
TEC PEM-Elektrolyseur ME450/1400.
https://www.h-tec.com/produkte/detail/
h-tec-pem-elektrolyseur-me450-1400/me450-1400/,
Accessed: 17.03.2022.
Hornik, K., Stinchcombe, M., and White, H. (1989). Multi-
layer feedforward networks are universal approxima-
tors. Neural Networks, 2(5):359–366.
IRENA (2020). Green Hydrogen Cost Reduction: Scaling
up Electrolysers to Meet the 1.5
◦
C Climate Goal. In-
ternational Renewable Energy Agency. Abu Dhabi.
Kolda, T. G. (2006). Multilinear operators for higher-order
decompositions. Technical report, Citeseer.
Kopp, M., Coleman, D., Stiller, C., Scheffer, K., Aichinger,
J., and Scheppat, B. (2017). Energiepark Mainz:
Technical and economic analysis of the world-
wide largest Power-to-Gas plant with PEM electrol-
ysis. International Journal of Hydrogen Energy,
42(19):13311–13320.
Kosonen, A., Koponen, J., Huoman, K., Ahola, J., Ruuska-
nen, V., Ahonen, T., and Graf, T. (2016). Optimiza-
tion strategies of PEM electrolyser as part of solar
PV system. In 2016 18th European Conference on
Power Electronics and Applications (EPE’16 ECCE
Europe), pages 1–10. IEEE.
Kruppa, K. (2018). Multilinear Design of Decentralized
Controller Networks for Building Automation Sys-
tems. PhD thesis, HafenCity Universit
¨
at Hamburg.
Kruppa, K., Pangalos, G., and Lichtenberg, G. (2014). Mul-
tilinear approximation of nonlinear state space mod-
els. IFAC Proceedings Volumes, 47(3):9474–9479.
Lichtenberg, G., Pangalos, G., Cateriano Y
´
a
˜
nez, C., Luxa,
A., J
¨
ores, N., Schnelle, L., and Kaufmann, C. (2022).
Implicit multilinear modeling. at - Automatisierung-
stechnik, 70(1):13–30.
P. Ayivor, J. Torres, M.A.M.M. van der Meijden, R. van der
Pluijm, and B. Stouwie (2018). Modelling of large
size electrolyzer for electrical grid stability studies in
real time digital simulation. IEEE.
Pangalos, G., Eichler, A., and Lichtenberg, G. (2013). Ten-
sor systems - multilinear modeling and applications.
3rd International Conference on Simulation and Mod-
eling Methodologies, Technologies and Applications
(SIMULTECH-2013), pages 275–285.
Rakousky, C., Reimer, U., Wippermann, K., Kuhri, S.,
Carmo, M., Lueke, W., and Stolten, D. (2017). Poly-
mer electrolyte membrane water electrolysis: Re-
straining degradation in the presence of fluctuating
power. Journal of Power Sources, 342:38–47.
Schnelle, L., Lichtenberg, G., and Warnecke, C. (2022).
Using low-rank multilinear parameter identification
for anomaly detection of building systems. 11th
IFAC Symposium on Fault Detection, Supervision and
Safety for Technical Processes. Status: accepted.
The MathWorks, Inc. (2022). append - Group models
by appending their inputs and outputs. https://de.
mathworks.com/help/control/ref/lti.append.html, Ac-
cessed: 16.03.2022.
Zagorowska, M., Wu, O., Ottewill, J. R., Reble, M., and
Thornhill, N. F. (2020). A survey of models of degra-
dation for control applications. Annual Reviews in
Control, 50:150–173.
SIMULTECH 2022 - 12th International Conference on Simulation and Modeling Methodologies, Technologies and Applications
62
