
Consistent Research on Solar-Induced Chlorophyll Fluorescence and
Various Vegetation Parameters on Inner Mongolian Grassland
Yusi Zhang, Yuhai Bao
*
and Bayaer Tubuxin
School of Geographical Sciences, Inner Mongolia Normal University, Hohhot, 010022, China
Keywords: Chlorophyll, Vegetation Parameters, Ecological Carbon.
Abstract: Remote sensing observation of vegetation parameters is a major means of monitoring surface vegetation
growth and ecological carbon sequestration. This study adopted multi-years (2007, 2011, 2015 and 2018) of
MODIS observed NDVI, EVI and GPP, and SIF dataset (GOSIF) based on OCO-2 observation. Analysis of
spatial distribution and temporal variation of regional vegetation and the relationship between various
vegetation parameters and GPP was conducted over region of Inner Mongolian. Variation of vegetation
parameters on Inner Mongolia grassland is obvious, showing high/low values over the east/west area in
spatial, and high/low values during the summer/winter area in time. NDVI, EVI and SIF are well correlated
with GPP, and the fitting results in various methods indicates that the consistency between SIF and GPP is
optimal (r = 0.909; R
2
=0.902). The research shows that direct observation of SIF on Inner Mongolia Grassland
is an important parameter for monitoring vegetation carbon sequestration.
1 INTRODUCTION
Photosynthesis is plants’ basic metabolic process,
and energy and material source of plants growth (
Liu,
Wu, Zhou, Li, Wang, An, Li, 2017
). Sunlight-
induced chlorophyll fluorescence (SIF), as the signal
released from vegetation chlorophyll, has the
potential to directly quantified “actual
photosynthesis” (
Zhang, Wang, Qiu, Song, Zhang,
2019
) to monitor large-scale vegetation phenology
(
Zhang, Zhou, Meng, Zhang, Liu 2020
). Gross
Primary Productivity (GPP), as characterization of
plant photosynthesis and carbon sequestration, is
significant parameter of crop yield assessment and
estimate of ecological carbon sequestration (
Li,
Xiao, 2019)
.
With the rapid development of SIF monitoring
technology, the research on SIF satellite remote
sensing in wide area monitoring of vegetation appears
in an endless stream in recent years. The inversion of
global SIF remote sensing data has been achieved by
utilizing China’s Carbon Dioxide monitoring
satellite, (TanSat), Greenhouse Gases Observing
Satellite (GOSAT), Global Ozone Monitoring
Experiment-2 (GOME-2) and Scanning Imaging
Absorption SpectroMeter for Atmospheric
Chartography (SCIAMACHY), Orbiting Carbon
Observatory-2 (OCO-2) and other sensors (
Zhang,
Wang, Qiu, Song, Zhang, Li, Xiao, 2019, Zhang,
Zhou, Meng, Zhang, Liu, 2020)
. Satellite remote
sensing observation of vegetation index has been
applied to various fields (
Su-Jong Jeong, David
Schimel, Christian Frankenberg, Darren T.
Drewry, Joshua B. Fisher, Manish Verma, Joseph
A. Berry, Jung-Eun Lee, Joanna Joiner., 2017
), and
MODIS product data (like NDVI, EVI, GPP) can
monitor vegetation characteristics with large range
and long time sequence. Compared with vegetation
index, the cloud and soil background have little
influence on SIF products with satellite observation,
thus it is better to evaluate the photosynthesis of
plants (
Zhang, Wang, Qiu, Song, Zhang, 2019
).
Zhang Jingru (
Zhang, Zhou, Meng, Zhang, Liu
2020
) and others have probed into the reasons of
GOME-2 SIF data pixel time, lower resolution ratio
and coverage area affecting the correlation of GPP
and SIF by study on comparison of MODIS NDVI,
EVI, SIF and GPP of flux tower; Su-Jong Jeong and
others (
Su-Jong Jeong, David Schimel, Christian
Frankenberg, Darren T. Drewry, Joshua B. Fisher,
Manish Verma, Joseph A. Berry, Jung-Eun Lee,
Joanna Joiner., 2017
) evaluated large-scale seasonal
phenology and physiology of forest vegetation of
high-latitude in the northern in the period of spring
and autumn by using SIF, NDVI and GPP from 2009
to 2011; Xinchen Lu and others (
Lu, Cheng, Li,
Zhang, Y., Bao, Y. and Tubuxin, B.
Consistent Research on Solar-induced Chlorophyll Fluorescence and Various Vegetation Parameters on Inner Mongolian Grassland.
DOI: 10.5220/0011260800003443
In Proceedings of the 4th International Conference on Biomedical Engineering and Bioinformatics (ICBEB 2022), pages 707-715
ISBN: 978-989-758-595-1
Copyright
c
2022 by SCITEPRESS – Science and Technology Publications, Lda. All rights reserved
707
Chen, Sun, Ji, He, Wang, Li, Tang, 2018
) carried
out cross-platform inter-comparison to capture the
seasonal cycle of canopy photosynthesis by
phenological index (PI) and two SIF data sets of
OCO-2, GOME-2 and conventional Index (like
NDVI, EVI and leaf area index; it is found that the
performance of OCO-2 SIF in predicting GPP is
better than that of vegetation index and efficiency
model of light energy utilization in the global analysis
(
Li, 2018
); Petya K. E. Campbell and others
(
Campbell, Huemmrich, Middleton, Ward, Julitta,
Daughtry, Burkart, Russ, Kustas, 2019
) tested the
relation between SIF observation of space and time
scale and measurement of chlorophyll fluorescence at
leaf level (also referred to PSII yield, YII and ETR),
gross primary productivity of canopy (GPP) and
primary productivity; through research on the
influence of drought on vegetation growing by
utilizing vegetation index and SIF, it is believed that
SIF is likely to be an effective tool to evaluate the
influence of short-term drought on vegetation
productivity (
Tian, Wu, Liu, Leng, Yang, Zhao,
Shen, 2019, Liu, Yang, Zhou, Liu, Zhou, Li, Yang,
Han, Wu, 2018
).
The study adopts global SIF data set (GOSIF)
based on OCO-2 newly developed by Xing Li and
Jingfeng Xiao. Compared with coarse resolution of
SIF data directly collected from OCO-2, the data,
with high spatial and temporal resolution (0.05
degrees, 8 days), GOSIF has a better spatial
resolution, global continuous coverage and longer
time sequence (
Li, Xiao, 2019)
. Compared with
AVHRR data, MODIS NDVI and EVI data
(MOD13A1) with resolution of 500m and 16 days
based on special spatial bands specially used for
monitoring vegetation, includes improving
sensitivity to reflectance, atmospheric correction and
reducing geometric distortion (
Huete, Didan, Miura,
Rodriguez, Gao, Ferreira, 2002
). GPP adopts “semi-
empirical” GPP products obtained from MODIS data
(MOD17A2H). MODIS-GPP relatively well
represents ecosystem level GPP (
Running, Nemani,
Heinsch, Zhao, Reeves, Hashimoto, 2004
), among
which NDVI, GPP are calculated according to the
measured values of medium resolution imaging
spectrometer. Through the research on the relation
(
International Journal of Remote Sensing, 2020
) of
vegetation index(NDVI, EVI)in 2007, 2011, 2015
and 2018, Sunlight-induced Chlorophyll
Fluorescence (SIF) and gross primary growth (GPP),
the capacity of reflecting vegetation dynamic changes
of various indexes in study areas is explored to
provide reference for deeply understanding the
responding of Inner Mongolia Grassland to climate
change.
2 DATA AND METHOD
2.1 Study Area
The study area is located in Inner Mongolia
Autonomous Region of China (37°24´~53°23´N,
97°12´~126°04´E), short for “Inner Mongolia”,
situating at northern frontier of China, covering an
area of 12.3% of land area. Inner Mongolia
Autonomous Region totally includes 9 prefecture-
level cities and 3 leagues (Cities of Hohhot, Baotou,
Wuhai, Chifeng, Tongliao, Ordos, Hulunbeier, Bayan
Nur and Ulanqab; League of Xilingol, Alxa and
Hinggan). The whole area is dominated by temperate
continental climate with average annual temperature
3~6℃, and the annual temperature and average daily
temperature changes greatly, as well as the winter is
long and cold, summer is short and warm. The
precipitation is rare and unevenly distributed,
accounting for 60%~70% of annual precipitation
from June to August, and the annual precipitation
mainly converging in summer (
Li, 2017
). Land cover
is mainly grassland and desert. The grassland types in
spatial distribution is respectively desert grassland in
middle and west area and typical grassland in central
area as well as meadow grassland in east area of
Greater Khingan Range from west to east (
Mu,
2013
).
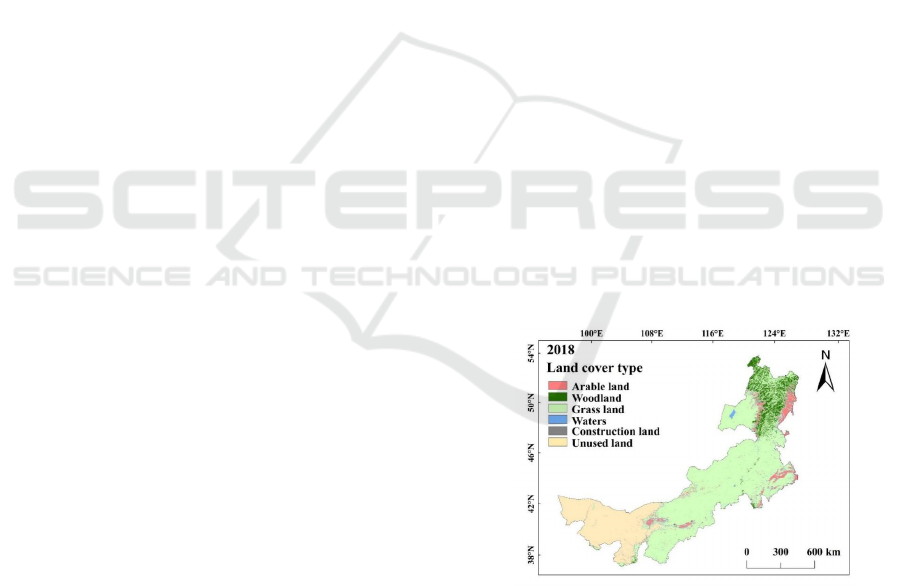
Figure 1: Spatial distribution of land types in study area.
2.2 Data Introduction
2.2.1 Normalized Difference Vegetation
Index (NDVI)
Normalized Difference Vegetation Index (NDVI), as
one of significant indexes of characterized vegetation
coverage level, has been widely applied to regional
ICBEB 2022 - The International Conference on Biomedical Engineering and Bioinformatics
708

scale and global scale to understand vegetation
growth condition (
Guo, Guo, 2021, Li, Zhou,
Wang, Shang, Yang, 2019
). It is also one of the
important indicators that characterize the degree of
vegetation coverage and reflect change
characteristics of vegetation growth (
Piao, Fang,
Zhou, Guo, Mark Henderson, Ji, Li, Tao 2003,
Mao, Zhu, Wang, Bartel., 2014, Sun, Guo, Yan,
Zhao 2010
).
2.2.2 Enhanced Vegetation Index (EVI)
Currently, enhanced Vegetation Index (EVI) and
NDVI is two frequently-used vegetation indexes to
reflect vegetation growth condition, vegetation
coverage degree, crop yield and density estimation.
By EVI index, NDVI can correct the problem of
atmospheric noise, soil background interference and
saturation (
Chen, Luo, Mo Weihua, Mo, Huang,
Ding, 2014, Wang, Liu 2003
), thus EVI not only
provides new ideas for the research on seasonal
change of vegetation with high coverage, but also
gives support for the research on vegetation with low
coverage (
Wang, Liu, Chen, Lin, 2006, Cheng,
Huang, Wang, 2005
).
2.2.3 Sunlight-induced Chlorophyll
Fluorescence (GOSIF)
Photosynthesis is a series of process of luminous
energy absorbed by plants absorbed, converted to
electricity, among which approximately 1% sunlight
energy captured by plants can released by
fluorescence mode with longer waves. SIF utilizes
oxygen existed in solar spectrum absorbing dark line
to perform fluorescence measurement, which shows
that it is less impacted by the surrounding background
such as soil and environment than other vegetation
indexes (
LIU, GUAN, PENG, et al, 2012
). The
merits of SIF method lie in its not needing of precise
pulsed and modulated fluorescence technology,
chlorophyll fluorescence can directly quantified
“actual photosynthesis” (
Rahimzadeh-Bajgiran P,
Bayaer T, Omasa K., 2017
), which is different from
the indexes of “potential photosynthesis” mainly
observed by “green degree”, like NDVI index. Since
satellite inversion of global scale was realized in
2011, SIF remote sensing technology continue to
make new contributions to the respects of gross
primary productivity of terrestrial ecosystem, global
carbon cycle monitoring, phenological and
vegetation stress monitoring (
Porcar-Castell A,
Tyystjarvi E, Atherton J, et al. 2014
).
2.2.4 Gross Primary Productivity (GPP)
Gross primary productivity is important components
(
Yan, Ma, Zhang, Li, Zhang, Wu, Wang, Wen,
2021
) of carbon cycle of terrestrial ecosystem, GPP
mainly evaluated by daily average of GPP (day)
(
Zhang, Mark A. Friedl, Crystal B. Schaaf. 2006
).
Zhang Zhaoying and others’ (
Zhang, Wang, Qiu,
Song, Zhang, 2019
) research results show that there
is a good indirect relation between SIF and sunlight
and effective radiation, which makes SIF can
effectively evaluate GPP in the grassland ecosystem
with vegetation productivity mainly decided by
chlorophyll content (
Guanter Luis, 2014
).
Table 1: Dataset from satellites observations used in this study.
Sensor Data name Period (year)
Spatial
Resolution
Temporal
Resolution
References
MODIS
MOD13A1-NDVI
2007/2011/2015/2018
500
m
16 da
y
sHuete et al.
(
2002
)
MOD13A1-EVI 500
m
16 days Liu Huiqing (1995)
MOD17A2H-GPP 1 k
m
8 da
y
s Runnin
g
et al.
(
2004
)
MCD12Q1-LUCC 2018 500
m
yearl
y
Huete et al. (2011)
OCO-2 GOSIF 2007/2011/2015/2018 0.05° 8 da
y
s Frankenber
g
et al.
(
2014
)
2.3 Method Introduction
2.3.1 Data Preprocessing
The paper use MODIS NDVI, EVI, GPP in 2007,
2011, 2015 and 2018 as well as land coverage
classification data products downloaded from NASA
(https://ladsweb.modaps.eosdis.nasa.gov). MODIS
NDVI, EVI (MOD13A1) data is synthetic image of
16d maximum value and the spatial resolution ration
is 500m; and the GPP data synthesized from the 8-
day maximum value of MODIS 1 km spatial
resolution ration were also used; as well as land
coverage classification data products MCD12Q1, and
the spatial resolution ration is 500m.
The study used the global SIF data set (GOSIF)
based on OCO-2 researched by Li Xing and others
Consistent Research on Solar-induced Chlorophyll Fluorescence and Various Vegetation Parameters on Inner Mongolian Grassland
709
(
Li, 2018
), downloaded from University of New
Hampshire
(http://globalecology.unh.edu/data/GOSIF.html).
In line with the batch processing and cutting of vector
in the study area, MODIS NDVI, EVI and GPP
adopts Maximum Value Composites (MVC) to
obtain annual NDVI, EVI, GPP value, which can
further eliminate environment disturbance of cloud,
atmosphere, snows and sun height angle (
Brent N.
Holben. 1986
). Calculate the average value of annual
NDVI, EVI and GPP to generate annual value of
NDVI, EVI and GPP of four successive years. The
drawing operation is performed after eliminating the
invalid value smaller than 0, and the invalid
background value.
MCD12Q1 data is the MODIS annual coverage
classification production with spatial resolution ratio
500m introduced by MODIS terrestrial research
group. Through downloading land coverage
classification data in 2018, the data matched with
spatial resolution ratio of MODIS NDVI and EVI is
generated after preprocessing (
Bao, Bao, Qin. Zhou,
Shiirev-Adiya. 2013
) of projection transform,
cutting, resample and category merging by HEG tool,
which mainly shows land coverage classification data
of parts of arable land, woodland, grassland, waters,
construction land and unused land.
2.3.2 Relevance Analysis
Relevance analysis amid four vegetation parameters
takes Pearson (linearity) correlation analysis into
consideration, and usually the relevant strength of
variations can be judged from value range. Formula
is as follows:
𝑟=
∑(
𝑥
−𝑥̅
)
(𝑦
−𝑦)
∑(
𝑥
−𝑥̅
)
∑(
𝑦
−𝑦
)
2.3.3 Regressive Analysis
The relevance among several indexes is evaluated by
multiple regressions of exponential, linear,
logarithmic, polynomial and power. Finally, result of
the best regression model is presented.
3 RESULTS AND DISCUSSION
3.1 Spatial Distribution of Vegetation
Parameter
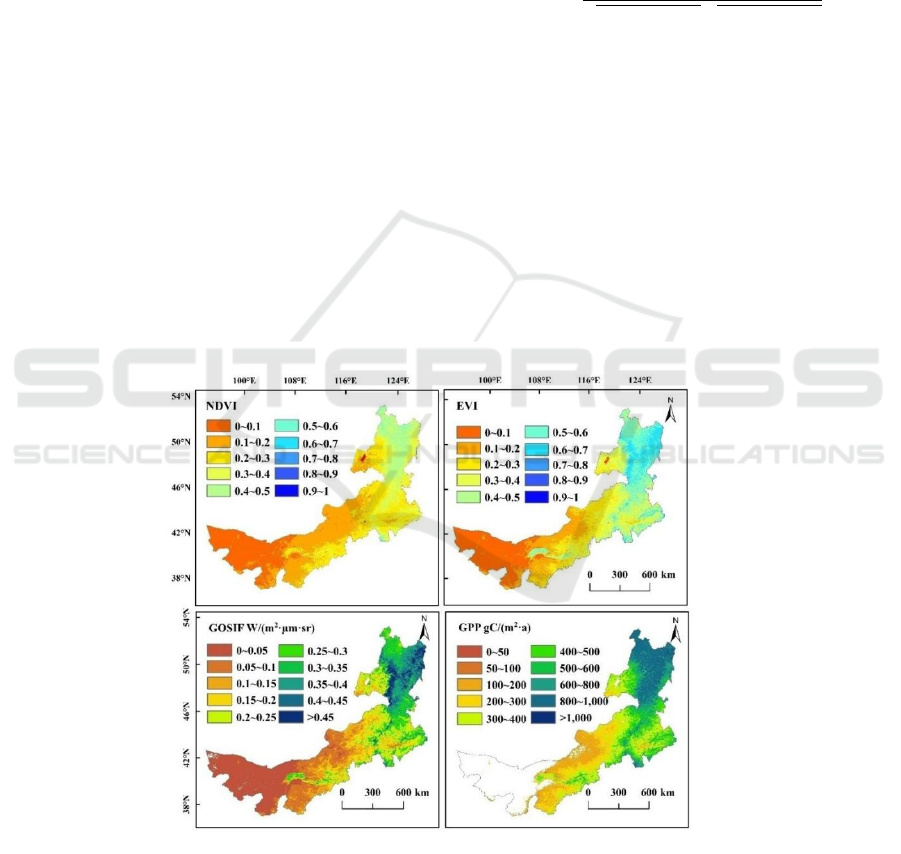
Figure 2: Spatial distribution of the mean value over the years of multiple vegetation parameters.
It can be seen that four vegetation parameters in
southwest area of Inner Mongolia are the lowest from
the EVI, NDVI, GOSIF and GPP in four years, and
four vegetation parameters in northeast area of Inner
Mongolia is the highest, as well as the highest value
of EVI, NDVI, GOSIF and GPP all appears in
Hulunbeier City.
ICBEB 2022 - The International Conference on Biomedical Engineering and Bioinformatics
710
The value range of NDVI in four years is -
0.544~0.714, whose mean value is 0.227±0.127; the
value range of EVI in four years is 0~0.832, whose
mean value is 0.315±0.192; the value range of GOSIF
in four years is 0~0.709, whose mean value is
0.224±0.182; the value range of GPP in four years is
45.025~1251.5, whose mean value is
463.771±249.259. On the whole, the value of NDVI,
EVI, GOSIF and GPP is higher than other 11 leagues
and cities, among which the value in Alxa league is
the smallest.
3.2 Time Sequence Distribution over
the Years of Vegetation Parameter
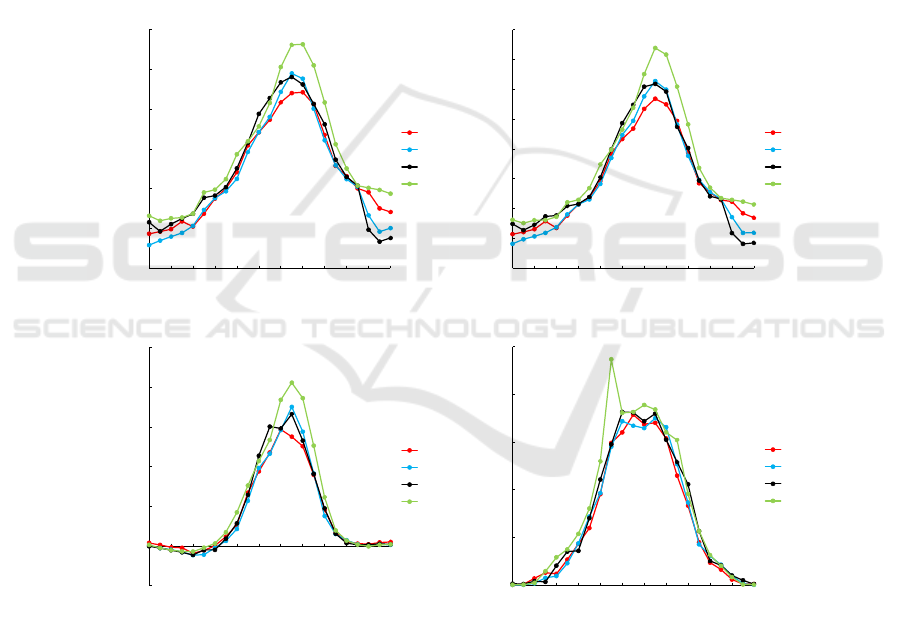
As shown in figure 3, annual variations of NDVI,
EVI, GOSIF and GPP of four years in Inner Mongolia
all presents in pattern of single peak, among which
the annual maximum value and minimum value of
NDVI in 2007, 2011, 2015 and 2018 is respectively
0.442 and 0.086, 0.490 and 0.0575, 0.481 and 0.115,
0.563 and 0.131; annual mean value is respectively
0.239±0.124, 0.213±0.120, 0.228±0.133,
0.253±0.138. The maximum value and minimum
value in 2007 and 2018 appear in first ten days of
August and January, the maximum value and
minimum value in 2011 and 2015 appears in last ten
days of July and first ten days of January.
Figure 3: Time sequence distribution of regional mean value of various vegetation parameters.
The maximum value and minimum value of EVI
in 2007, 2011 and 2015 is respectively 0.284, 0.0567
and 0.314, 0.0405, 0.309 and 0.0422, 0.369 and
0.0807. Annual mean value is respectively 0.146,
0.144, 0.150 and 0.173. Besides the minimum value
in 2015 appearing in the last ten days of December,
other maximum value and minimum value
respectively appears in the last ten days of July and
the first ten days of January.
The maximum value and minimum value of
GOSIF in 2007, 2011 and 2015 is respectively
1467.069 and -91.364, 1750.997 and -115.931,
1659.0154 and -113.343; 2056.518 and 70.839; all of
them appearing in the last ten days of July and the
Jan Feb Mar Apr May Jun Jul Aug Sep Oct Nov Dec
0
500
1000
1500
2000
2500
GPP gC/(m
2
·a)
Months
2007
2011
2015
2018
Jan Feb Mar Apr May Jun Jul Aug Sep Oct Nov Dec
0
0.05
0.1
0.15
0.2
0.25
0.3
0.35
0.4
EVI
Months
2007
2011
2015
2018
Jan Feb Mar Apr May Jun Jul Aug Sep Oct Nov Dec
0
0.1
0.2
0.3
0.4
0.5
0.6
NDVI
Months
2007
2011
2015
2018
Jan Feb Mar Apr May Jun Jul Aug Sep Oct Nov Dec
-500
0
500
1000
1500
2000
2500
GOSIF W/(m
2
·μm·sr)
Months
2007
2011
2015
2018
Consistent Research on Solar-induced Chlorophyll Fluorescence and Various Vegetation Parameters on Inner Mongolian Grassland
711
first ten days of March, annual mean value is
385.135, 383.493, 408.465 and 500.317.
The maximum value and minimum value of GPP
in 2007 is respectively 1786.456 and 0.820,
appearing in the last ten days of June and the first ten
days of January, and annual mean value is 663.551;
the maximum value and minimum value in 2011 is
respectively 1749.892 and 0, appearing in the last ten
days of July and the first ten days of January, and
annual mean value is 678.159; the maximum value
and minimum value in 2015 is respectively 1797.565
and 9.133, appearing in the last ten days of July and
December, and the annual mean value is 716.0637;
the maximum value and minimum value in 2018 is
respectively 1888.319 and 0.828, appearing in the
first ten days of July and the January, and the annual
mean value is 801.0210.
The vegetation parameters in Inner Mongolia
began to rapidly increase since the mid-month of
April, up to a higher value in the first ten days of June,
later slowly increasing to the highest value in the first
ten days of August. Then the grassland began to
become withered and yellow with declining
vegetation parameters, until in the late November it
returned to the spring and swiftly increased to the
previous level.
From the late November to the early April of the
second year, the pasture of grassland became withed
and yellow and the four vegetation parameters
became smaller with a litter changes affected by cold
temperature and snowing. The peak season of growth
for the grassland in Inner Mongolia is from July to
August that is the period with maximum value of
NDVI throughout the year.
3.3 Correlation Analysis of Vegetation
Index and GPP
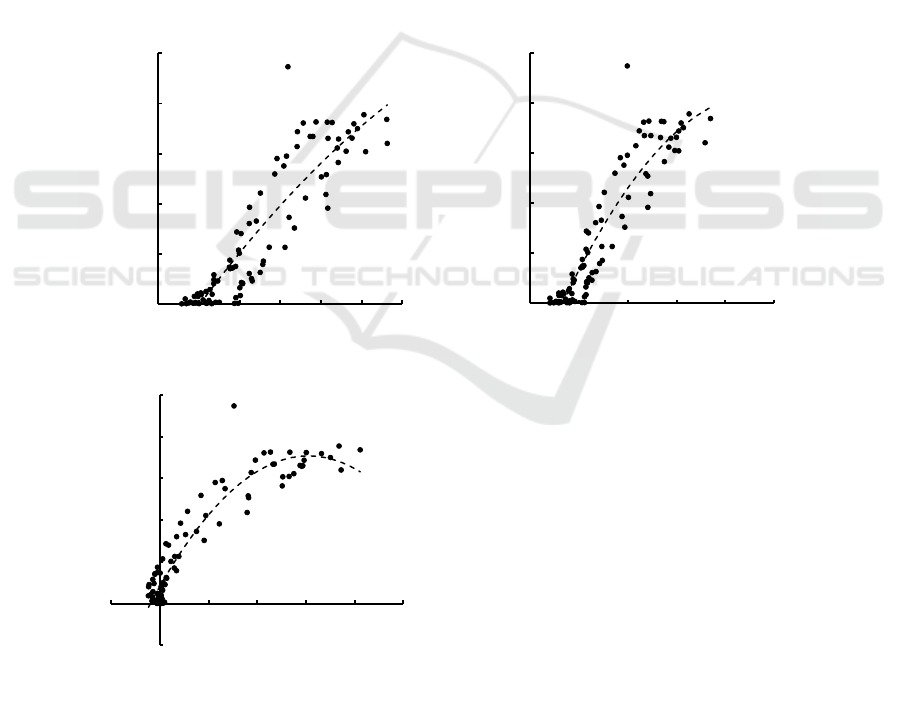
Figure 4: Correlation relation of GPP and vegetation index.
The correlation analysis among four vegetation
parameters is performed to show the figure of
polynomial regression models with the best
correlation relation, the rest of which is listed with
detail in the following table. It can be seen that the
correlation of GPP and GOSIF is the best, the R
2
is
y = -12726x
2
+ 12000x - 743.8
R² = 0.856
r=0.917
0
500
1000
1500
2000
2500
0 0.1 0.2 0.3 0.4 0.5
GPP[gC/(m
2
·a)]
EVI
y = -0.0007x
2
+ 2.0556x + 201.3
R² = 0.902
r=0.909
-500
0
500
1000
1500
2000
2500
-500 0 500 1000 1500 2000 2500
GPP[gC/(m
2
·a)]
GOSIF[W/(m
2
·μm·sr)]
y = -2512.5x
2
+ 5987.8x - 589.73
R² = 0.81
r=0.898
0
500
1000
1500
2000
2500
0 0.1 0.2 0.3 0.4 0.5 0.6
GPP[gC/(m
2
·a)]
NDVI
ICBEB 2022 - The International Conference on Biomedical Engineering and Bioinformatics
712

up to 0.902, r is equal to 0.909 with strong
correlation; the correlation of NDVI and EVI is the
best, the R
2
is up to 0.992, r is equal to 0.994 with
strong correlation; the correlation of GOSIF and EVI
is the best, the R
2
is up to 0.931, r is equal to 0.960
with strong correlation.
Table 2: Correlation between various vegetation indices and GPP and different fitting results.
Metho
d
NDVI EVI GOSIF
Correlation index 0.898 0.917 0.909
Linear fitting
y = 4549.4x - 433.32
R² = 0.806
y = 7322.0x - 419.62
R² = 0.84
y = 1.0421x + 266.31
R² = 0.826
Logarithmic
fittin
g
y = 1012.0ln(x) + 2269.7
R² = 0.749
y = 1069.2ln(x) + 2879.9
R² = 0.807
-
Polynomial fitting
y = -2512.5x
2
+ 5987.8x -
589.73
R² = 0.81
y = -12726x
2
+ 12000x -
743.80
R² = 0.856
y = -0.0007x
2
+ 2.0556x +
201.30
R² = 0.902
4 CONCLUSION
With annual changes of various vegetation
parameters, the peak season of grassland growth in
Inner Mongolia is from July to August, which can
represent the annual growth condition of Inner
Mongolia. Basically, the vegetation index of
grassland in Inner Mongolia began to increase since
April, the increasing speed is the fastest in May and
it is up to the peak value in August. Then the
vegetation activity of grassland began to drop with a
decreasing of vegetation index. Affected by climate
condition of snowing and low temperature, the
vegetation activity of grassland in Inner Mongolia is
extremely low from December to March.
Compared with annual change of NDVI, EVI,
GOSIF and GPP, four vegetation parameters in Inner
Mongolia Region presented a declining trend from
east to west with significant different of annual
change law, which is mainly affected by distribution
difference in Inner Mongolia Region (the east is
mainly grassland and the west is mainly desert). Inter
annual and intra annual changes trend of mean value
amid three vegetation parameters of NDVI, EVI and
GOSIF (2007, 2011, 2015, 2018) is close, which all
show photosynthetic carbon sequestration capacity of
vegetation in some degree (GPP).
The correlation contrast of several parameters in
four years show that there emerges good correlation
between NDVI, EVI, SIF and GPP (r=0.898, 0.917,
0.909). Various fitting method results show the effect
of polynomial fitting is better than logarithmic fitting
and the performance is a litter better in fitting, the
coefficient of determination R
2
up to 0.90. The result
shows that the SIF of the grassland in Inner Mongolia
is better to represent time sequence change of GPP
and reflects the change law of physiological
characteristics of vegetation. The quantity research
on SIF and GPP in different regions remains to be
further unfolded.
REFERENCES
A Huete,K Didan,T Miura,E.P Rodriguez,X Gao,L.G
Ferreira. Overview of the radiometric and biophysical
performance of the MODIS vegetation indices[J].
Remote Sensing of Environment, 2002,83(1).
Bao Gang, Bao Yuhai, Qin Zhihao. Zhou Yi, Shiirev-
Adiya. Vegetation Coverage Change and Its Seasonal
Response to Climate in Mongolian Plateau in Recent
10 Years [J]. Scientia Geographica Sinica, 2013,
33(05):613-621.
Brent N. Holben. Characteristics of maximum-value
composite images from temporal AVHRR data[J].
International Journal of Remote Sensing,1986,7(11).
Campbell, P.K.E.; Huemmrich, K.F.; Middleton, E.M.;
Ward, L.A.; Julitta, T.; Daughtry, C.S.T.; Burkart, A.;
Russ, A.L.; Kustas, W.P. Diurnal and Seasonal
Variations in Chlorophyll Fluorescence Associated
with Photosynthesis at Leaf and Canopy Scales.
Remote Sens. 2019, 11, 488.
https://doi.org/10.3390/rs11050488
Chen Yanli, Luo Yongming, Mo Weihua, Mo Jianfei,
Huang Yonglin, Ding Meihua. Difference Response of
MODIS NDVI and MODIS EVI to Climate Factors [J].
Journal of Natural Resources, 2014, 29(10):1802-1812.
Cheng Qian, Huang Jingfeng, Wang Renchao. Preliminary
Difference Analysis of MODIS and NOAA/AVHRR
Vegetation Index [J]. Bulletin of Science and
Technology, 2005(02):205-209.
Christian Frankenberg, Chris O'Dell, Joseph Berry, Luis
Guanter, Joanna Joiner, Philipp Köhler, Randy Pollock,
Thomas E. Taylor. Prospects for chlorophyll
fluorescence remote sensing from the Orbiting Carbon
Observatory-2[J]. Remote Sensing of Environment,
2014, 147.
Detecting regional GPP variations with statistically
downscaled solar-induced chlorophyll fluorescence
Consistent Research on Solar-induced Chlorophyll Fluorescence and Various Vegetation Parameters on Inner Mongolian Grassland
713

(SIF) based on GOME-2 and MODIS data[J].
International Journal of Remote Sensing,2020,41(23).
Feng Tian, Jianjun Wu, Leizhen Liu, Song Leng, Jianhua
Yang, Wenhui Zhao, Qiu Shen. Exceptional Drought
across Southeastern Australia Caused by Extreme Lack
of Precipitation and Its Impacts on NDVI and SIF in
2018 [J]. Remote Sensing,2019,12(1).
Guanter Luis, Zhang Yongguang, Jung Martin, Joiner
Joanna, Voigt Maximilian, Berry Joseph A,
Frankenberg Christian, Huete Alfredo R, Zarco-Tejada
Pablo, Lee Jung-Eun, Moran M Susan, Ponce-Campos
Guillermo, Beer Christian, Camps-Valls Gustavo,
Buchmann Nina, Gianelle Damiano, Klumpp Katja,
Cescatti Alessandro, Baker John M, Griffis Timothy J.
Global and time-resolved monitoring of crop
photosynthesis with chlorophyll fluorescence. [J].
Proceedings of the National Academy of Sciences of
the United States of America, 2014,111(14).
Guo Jinting, Guo Yu. Spatial-temporal Variation
Characteristics of NDVI in Inner Mongolia from 2000
to 2015 [J/OL]. Journal of Inner Mongolia Normal
University (Chinese edition of Natural Science): 1-
8[2021-05-08].
http://kns.cnki.net/kcms/detail/15.1049.N.20210425.0
951.002.html.
Huete A, Didan K, van Leeuwen W, et al. MODIS
vegetation indices[C]//Land Remote Sensing and
Global Environmental Change. New York: Springer,
2011: 579-602.
Huete, A., Didan, K., Miura, T., Rodriguez, E.P., Gao, X.,
Ferreira, L.G., 2002. Overview of the radiometric and
biophysical performance of the MODIS vegetation
indices. RemoteSens. Environ. 83, 195–213.
Leizhen Liu, Xi Yang, Hongkui Zhou, Shasha Liu, Lei
Zhou, Xiaohan Li, Jianhua Yang, Xinyi Han, Jianjun
Wu. Evaluating the utility of solar-induced chlorophyll
fluorescence for drought monitoring by comparison
with NDVI derived from wheat canopy[J]. Science of
the Total Environment,2018,625.
Li Kongyan. The Dilemma, Problems and
Countermeasures of Energy Conservation and
Emission Reduction in Inner Mongolia Autonomous
Region from the Perspective of Green Development
[D]. Inner Mongolia University, 2017.
Li Shuting, Zhou Yi, Wang Shixin, Shang Ming, Yang
Baolin. Spatial-temporal Variation of NDVI and Its
Response to Precipitation and Temperature in Inner
Mongolia from 2001 to 2015 [J]. Journal of Chinese
Academy of Sciences, 2019, 36(01):48-55.
Li Xing, Xiao Jingfeng, He Binbin, Altaf Arain M,
Beringer Jason, Desai Ankur R, Emmel Carmen,
Hollinger David Y, Krasnova Alisa, Mammarella Ivan,
Noe Steffen M, Ortiz Penélope Serrano, Rey-Sanchez
A Camilo, Rocha Adrian V, Varlagin Andrej. Solar-
induced chlorophyll fluorescence is strongly correlated
with terrestrial photosynthesis for a wide variety of
biomes: First global analysis based on OCO-2 and flux
tower observations. [J]. Global change biology, 2018,
24(9).
Li, X., Xiao, J. (2019) A global, 0.05-degree product of
solar-induced chlorophyll fluorescence derived from
OCO-2, MODIS, and reanalysis data. Remote Sensing,
11, 517. doi:10.3390/rs11050517.
Liu Huiqing, Huete A R. A Feedback Based Modi-fication
of the NDVI to Minimize Canopy Back-ground and
Atmospheric Noise [J]. IEEE Trans on Geoscience and
Remote Sensing, 1995(33): 457-465
Liu Leizhen, Wu Jianjun, Zhou Hongkui, Li Xiaohan,
Wang Qianfeng, An Xueli, Li Ruitao. Chlorophyll
Fluorescence and Its Research Progress in Water Stress
Monitoring [J]. Spectroscopy and Spectral Analysis
Spectroscopy Spectral Anal, 2017, 37 (09):2780-2787.
LIU Liangyun, GUAN Linlin, PENG Dailiang, et al (Liu
Liangyun, Guan Linlin, Peng Dailiang, etc,.). Journal
of Remote Sensing (Journal of Remote Sensing), 2012,
16(04):783-795.
Mao Fei, Zhu Lin, Wang Yongli, Bartel. Spatiotemporal
Variation Characteristics of Vegetation in Inner
Mongolia Based on Remote Sensing Data in Recent 30
Years 1[A]. Environmental Remote Sensing Branch of
China Association of Remote Sensing Applications.
Proceedings of the 18th China Environmental Remote
Sensing Application Technology Forum [C].
Environmental Remote Sensing Branch of China
Association of Remote Sensing Applications: China
Association for Remote Sensing Applications,
2014:13.
Mu Shaojie. Effects of Climate Change and LUCC on
Spatial-temporal Pattern and Evolution Trend of
Grassland Carbon Cycle in Inner Mongolia [D].
Nanjing University, 2013.
Porcar-Castell A, Tyystjarvi E, Atherton J, et al. 2014.
Journal of Experimental Botany. 65, 4065-4095.
Rahimzadeh-Bajgiran P, Bayaer T, Omasa K. 2017.
Remote Sensing. 599; doi:10.3390/rs9060599.
Running, S.W., Nemani, R.R., Heinsch, F.A., Zhao, M.,
Reeves, M., Hashimoto, H., 2004. Acontinuous
satellite-derived measure of global terrestrial primary
production. Biosci-ence 54, 547–560.
Shilong Piao, Jingyun Fang, Liming Zhou, Qinghua Guo,
Mark Henderson, Wei Ji, Yan Li, Shu Tao. Interannual
variations of monthly and seasonal normalized
difference vegetation index (NDVI) in China from
1982 to 1999 [J]. John Wiley & Sons, Ltd, 2003, 108
(D14).
STEVEN W. RUNNING, RAMAKRISHNA R. NEMANI,
FAITH ANN HEINSCH, MAOSHENG ZHAO,
MATT REEVES, HIROFUMI HASHIMOTO. A
Continuous Satellite-Derived Measure of Global
Terrestrial Primary Production[J].
BioScience,2004,54(6).
Su-Jong Jeong, David Schimel, Christian Frankenberg,
Darren T. Drewry, Joshua B. Fisher, Manish Verma,
Joseph A. Berry, Jung-Eun Lee, Joanna Joiner.
Application of satellite solar-induced chlorophyll
fluorescence to understanding large-scale variations in
vegetation phenology and function over northern high
latitude forests [J]. Remote Sensing of Environment,
2017,190.
ICBEB 2022 - The International Conference on Biomedical Engineering and Bioinformatics
714

Sun Yanling, Guo Peng, Yan Xiaodong, Zhao Tianbao.
Vegetation Coverage Change and Its Relationship with
Climate and Human Activities in Inner Mongolia [J].
Journal of Natural Resources, 2010, 25(03):407-414.
Wang Zhengxing, Liu Chuang, Chen Wenbo, Lin Xi.
Preliminary Comparison of MODIS Enhanced
Vegetation Index EVI and NDVI [J]. Journal of Wuhan
University (Information Science Edition),
2006(05):407-410+427.
Wang Zhengxing, Liu Chuang. HUETE Alfredo. Research
Progress on Vegetation Index: From AVHRR-NDVI to
MODIS-EVI [J]. Journal of Ecology, 2003(05): 979-
987.
Xiaoyang Zhang, Mark A. Friedl, Crystal B. Schaaf. Global
vegetation phenology from Moderate Resolution
Imaging Spectroradiometer (MODIS): Evaluation of
global patterns and comparison with in situ
measurements [J]. John Wiley & Sons, Ltd, 2006,
111(G4).
Xinchen Lu, Xiao Cheng, Xianglan Li, Jiquan Chen,
Minmin Sun, Ming Ji, Hong He, Siyu Wang, Sen Li,
Jianwu Tang. Seasonal patterns of canopy
photosynthesis captured by remotely sensed sun-
induced fluorescence and vegetation indexes in mid-to-
high latitude forests: A cross-platform comparison[J].
Science of the Total Environment,2018,644.
Yan Junxia, Ma Yanfei, Zhang Dongyun, Li Zechen, Zhang
Weike, Wu Zhenhua, Wang Hui, Wen Lihua. High-
Resolution Monitoring and Assessment of
Evapotranspiration and Gross Primary Production
Using Remote Sensing in a Typical Arid Region [J].
Land, 2021, 10(4).
Zhang Jingru, Zhou Xiaojuan, Meng Ping, Zhang Jinsong,
Liu Peirong. Phenological Comparison Research on
Mountain Plantations in North China Based on
Vegetation Index, Chlorophyll Fluorescence and
Carbon Flux [J]. Journal of Beijing Forestry University,
2020, 42 (11):17-26.
Zhang Zhaoying, Wang Songhan, Qiubo, Song Lian, Zhang
Yongguang. 2019. Remote Sensing Inversion of
Sunlight-induced Chlorophyll Fluorescence and Its
Application Progress in Carbon Cycle. Journal of
Remote Sensing, 23(1): 37–52
Zhang Zhaoying, Wang Songhan, Qiubo, Song Lian, Zhang
Yongguang. 2019. Remote Sensing Inversion of
Sunlight-induced Chlorophyll Fluorescence and Its
Application Progress in Carbon Cycle. Journal of
Remote Sensing, 2019, 23(01):37-52.
Consistent Research on Solar-induced Chlorophyll Fluorescence and Various Vegetation Parameters on Inner Mongolian Grassland
715
