
A Hybrid Approach for Product Classification
based on Image and Text Matching
Sebastian Bast, Christoph Brosch and Rolf Krieger
Institute for Software Systems, Trier University of Applied Sciences,
Environmental Campus Birkenfeld, Birkenfeld, Germany
Keywords:
Product Classification, Machine Learning, Convolutional Neural Networks, Image and Text Matching.
Abstract:
The classification of products generates a high effort for retail companies because products must be classified
manually in many cases. To optimize the product data creation process, methods for automating product
classification are necessary. An important component of product data records are digital product images. Due
to the latest developments in pattern recognition, these images can be used for product classification. Artificial
neural networks are already capable of classifying digital images with lower error rates than humans. But the
enormous variety of products and frequent changes in the product assortment are big challenges for current
methods for classifying product images automatically.
In this paper, we present a system that automatically classifies products based on their images and their textual
descriptions extracted from the images according to the Global Product Classification Standard (GPC) by
using machine learning methods to find similarities in image and text datasets. Our experiments show that the
manual effort required to classify product data can be significantly reduced by machine learning techniques.
1 INTRODUCTION
The amount of product information to be managed by
retailers has increased significantly in recent years. In
some companies, more than one thousand new prod-
uct data records are created and classified every day.
This process is often associated with high manual ef-
fort. A single record can contain several hundred at-
tributes, which must be edited by hand in many cases.
This time-consuming task is susceptible to errors and
produces high costs.
In retail, products are classified based on classi-
fication systems with predefined product categories
and hierarchies to model product relationships like the
Global Product Classification (GPC) (GS1, 2018). In
this hierarchical classification system each product is
assigned to a precisely defined segment, family, class
and brick code. In the Food/Beverage/Tobacco seg-
ment alone there are 25 different GPC families, 137
different GPC classes and 884 different GPC bricks
which must be distinguished. In addition, many retail-
ers use several classification systems that group prod-
ucts according to different criteria to support purchas-
ing and sales processes which makes product classifi-
cation a difficult task to solve.
In order to reduce manual activities, we developed
a system to classify a product based on its product
image by finding similar images in a labeled dataset
automatically. This paper describes the automated
classification process for product images via informa-
tion extraction and matching of the extracted informa-
tion with already classified images based on machine
learning. We also explain how we used textual de-
scriptions on product images to further improve clas-
sification performance. The primary use case we have
in mind is the automated classification of products to
support the user by eliminating manual tasks.
This paper is organized as follows: In section 2 we
give a brief review of the related work for product im-
age classification and feature extraction. In addition,
we name key problems of automated image classifi-
cation systems and in section 3 we describe our ap-
proach to solve them. We also discuss the architec-
ture of our system including the models and proce-
dures we used. The dataset is described in section 4.
In section 5 we present the results of our experiments.
We explain how we tuned parameters and how we ap-
plied Feature Engineering. In section 6 we give a brief
summary of our work and discuss the advantages and
disadvantages of our system. We also mention ideas
for future research.
Bast, S., Brosch, C. and Krieger, R.
A Hybrid Approach for Product Classification based on Image and Text Matching.
DOI: 10.5220/0011260200003269
In Proceedings of the 11th International Conference on Data Science, Technology and Applications (DATA 2022), pages 293-300
ISBN: 978-989-758-583-8; ISSN: 2184-285X
Copyright
c
2022 by SCITEPRESS – Science and Technology Publications, Lda. All rights reserved
293

2 RELATED WORK
Reliable product classification tools will become in-
creasingly important in the future as they increase the
level of automation in retail. There are various ap-
proaches for classifying product data. It can be clas-
sified based on unstructured data, structured data or
image data. Progress has been made in the field of
automated image classification due to developments
in machine learning, but there are several problems
which need to be solved.
Current issues are large-scale classification, data
limitations, intraclass variation and lack of flexibility
(Wei et al., 2020). Large scale classification is an is-
sue because an increasing number of classes results
in a decrease in accuracy. Deep learning approaches
require a large amount of labeled data, and labeling is
a very time-consuming task. In many cases, the sup-
ply of labeled data is limited. In case of product im-
ages, products from similar subcategories often have
only minor visual differences, which make them hard
to distinguish. In addition, the visual appearance of
products can change over time, which increases the
demand for a flexible solution. Convolutional neu-
ral networks are not flexible and have to be retrained
from time to time in order to recognize the frequent
changes in the product assortment.
A central task of systems for automated image
classification is the extraction of visual features which
are used to find patterns in images and to predict
classes. Conventional methods are algorithms like
SIFT, SURF, BRIEF and ORB (Karami et al., 2017)
where pattern recognition is based on features that
have been specified by humans. However, the man-
ual design of a reliable and robust system for pattern
recognition is a difficult task to solve, since there is
an enormous number of different patterns which must
be considered. Deep Learning is a machine learning
method for feature extraction based on artificial neu-
ral networks, which has led to great advances in the
field of image classification (LeCun et al., 2015). To-
day, neural networks are preferred over conventional
pattern recognition algorithms in many cases because
they solve certain image classification problems with
lower error rates than humans (Russakovsky et al.,
2015). By using Transfer Learning (Tan et al., 2018),
researchers can build on knowledge that has already
been learned, which significantly reduces the amount
of training data needed.
In our work, we used image matching for auto-
mated identification of similarities in product images.
This method detects similar patterns by matching vi-
sual image features and similar images are determined
by comparing their feature vectors (Szeliski, 2021).
It can be used in recommender systems to suggest
images with a similar visual appearance, in backward
image search engines to return similar images and in
systems for product image classification (Bast, 2021).
In addition to image-based approaches, text-based
classification is also promising (Chavaltada et al.,
2017; Allweyer et al., 2020). The text-based model
described in (Allweyer et al., 2020) can classify
a given product dataset with weighted f1-scores of
0.860 on GPC brick, 0.912 on GPC class and 0.938 on
GPC family level. Lowercasing and removing special
characters improve the result, while omitting numer-
als has a detrimental impact.
3 APPROACH AND MODELLING
In this section we describe our approach for product
classification based on product images and textual in-
formation extracted from these images. We predict
the GPC family, GPC class and GPC brick codes of
unclassified products by extracting and comparing the
image- and text-based features of their images to the
features of already classified images.
3.1 System Overview
Our system for classifying products with image
matching is based on two different phases: Prepro-
cessing and Classification (figure 1).
In the Preprocessing phase, visual features of all
product images are extracted as described in section
3.2. A feature vector is generated for every classi-
fied image and stored together with the corresponding
GPC-labels on brick, class and family level for later
use. This data provides the basis for all product clas-
sification tasks. Preprocessing only needs to be done
once.
The Classification of a new product is performed
by comparing the feature vector of its product image
to the vectors generated during Preprocessing. The
visual features of this image are matched with the vi-
sual features of already classified product images by
examining their similarity as described in section 3.4.
3.2 Feature Extraction
A key element of image classification is feature ex-
traction. Since images are distinguished based on
their features, a robust method is needed to reli-
ably extract them. We applied a convolutional neu-
ral network (CNN) with pretrained weights for fea-
ture extraction. The weights of the network have been
trained on the ImageNet dataset (Deng et al., 2009).
DATA 2022 - 11th International Conference on Data Science, Technology and Applications
294
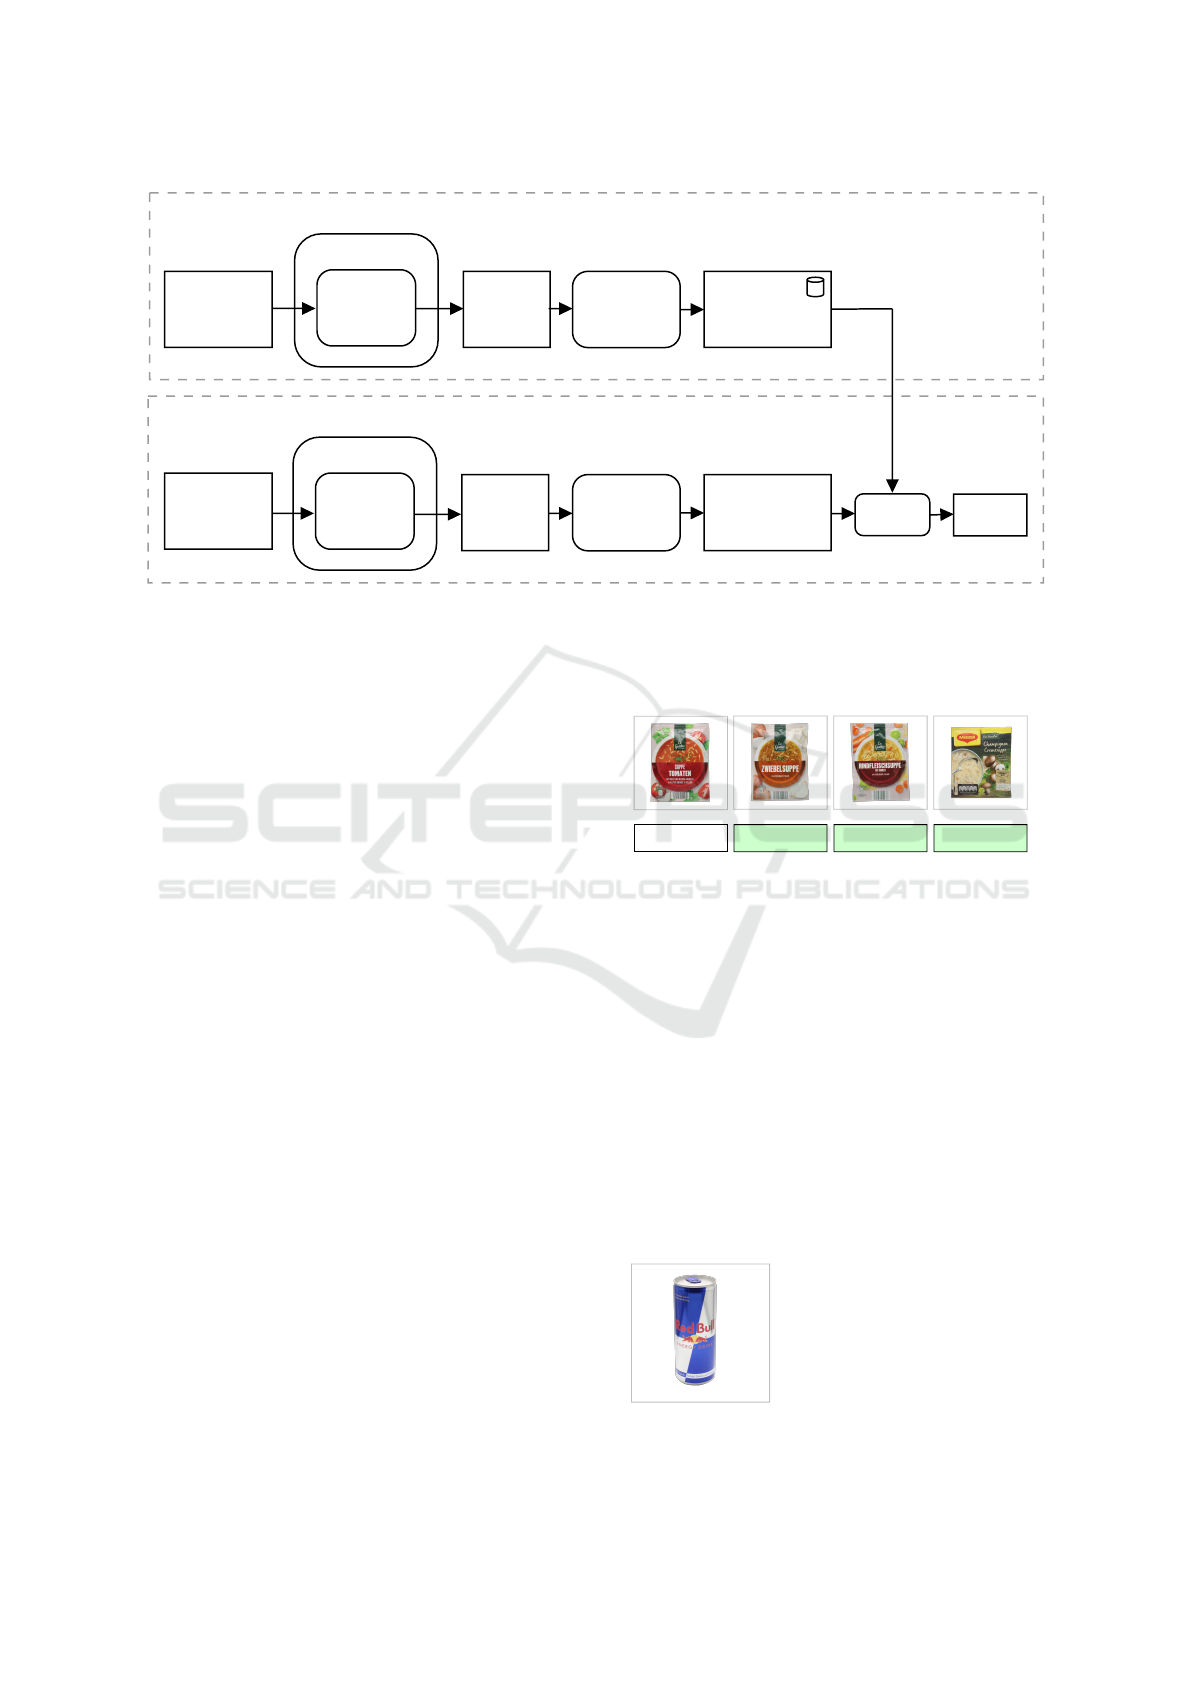
CNN
Feature
Extraction
Feature
Vectors
Feature
Reduction
kNN Class
CNN
Feature
Extraction
Feature
Vector
Feature
Reduction
Preprocessing
Classification
Classified
Images
Unclassified
Image
Reduced
Feature
Vectors
Reduced
Feature
Vector
Figure 1: System for Product Image Classification based on Image Matching.
This allowed us to use the knowledge already stored
in the weights of the network to solve our problem. In
section 5.4 we compared three different network ar-
chitectures by using every architecture for feature ex-
traction and by measuring classification performance
for each of the three feature sets. With ResNet50 (He
et al., 2015), InceptionV3 (Szegedy et al., 2016) and
VGG16 (Simonyan and Zisserman, 2015) we investi-
gated three different architectures, all of which have
been proven to be suitable for automated image clas-
sification in the past.
3.3 Feature Reduction
The network architectures we used produce a feature
vector of up to 2048 dimensions for a single image.
This results in a large amount of data and slows down
the classification process, because the extracted data
must be screened completely during classification. In
section 5.4 we used Principal Component Analysis
(Lever et al., 2017) for data reduction to speed up the
classification process and we measured the impact on
both runtime and classification performance.
3.4 Matching and Classification
We used a nearest neighbor approach for matching
and classification, which is performed by the kNN al-
gorithm (Mitchell, 1997) based on the feature vectors
of our product images. It detects the k feature vectors
with the highest similarity and uses them for classi-
fication. The target class is determined based on the
classes assigned to these detected vectors by a major-
ity vote. The class with the highest probability is then
assigned to the image. In order to achieve the best
possible classification result, we investigated the pa-
rameters of kNN in section 5.3. A result predicted by
kNN with a k=3 is illustrated in figure 2.
10000262
10000262 10000262 10000262
Figure 2: Unclassified product image (left) and three cor-
rectly predicted brick codes with the corresponding images.
3.5 Hybrid Approach
We combined the image-based classification ap-
proach with text-based classification and merged the
results to increase classification performance.
In the first step, we extracted the texts of all avail-
able product images with Optical Character Recogni-
tion (OCR) (Google, 2022). In a second step, we stan-
dardized the texts by removing special characters and
converting upper case characters into lower case char-
acters. We also split the extracted texts into blocks
and formed tokens (figure 3) to represent the text of a
product image as a feature vector.
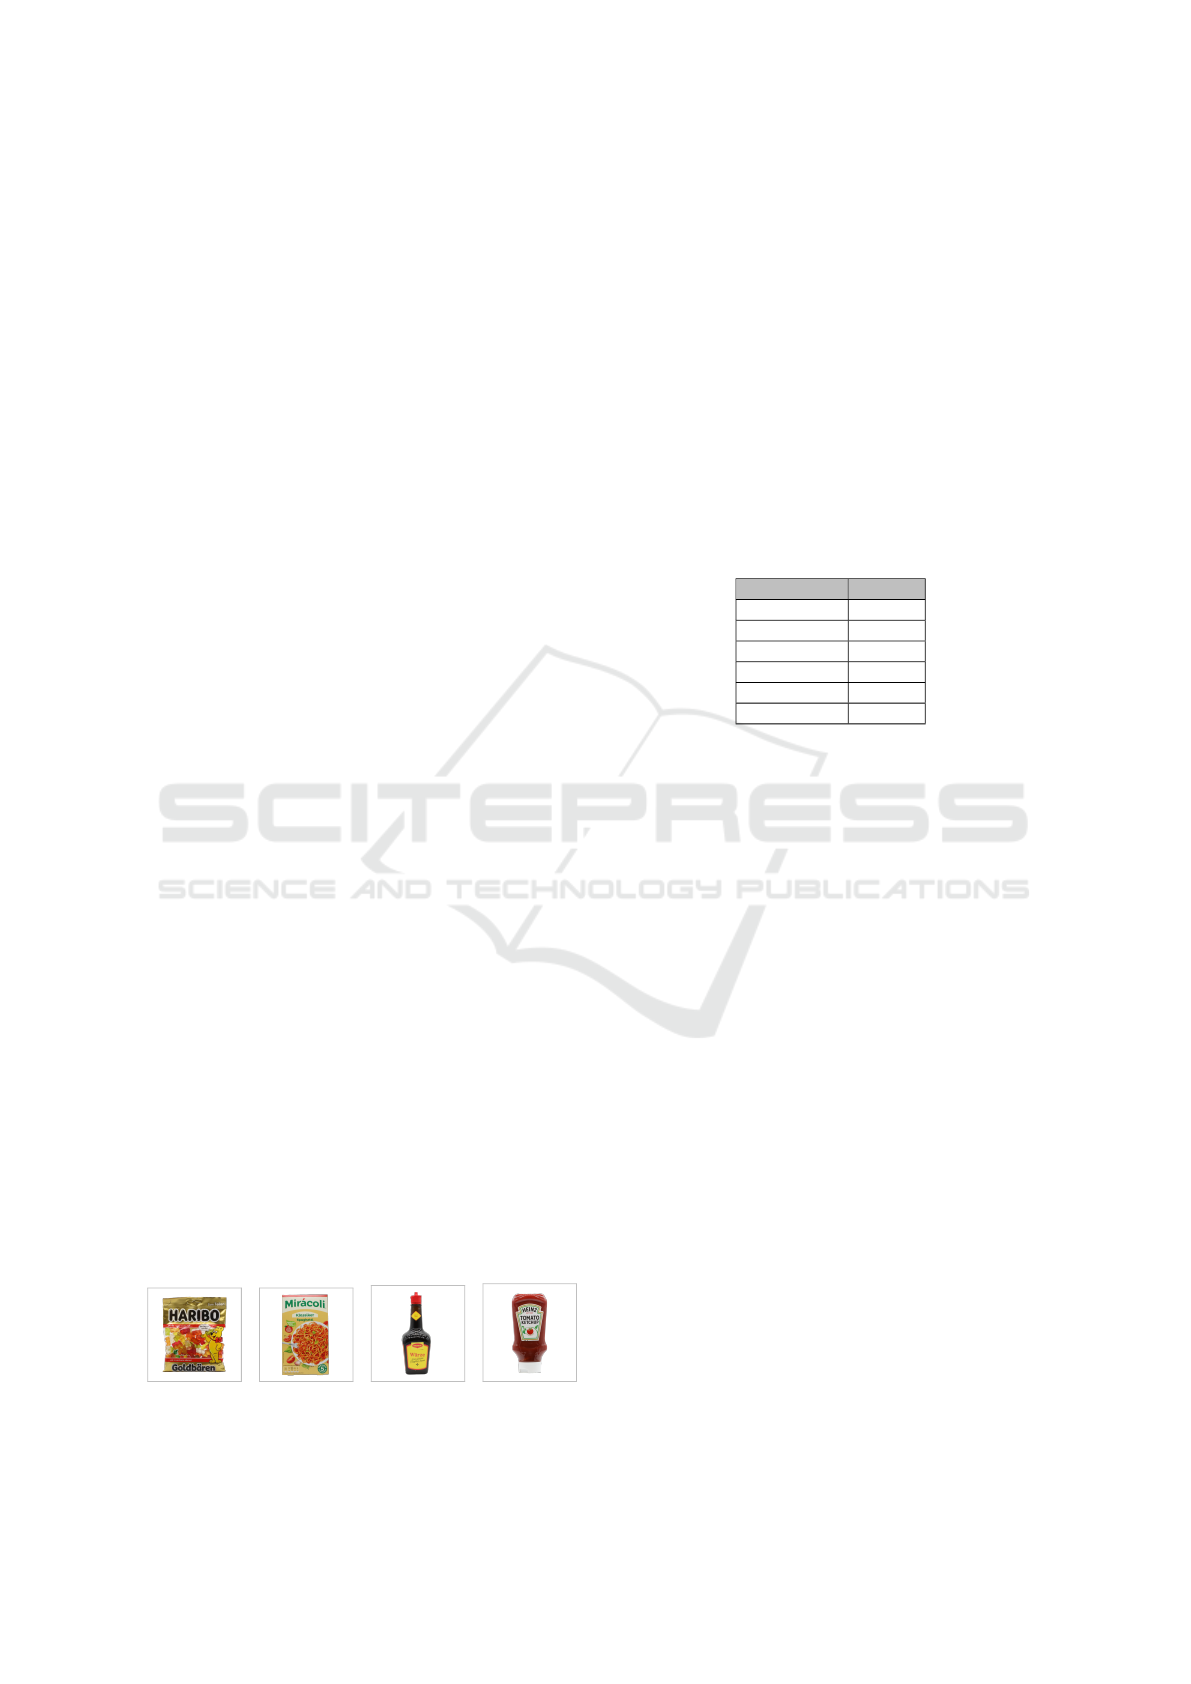
[’am besten eiskalt’,
’kohlens
¨
aurehaltig’,
’ed bul’,
’energy drink’,
’mit taurin’,
’belebt geist und k
¨
orper’]
Figure 3: Product image and its extracted german text.
A Hybrid Approach for Product Classification based on Image and Text Matching
295
In addition, we assigned the corresponding GPC
brick code to each text vector as a label for classifica-
tion. We used a nearest neighbor approach to classify
the texts, which is similar to the technique we used in
our image-based approach.
To classify a text we compared its feature vec-
tor with all feature vectors in the dataset and counted
matching words. Then, we selected the label of the
feature vector with the largest number of matches
and assigned the corresponding label. The follow-
ing listing shows the pseudo code of our heuristic
for determining the final class based on the two best
predictions of the image-based method (imgclass1,
imgclass2) and the text-based method (txtclass1,
txtclass2).
predicted_classes = [imgclass1, imgclass2,
txtclass1, txtclass2];
majority = most_common(predicted_classes);
minority = least_common(predicted_classes);
if(majority.frequency >= 2 &&
minority.frequency == 1)
predicted_class = majority.class;
else
predicted_class = imgclass1;
The class that occurs most frequently in the four
predicted classes is the final class prediction. In case
of a tie, the first proposed class of the image-based
approach is used as the final class, since in our exper-
iments the image-based method has a higher accuracy
than the text-based method (table 9).
4 PRODUCT DATASET
In order to evaluate the performance of our approach
we used product images and corresponding prod-
uct data records provided by a German retail com-
pany. The data is exclusively assigned to the seg-
ment Food/Beverage/Tobacco according to the Global
Product Classification (GPC). We cleaned the dataset
by removing duplicated images and images belong-
ing to bricks with less than 10 images. The final
dataset contains 69.256 product images and 36.624
corresponding product data records. Most of the im-
ages show a single product in front of a neutral back-
ground (figure 4).
Figure 4: Product Image Samples.
These front images belong to one of two differ-
ent image types according to the GS1 Product Image
Style Guide (GS1, 2019). The two image types are
called Functional Product Images and Primary Prod-
uct Images. Functional Product Images are captured
with no spatial depth of the product. Primary Product
Images show not only the height and width, but also
the depth of a product. The images in the dataset are
in PNG-format and have sizes of up to 1000 pixels
in width and height. The product images are not uni-
formly distributed among the classes (figure 5). Every
image in our dataset is assigned to exactly one brick,
one class and one family according to the GPC stan-
dard.
Table 1: Quantity of images, products, texts and labels in
the dataset we used in our experiments.
type quantity
images 69.256
texts 67.587
products 36.624
GPC-bricks 197
GPC-classes 73
GPC-families 20
5 EXPERIMENTS
We implemented the described approach based on the
scikit-learn library (scikit learn, 2022). In section 5.1
and 5.2, we describe the data preparation steps and
the performance metrics used in our paper. In section
5.3, we studied the parameters of the kNN algorithm
and their effects on the performance of the system to
determine the optimal configuration. In section 5.4,
we describe approaches to reduce the amount of data
and demonstrate the effects on classification accuracy
after reduction. In section 5.5, we evaluate the perfor-
mance of our system and present our results. In sec-
tion 5.6 we analyze the hybrid approach which com-
bines our image-based and text-based approach to in-
crease classification performance.
5.1 Data Preparation
All results of our experiments are based on the dataset
we described in section 4. In our experiments, we
used 20% of the dataset as a test set and classified it
according to the GPC standard by using the remain-
ing 80% of the dataset. While splitting our data, we
made sure, that each of the two sets contained approx-
imately the same percentage of samples of each class
as the total dataset. In every experiment, we used the
metrics described in section 5.2 to measure the classi-
fication performance of the system.
DATA 2022 - 11th International Conference on Data Science, Technology and Applications
296
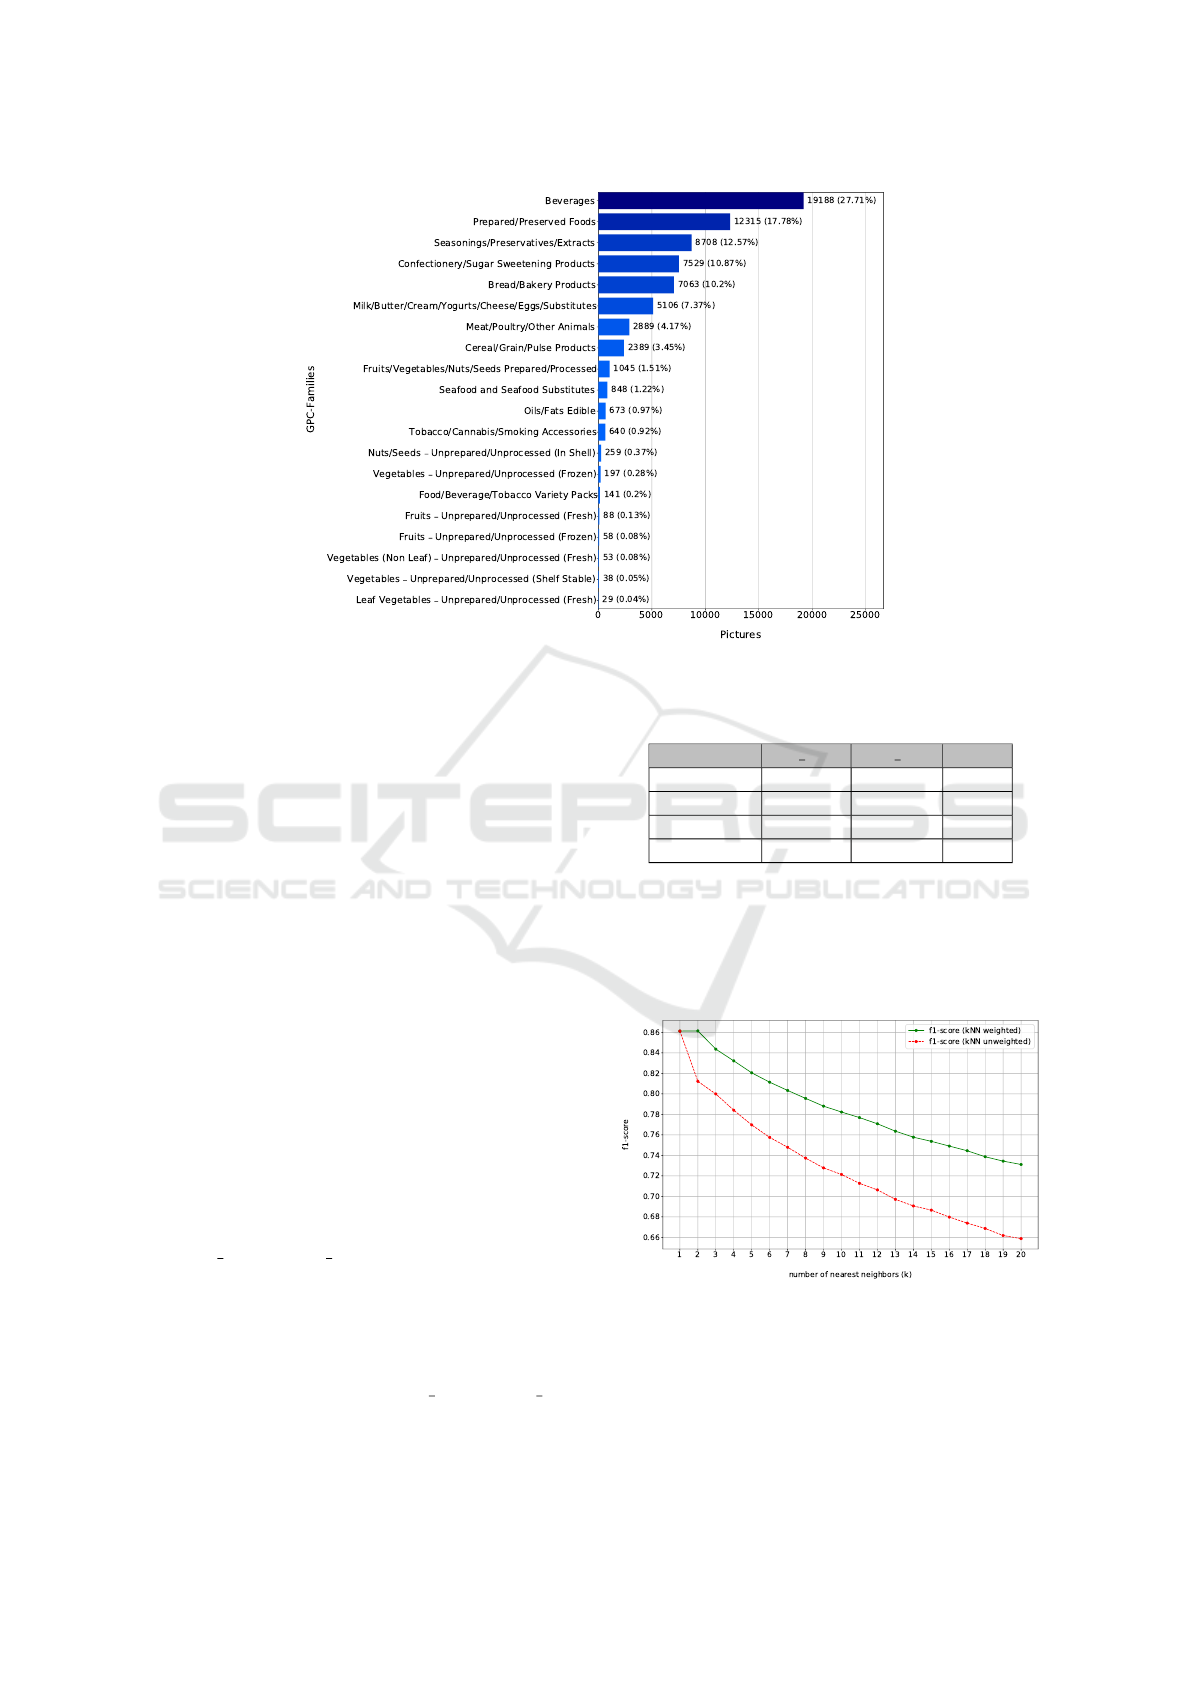
Figure 5: Distribution of images per GPC-family (69.256 images from 20 different families).
5.2 Performance Metrics
We evaluated the performance of our system by cal-
culating the metrics precision, recall and f1-score
(Sokolova and Lapalme, 2009) in a weighted form.
As mentioned before, our dataset is unbalanced be-
cause the number of images per class is different for
each class. So we calculated the metrics for each class
and their average, weighted by the number of true in-
stances for each class (scikit learn, 2022).
5.3 K-Nearest Neighbors Algorithm
In this experiment, we analyzed the configuration of
the knn algorithm in detail to find the best possible
configuration for classification.
5.3.1 Computation of Nearest Neighbors
We used an implementation of kNN (scikit learn,
2022) which provides three different methods for fast
computation of nearest neighbors. brute computes the
distances between all pairs of points in the dataset,
while kd tree and ball tree use an internal tree struc-
ture. In this section we compare their classification
performance and runtime. In our case all computa-
tional methods achieve the same classification perfor-
mance. But brute solves the classification problem
the fastest based on our dataset. The construction of
an internal data structure for the kd tree and ball tree
methods apparently takes so much time that it cannot
be made up for during the classification process.
Table 2: kNN computation performance comparison on
GPC brick level (k=2) and 20% of our data as test set.
metric kd tree ball tree brute
precision 0.864 0.864 0.864
recall 0.862 0.862 0.862
f1-score 0.861 0.861 0.861
runtime [s] 2118,12 1995,31 29,11
5.3.2 Distance Weights and k
In this section, the influence of k on the classifica-
tion accuracy of kNN is investigated by using up to
20 nearest neighbors for classification.
Figure 6: F1-score for weighted and unweighted kNN.
Based on our data, the system performs more ac-
curately with weighted nearest neighbor distances and
classification accuracy decreases the larger the value
of k becomes. The performance metrics show the
highest value when k is 2 and when distances are
A Hybrid Approach for Product Classification based on Image and Text Matching
297
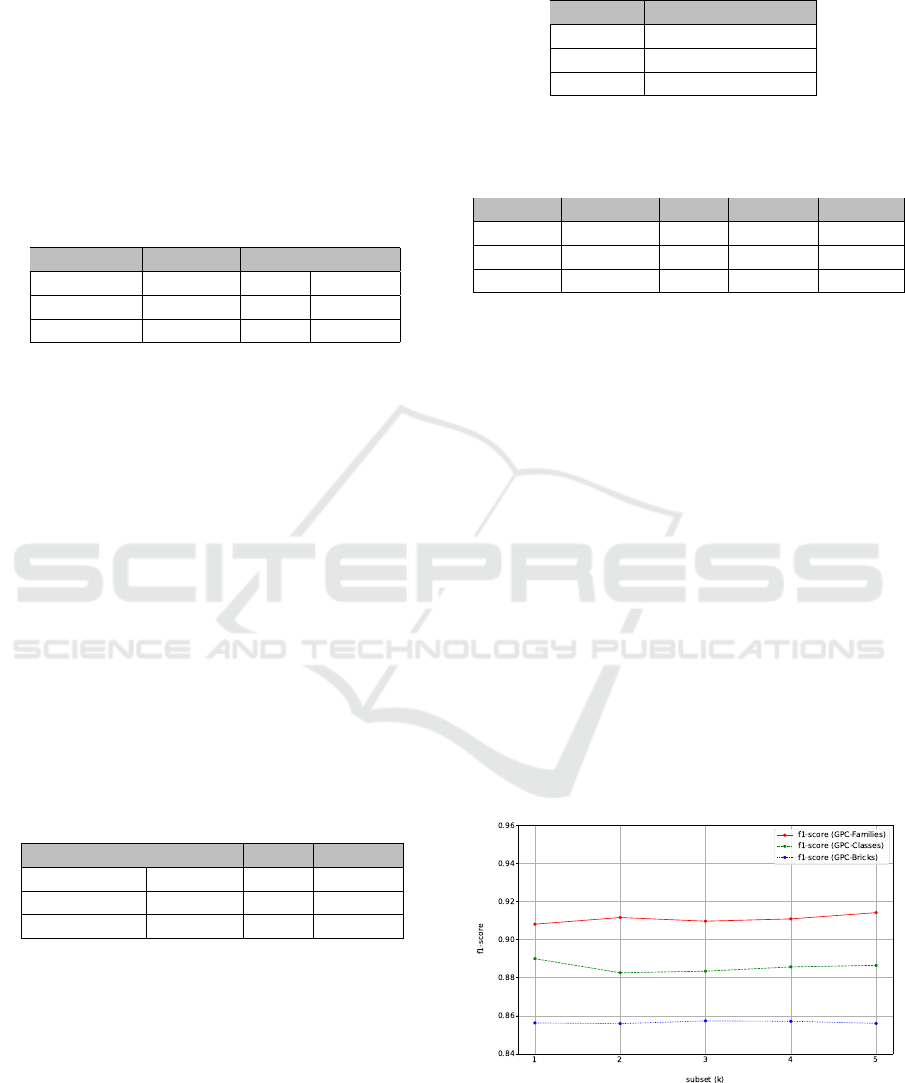
weighted by the inverse of their distance. Therefore,
we use this configuration for the kNN algorithm in all
of the following experiments.
5.3.3 Distance Metrics
In this section, we examined three distance metrics for
determining nearest neighbors while calculating the k
nearest neighbors using different distance metrics for
classification. As mentioned before, k is set to 2.
Table 3: kNN distance metric performance comparison on
GPC brick level.
algorithm precision recall f1-score
euclidean 0.864 0.862 0.861
minkowski 0.850 0.849 0.848
chebyshev 0.743 0.742 0.740
Based on our data, each distance metric produces
different classification results and the euclidean dis-
tance achieves the best classification performance.
5.4 Feature Engineering
We investigated the influence of different model ar-
chitectures on classification performance. We ana-
lyzed the impact of reducing the data in the feature
vectors on the performance and the runtime of the
system. In a first step, we investigated the influence
of different model architectures on the classification
performance on brick level. We used each architec-
ture for feature extraction and measured the classifi-
cation performance. The results in table 4 show, that
the model architecture used for feature extraction has
an impact on classification performance. In our case,
ResNet50 is the most suitable architecture.
Table 4: Performance comparison of different model archi-
tectures on GPC brick level.
model precision recall f1-score
ResNet50 0.864 0.862 0.861
VGG16 0.851 0.850 0.849
InceptionV3 0.806 0.805 0.802
In order to determine the class as quickly as pos-
sible, we reduced the generated feature vectors to de-
crease runtime. We used Principal Component Anal-
ysis (PCA) (Lever et al., 2017) for dimensionality re-
duction (table 5) and measured the classification per-
formance of the system by classifying the differently
sized feature vectors on GPC brick level. The values
in table 6 indicate a correlation between the perfor-
mance of the system and the number of elements in
the feature vectors. A decreasing number of elements
per vector causes a decreasing system performance.
Table 5: Influence of the PCA feature reduction on the
amount of data based on 69.256 images.
vec. size data amount [MB]
2048 546.73
512 272.00
128 68.00
Table 6: Performance and runtime of the classification of
PCA-reduced feature vectors at GPC-brick level based on
20% of the data.
vec.size precision recall f1-score time [s]
2048 0.864 0.862 0.861 29.34
512 0.861 0.860 0.859 13.91
128 0.850 0.849 0.848 11.45
A reduction of elements per vector by 75% to 512
results in a performance decrease of only 0.23% and a
runtime decrease by a factor of 2.11. We can therefore
double the speed of the system if we accept a small
loss in accuracy. We compared the PCA to Neigh-
borhood Components Analysis (NCA) and found that
PCA leads to better classification results in our case.
5.5 Performance Evaluation
We evaluated the performance of the system with k-
fold stratified cross-validation. We divided the dataset
into five subsets, which corresponds to 20% of the
data per subset, considering the proportions of each
class in the total dataset. In five runs, we used one of
the subsets as test data and automatically classified its
content based on the remaining data by using the kNN
algorithm. We calculated the weighted performance
metrics precision, recall and f1-score after each run
and used the results to calculate the arithmetic mean
to determine the total classification performance.
Figure 7: k-Fold stratified cross validation.
The k-fold cross validation resulted in a weighted
f1-score of 0.856 on GPC brick level, 0.886 on GPC
class level and 0.911 on GPC family level. Classifica-
DATA 2022 - 11th International Conference on Data Science, Technology and Applications
298
tion accuracy is the highest at family level. This can
be justified by the fact that the visual differences of
the products at family level are larger and thus easier
to distinguish than products on class and brick level.
Table 7: Results of system performance evaluation based on
k-fold stratified cross validation.
GPC-Layer k precision recall f1-score
Brick 5 0.859 0.857 0.856
Class 5 0.887 0.886 0.886
Family 5 0.911 0.911 0.911
In another experiment, we removed product im-
ages that belong to products in the test set from the
remaining dataset before classification. We ensured
that no data of products from the test set appear in
the remaining 80% of the data. We observed that
the weighted f1-score decreased by 0.031 at the GPC
brick level, by 0.025 at the GPC class level, and by
0.02 at the GPC family level as shown in table 8.
Table 8: Results of system performance evaluation with a
dataset where the products in the test set are not included in
the remaining 80% of the data.
GPC-Layer precision recall f1-score
Brick 0.827 0.826 0.825
Class 0.862 0.862 0.861
Family 0.891 0.890 0.891
5.6 Hybrid Classification Approach
In all previous experiments we used image-based
classification only. In order to improve the classifi-
cation performance of the system, we combined the
image-based classification with a text-based approach
and merged the classification results as described in
section 3.5.
For classification, we took 20% of the image data
and extracted the corresponding text from each im-
age in the test data based on OCR (Google, 2022).
This gave us 13.476 images with 13.476 texts, each
of which we classified separately on GPC brick level.
We then combined the two methods and classified all
13.476 elements with our combined approach.
Table 9: System performance comparison of the image-
based, text-based and hybrid approach on GPC brick level.
approach precision recall f1-score
images and texts 0.884 0.884 0.883
texts only 0.846 0.858 0.850
images only 0.870 0.864 0.866
The combination of the two approaches leads
to a better overall classification performance. The
weighted f1-score of the combined approach is 1.7%
higher than the image-based approach and 3.3%
higher than the text-based approach.
6 SUMMARY
The system presented in this paper is based on a neu-
ral network (ResNet50) for feature extraction and a
supervised learning algorithm (kNN) for classifica-
tion of the extracted features. The results of our exper-
iments are based on 69.256 product images of 36.624
different products which are assigned to 197 differ-
ent GPC-bricks, 73 different GPC-classes and 20 dif-
ferent GPC-families. We classified the given dataset
with weighted f1-scores of 0.856 on GPC brick level,
0.886 on GPC class level and 0.911 on GPC family
level (table 7). After removing product images from
the search space which belong to products in the test
data, we achieved a weighted f1-score of 0.825 on
GPC brick level, 0.861 on GPC class level and 0.891
on GPC family level (table 8). Our hybrid classifi-
cation approach with image- and text-based classifi-
cation increased the weighted f1-score on GPC brick
level to 0.883 (table 9).
Due to current error rates, a completely error-free
and fully automated classification is not yet possible
but the system can support the user significantly by
considerably reducing the manual workload during
the classification process.
6.1 Advantages and Limitations
Our system is not limited to the GPC standard
and works with other classification systems as well.
Changes to the classification system do not cause a
need for adjustments or changes of the system. For
example, the built-in neural network does not need
to be retrained in case of a change of the classifica-
tion system, which makes it a flexible solution. The
system can determine the class of an unknown prod-
uct image based on similarities with already classified
images. Each newly classified image is added to the
search space after classification and will be used for
classification tasks in the future.
The system needs at least one classified item per
class to make predictions for a given element. The
first item of a class must be labeled manually by the
user. Initial experiments have shown that predictions
improve as the amount of data increases and the per-
formance of the system is better when multiple im-
ages per product exist in the dataset. In a productive
environment, it is recommended to use a probability
value for a predicted class. If the predicted value is
A Hybrid Approach for Product Classification based on Image and Text Matching
299

above a given threshold, the corresponding class can
be assigned automatically by the system. Otherwise,
the user can be prompted to perform the classification
manually.
6.2 Future Work
Our system supports the user during the product clas-
sification process by using corresponding product im-
ages. To automate this task completely, further re-
search and development work is necessary. The sys-
tem can be combined with object detection and image
segmentation to detect the product in an image and cut
it out before feature extraction. This approach allows
almost any product image type to be used in the sys-
tem for classification. Currently, product images are
compared in their entirety. This can lead to a product
image not being classified correctly, when the product
only makes up a small part of the image.
The system can also be combined with additional
text-based and color-based techniques to further in-
crease classification performance. Despite the high
accuracy of the system, errors can occur during a fully
automated classification process. The user can be
asked for input if the probability of a predicted class
is low and below a given threshold to minimize the
error rate of the system. In this way, the user inter-
actively contributes to the improvement of the system
by generating labeled image data, which can be used
for classification in the future.
ACKNOWLEDGEMENTS
This work was funded by the German Federal Min-
istry of Education and Research (FKZ 01IS20085).
REFERENCES
Allweyer, O., Schorr, C., Krieger, R., and Mohr, A. (2020).
Classification of Products in Retail using Partially Ab-
breviated Product Names Only. Proceedings of the
9th International Conference on Data Science, Tech-
nology and Applications - DATA, pages 67–77.
Bast, S. (2021). Image Matching for Product Image Clas-
sification based on Machine Learning. University of
Applied Science Trier, Institute for Software Systems,
Master thesis.
Chavaltada, C., Pasupa, K., and Hardoon, D. R. (2017). A
Comparative Study of Machine Learning Techniques
in Automatic Product Categorisation. Proceedings
of the 14th International Symposium on Neural Net-
works - ISNN, pages 10–17.
Deng, J., Dong, W., Socher, R., Li, L.-J., and Li, L. K. F.-F.
(2009). ImageNet: a Large-Scale Hierarchical Image
Database. IEEE Conference on Computer Vision and
Pattern Recognition, pages 248–255.
Google (2022). Google Vision API. https://cloud.google.
com/vision. (2022-02-16).
GS1 (2018). Global Product Classification Development
& Implementation Guide. https://www.gs1.org/sites/
default/files/gpc development and implementation 1.
pdf. (2022-02-12).
GS1 (2019). GS1 Product Images Application Guideline for
the Retail Grocery & Foodservice Industries. https://
www.gs1us.org/grocery-image-guide. (2022-02-12).
He, K., Zhang, X., Ren, S., and Sun, J. (2015). Deep
Residual Learning for Image Recognition. CoRR,
abs/1512.03385.
Karami, E., Prasad, S., and Shehata, M. (2017). Image
Matching using SIFT, SURF, BRIEF and ORB: Per-
formance Comparison for Distorted Images. CoRR,
abs/1710.02726.
LeCun, Y., Bengio, Y., and Hinton, G. (2015). Deep learn-
ing. Nature, 524:436–444.
Lever, J., Krzywinski, M., and Altman, N. (2017). Principal
Component Analysis. Nature Methods, 14(7):641–
642.
Mitchell, T. M. (1997). Machine Learning. McGraw-Hill
Education Ltd.
Russakovsky, O., Deng, J., Su, H., Krause, J., Satheesh, S.,
Ma, S., Huang, Z., Karpathy, A., Khosla, A., Bern-
stein, M., Berg, A. C., and Fei-Fei, L. (2015). Ima-
geNet Large Scale Visual Recognition Challenge. In-
ternational Journal of Computer Vision (IJCV), pages
211–252.
scikit learn (2022). scikit-learn - Machine Learning in
Python. https://scikit-learn.org. version 1.0.2. (2022-
02-12).
Simonyan, K. and Zisserman, A. (2015). Very Deep Con-
volutional Networks for Large-Scale Image Recogni-
tion. 3rd International Conference on Learning Rep-
resentations, ICLR 2015.
Sokolova, M. and Lapalme, G. (2009). A systematic analy-
sis of performance measures for classification tasks.
Information Processing & Management, 45(4):427–
437.
Szegedy, C., Vanhoucke, V., Ioffe, S., Shlens, J., and Wojna,
Z. (2016). Rethinking the Inception Architecture for
Computer Vision. 2016 IEEE Conference on Com-
puter Vision and Pattern Recognition (CVPR), pages
2818–2826.
Szeliski, R. (2021). Computer Vision: Algorithms and Ap-
plications. Springer, 2 edition.
Tan, C., Sun, F., Kong, T., Zhang, W., Yang, C., and Liu, C.
(2018). A Survey on Deep Transfer Learning. Arti-
ficial Neural Networks and Machine Learning, pages
270–279.
Wei, Y., Tran, S., Xu, S., Kang, B., and Springer, M. (2020).
Deep Learning for Retail Product Recognition: Chal-
lenges and Techniques. Computational Intelligence
and Neuroscience.
DATA 2022 - 11th International Conference on Data Science, Technology and Applications
300
