
Framework for Public Health Policy Indicators Governance and
Metadata Quality Flags to Promote Data Literacy
Wesley Lourenco Barbosa
1a
, Jacqueline David Planas
1b
, Maritza M. Carvalho Francisco
2c
,
Solange Nice Alves-Souza
1d
, Lucia Vilela Leite Filgueiras
1e
, Leandro Manuel Reis Velloso
3f
and Luiz Sérgio de-Souza
4g
1
Departamento de Engenharia de Computação e Sistemas Digitais, Escola Politécnica, Universidade de São Paulo,
São Paulo, Brazil
2
Departamento de Sistemas de Informação, Escola de Artes, Ciência e Humanidades, Universidade de São Paulo,
São Paulo, Brazil
3
Departamento de Projetos, Faculdade de Arquitetura e Urbanismo, Universidade de São Paulo, São Paulo, Brazil
4
Faculdade de Tecnologia de São Paulo, São Paulo, Brazil
luiz.souza71@fatec.sp.gov.br
Keywords: Data Governance, Data Literacy, Metadata Quality, Governance Framework, Health Indicators.
Abstract: Public Health Policy Indicators (PHPI) are tools for monitoring the performance of policies and enable data-
driven decision-making. For the PHPI to be useful for different stakeholders, they must be characterized,
promoting an unequivocal understanding of their meaning. PHPI are consolidated from data assets, which
must be managed to result in reliable information that support the decision-making process. However, in the
public sector, aspects related to data and indicators governance tend to be neglected. Thus, we propose a
metadata-oriented framework for health indicator governance, that incorporates aspects of the agile
philosophy, and allows implementing a fast-start governance program. Furthermore, a flag-based system is
proposed to promote data literacy in the context of health indicators. From a case study, we attained results
that show the feasibility of implementing a governance program, with budget and time constraints,
guaranteeing fast value delivery. The quality flags proved to be an adequate strategy to classify the indicator
metadata in a simplified way and encourage improvement actions. Therefore, working towards obtaining
more detailed descriptions of the indicators that highlight the usefulness of the information, promotes a better
understanding of its meaning and use, encouraging data literacy, generating value, and positively impacting
the management of health policies.
1 INTRODUCTION
In the health sector, policies and programs are,
respectively, guidelines aimed at the continuous
improvement of the healthcare system and
mechanisms for the operationalization of public
health policies within a time frame. The policies and
programs must be continuously inspected to track the
a
https://orcid.org/0000-0001-6106-7936
b
https://orcid.org/0000-0001-7661-0401
c
https://orcid.org/0000-0002-4913-2050
d
https://orcid.org/0000-0002-6112-3536
e
https://orcid.org/0000-0003-3791-6269
f
https://orcid.org/0000-0003-4883-7208
g
https://orcid.org/0000-0002-7855-0235
progress toward reaching their objectives and to guide
management decisions (CDC 2011; Jr. and Cunha
2015; Casa Civil da Presidência da República 2018).
In this context, the Public Health Policy Indicators
(PHPI) are the main tools that enable managers, by
the monitoring and evaluation (M&E) process, to
promptly use information to support decision-
making, identifying deviations, and taking preventive
Barbosa, W., Planas, J., Francisco, M., Alves-Souza, S., Filgueiras, L., Velloso, L. and de-Souza, L.
Framework for Public Health Policy Indicators Governance and Metadata Quality Flags to Promote Data Literacy.
DOI: 10.5220/0011259000003269
In Proceedings of the 11th International Conference on Data Science, Technology and Applications (DATA 2022), pages 281-292
ISBN: 978-989-758-583-8; ISSN: 2184-285X
Copyright
c
2022 by SCITEPRESS – Science and Technology Publications, Lda. All rights reserved
281

and corrective actions (Sellera et al. 2019). Data-
driven decision-making, in general, leads to more
effective actions with a greater value for
organizations (El Yaakoubi et al. 2020; Henke et al.
2016). This is relevant, especially in the context of
public management, which requires prioritizing the
most vulnerable or most affected components of the
population. Therefore, the more assertive and
effective the decisions and actions taken, the greater
the value added to society.
The dissemination of health information allows
analyzing and monitoring the public health situation,
justifying the budget to increase the effectiveness of
programs and policies management (Edelstein et al.
2018). In some countries, national governments have
taken to brawling with researchers and the media
(OECD 2020). Their official publications of data and
indicators regarding the progress of the disease were
widely questioned, having their availability, veracity,
credibility, consistency, and currentness challenged
(ISO/IEC 25012 2006; Winter 2020; Nature 2020).
As a result, independent initiatives, made up by
councils, press, research centers and universities,
started counting and publicizing data used to monitor
and track the disease’s march across the globe
(OECD 2020; OPGH 2021). This scenario highlights
how important it is for the higher health management
authority to provide sound indicators, allowing
stakeholders to make reliable data-driven decisions.
PHPI must be properly characterized to serve the
purposes of the different stakeholders, which implies
having a set of qualified information that allows
having an unequivocal understanding of all health
indicators. Metadata of indicators are detailed
descriptions that highlight the usefulness of the
information, improving the understanding of its
meaning and use (Riley n.d.; Jackson and Pencheon
2008).
In regard to PHPI, metadata is key to facilitating
and even promoting data literacy on health policy
indicators analysis, besides stimulating its use for
effective decision-making. Data literacy thus refers
to the ability to collect, understand and use data
(Wolff et al. 2016). “Metadata creation and use” and
“data-driven decision making” are competencies
listed in the main data literacy frameworks
(Bonikowska, Sanmartin, and Frenette 2019). It is
critical to stimulate the common understanding of
metadata and ensure that they will always be up-to-
date, complete and accurate. Even though data
literacy is being increasingly emphasized in the
private sector, it still not widely applied to the public
sector (Jamaluddin 2019). The importance of data
meaning for analyses and decision-making on public
health policies was also evident in the challenge of
making analyses and quickly publishing results
during the COVID-19 pandemic (Fraser-Arnott
2020).
Frameworks, such as Data Management Body of
Knowledge (DMBOK) (DAMA International 2017)
and Data Management Maturity Model (DMMM)
(CMMI Institute 2014), provide practical guidance on
a set of tasks that must be performed to implement
data asset management in a data-driven organization.
According to these frameworks, data governance and
data quality are the foundation to establish a data
management program. Considering business rules,
resources, interests, and strategies, each organization
is unique. Hence, it is necessary not only to find ways
to put in practice the tasks proposed by such
frameworks, but also to complement and link
activities in a manageable set of tasks. This requires
integrated knowledge and concepts, and new
solutions.
These frameworks are large and complex; their
implementation may take time, despite their
modularity. Moreover, implementing them requires a
great deal of human and financial resources, which
increase according to the characteristics, size, and
complexity of the organization. Therefore, they are
not applicable to many organizations, especially
when there are severe constraints on time and
funding. In these cases, for implementing data
governance and data quality, it is more appropriate to
consider a simplified process with the following
characteristics: (i) taking into account the cultural
context, (ii) based on agile philosophy that allows
continuous value delivery, (iii) encourages
engagement and continuous improvement.
Thus, this paper introduces a framework for
governance of health indicators (FGHI) and flag-
based system as a metric to qualify indicators
metadata. The FGHI is proposed to implement the
governance of indicators in a health organization with
strong budget and time constraints and could show
promising initial results that would encourage
managers to invest in a broader initiative for data
governance of health indicators. Another challenge
for this scenario was to find an easy-to-use metric to
promote data literacy in the context of health
indicators and assist in the implementation of a
strategy for continuous improvement of data
governance, with results that generate value and
positively impact the management of health policies.
This paper is organized as follows: Section II
addresses related works. Section III details the FGHI
and the proposed quality metric of PHPI. Section IV
presents the application of the Framework and the
DATA 2022 - 11th International Conference on Data Science, Technology and Applications
282

results are discussed. Finally, section V concludes
the paper, including future works.
2 CONCEPTS AND PREVIOUS
WORKS
The digital revolution has contributed to empowering
data technologies in organizations and in a broader
socio-economic context, highlighting the need to
develop new competencies in the analytical field for
using data to effectively extract their value. Low
familiarity with data limits the ability to understand
and use them for effective decision-making.
Therefore, it is essential to acquire these new data-
related skills, not only for engineers and IT
specialists, such as data scientists, but it must be
democratized and, with different levels of expertise,
it must be present in the entire workforce, regardless
of the area or role. In fact, non-data roles give
meaning to data and increase their value in practice.
Data literacy thus takes an important role, making
everyone capable of interacting and understanding
data and translating them into effective data-driven
actions (Gummer and Mandinach 2015; Pedersen and
Caviglia 2019).
Therefore, in an increasingly data-driven world,
establishing a process that incites and encourages data
literacy must be a priority for organizations that aim
to stay relevant. A more data-literate workforce
would allow a better use of data to guide decisions
that affect the planning and development of health
policies, promoting a strengthened data-driven
culture (Bossen et al. 2019; Kleckner 2020).
(Mikkelsen-Lopez, Wyss, and De Savigny 2011)
and (Baez-Camargo and Jacobs 2011) proposed
governance frameworks aimed at health systems.
(Mikkelsen-Lopez, Wyss, and De Savigny 2011)
proposed a problem-oriented approach based on
systems thinking to assess governance by
highlighting barriers to the implementation of health
systems governance. The main limitation of the
proposal, considering the context of health indicators,
is the more transversal focus of the strategic vision of
policy design. Also, the proposal is not able to
identify specific weaknesses and/or how to intervene.
(Baez-Camargo and Jacobs 2011) proposed
governance frameworks aimed at health systems
propose a procedural framework, with inputs,
processes and outputs for the governance of health
systems in low-income countries. Their proposed
framework is based on the values of good governance
discussed in the literature and proposes an
"institutional analysis" to identify the main
stakeholders involved. Despite presenting an
application methodology, the framework emphasizes
the assessment of health policies and strategic
institutional design.
Although both proposals address governance
regarding the performance of health systems as the
need to create systematic methods to assess
deficiencies to develop appropriate interventions,
they are aimed at a broader strategic vision
concerning institutional and policy design. This
requires a good level of maturity in understanding the
importance of governance for the overall efficiency
of health systems. From a defined health policy the
approach herein is more focused on the idea of how
to design and promote the efficient use of its
indicators, with the perspective of data-driven
governance of health policy indicators.
3 FRAMEWORK FOR
GOVERNANCE OF HEALTH
INDICATORS
The FGHI is structured in well-defined components
and employs the problem-oriented approach of
(Mikkelsen-Lopez, Wyss, and De Savigny 2011), and
the procedural structure, with inputs, processes, and
outputs, proposed by and (Baez-Camargo and Jacobs
2011). In addition, the framework was inspired by the
guidelines and best practices established in the
DMMM (CMMI Institute 2014) e DMBOK (DAMA
International 2017). Despite being the main reference
in the data governance journey, DMBOK has a
structure from which practical implementation tends
to be time-consuming, demanding substantial human
and financial resources. According to the
characteristics and complexity of the organization,
those problems may increase significantly. Even
though DMBOK presents a modular structure,
employing it requires an important initial level of
commitment for which, depending on the type of
organization, can be difficult to find a sponsor and
promote the engagement.
Therefore, our proposal adopts an applied vision
of the governance program that stands out for
incorporating the agile philosophy to continuously
improve supporting processes and procedures to
deliver value to the business. This empowers smaller
initiatives to persuade and attract sponsors to a
broader governance program.
Hence, the FGHI emerged as a proposal for
implementing the health indicators governance
Framework for Public Health Policy Indicators Governance and Metadata Quality Flags to Promote Data Literacy
283
program in the Ministry of Health of Brazil (MS). The
PHPI metadata quality flags derived from the
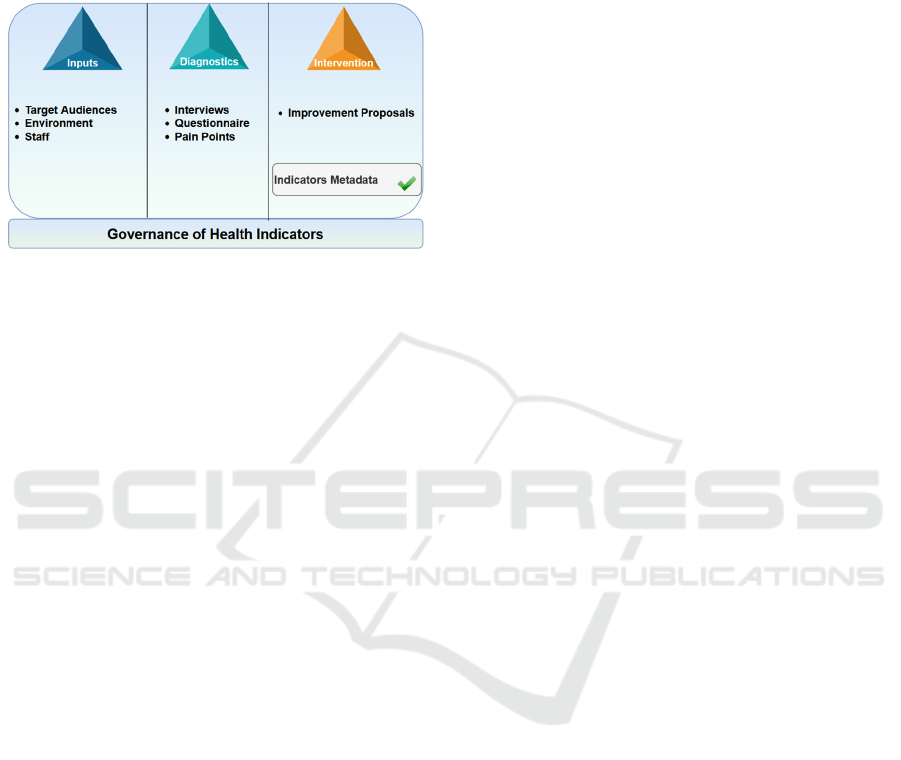
application of the framework. Figure 1 presents the
proposed framework for the governance of health
indicators.
Figure 1: Framework for the implementation of indicator
governance.
3.1 Inputs
The inputs represent the structuring resources:
human, realm, and the direct or indirect aid structures
that support the other parts of the framework. There
are 3 structuring inputs: the target audience, the
environment where the governance program is
implemented, and the supporting staff.
3.1.1 Target Audiences
Identifying the target audiences or stakeholders allow
better understanding the needs to be guaranteed by
the governance of PHPI. Stakeholders must be
considered at all stages of governance development
and implementation to effectively understand and
meet their expectations and concern with the
governance of indicators (GI) and their metadata.
3.1.2 Environment
The environment defines the domain within which the
creation of PHPI and the coordination of the indicator
governance implementation occurs. Thus, the
environment determines the target organization
whereby the proposed governance of indicators takes
place and facilitates the implementation of the
framework.
3.1.3 Staff
The staff comprises the personnel responsible for
obtaining, controlling, maintaining, and enabling
access to data and information on health indicators.
Thus, the staff is responsible for managing and
executing all the activities that guarantee access to
data and information with the required quality for
proper use by stakeholders. Therefore, as they are
responsible for monitoring the entire lifecycle of the
indicator, the staff retains the most extensive
knowledge about the challenges for stakeholders to
understand and use PHPI.
3.2 Diagnostics
The diagnostics step highlights the framework
problem-based approach (Moralee and Sweeney
2012). At this stage, we identify challenges and
priorities employing techniques such as interviews
and questionnaires.
For more effective results, the starting point to
design actions for improvement must originate from
the problems and pain points that affect the
performance of the health system. Being aware of the
perceptions of stakeholders who have a direct
association with the results of interest allows us to
acquire a more detailed understanding of the main
issues.
3.2.1 Interviews and Questionnaire
The interview was one of the instruments used for
diagnosis and consists of guided conversations using
open-ended questions to converse with respondents
and collect/elicit data. During the interviews,
interviewees can freely express their concerns and
frustrations. The goal is to consider the staff’s vision
and understanding of the entire life cycle of
indicators.
The questionnaire consists of a set of predefined
and context-appropriate questions that are answered
and analyzed to identify opportunities for
improvement.
3.2.2 Pain Points
Identifying the pain points from the perspective of
stakeholders is important to define the ones that are
worth pursuing. Since some of the points are
mentioned frequently and by more than one
stakeholder, this might be an indication of an
important challenge. According to the limitations and
restrictions imposed by the project, it is possible to
decide which solutions bring the greatest perceived
value to the organization in the shortest time possible.
The analysis of the results of the diagnosis
instruments allows us to identify and classify the pain
points.
DATA 2022 - 11th International Conference on Data Science, Technology and Applications
284

3.3 Intervention
At the intervention stage, strategies for improving the
weaknesses identified are defined. Depending on the
budget and time constraints, it may not be possible to
immediately address all the mapped pain points.
Thus, a prioritization of the problems must be
established. This prioritization should be made
considering the perspective of the staff and
stakeholders. In an agile problem-based approach, a
simple, easy-to-understand technique should be
chosen, which can be easily customized to the context
of the problems in question. The Gravity, Urgency,
and Trend (GUT) technique (Zarpelam and Pereira
Da Silva 2020), which is a problem-solving
prioritization helping tool, meets those requirements
and can be used to support the prioritization of actions
and tasks.
3.3.1 Improvement Proposals
The metadata component of the framework underpins
the proposals for improvement. The structure of this
component is built from the stakeholder's quality
expectation regarding the indicators metadata. Data
quality expectations are organized into data quality
dimensions affected by the pain points. This provides
an underlying arrangement for the quality expectations
to be reflected as rules applied to an approach for
validation and monitoring (Loshin 2009).
(ISO/IEC 25012:2008 2015) presents a set of
metrics covering structured data for the different
dimensions of quality that also appear in other
publications (Sidi et al. 2012; Jayawardene, Sadiq, and
Indulska 2013). (Batini et al. 2011) includes data
quality metrics for semi-structured and unstructured
data. In the context of this work, we highlight the
metrics for the completeness quality dimension
proposed by (Ochoa and Duval 2006b), which
corresponds to (i) the number of filled fields within all
the metadata available, and (ii) weighted completeness,
which considers the relevance of each field according
to the context of use. These metrics have been
recommended and used in metadata qualification and
especially in the evaluation of open data (Zhang and
Xiao 2020). The weighted completeness is a
mathematical metric based on a ranking that varies
from 0 to 1 according to the importance of the field
(Ochoa and Duval 2006a). However, for cases in
which the metadata are composed of numerous fields,
the mathematical ranking can lead to innumerous
classes of importance, increasing the time required for
their classification. The complexity increases for cases
whereby consensus among several participants is
needed as to the importance of weighting the metadata
fields.
(Batini et al. 2011) propose relevance, a dimension
of data quality that expresses importance and
usefulness and can be calculated/attributed by a
qualitative assessment by the business experts.
Relevance reinforces the importance of the weighted
completeness proposed by (Ochoa and Duval 2006b).
Thus, a metric that allows the classification of
completeness by weighting, according to the relevance,
is paramount but that limits the number of classes
reducing complexity and facilitating consensus.
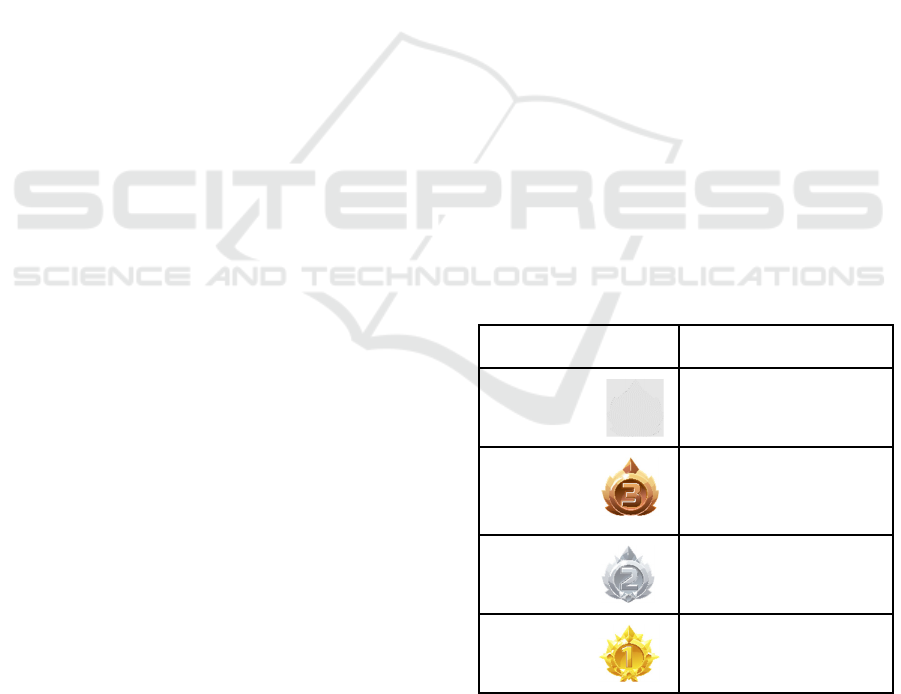
3.3.2 Metadata Quality Flags
The PHPI metadata quality flags stemmed from the
weighted completeness and relevance metrics, and
they define categories of quality levels from a
minimum baseline, ensuring the needs of
business/commercial, technical and operational
pillars according to Data Quality Assessment (CMMI
Institute 2014). The proposal of the flags provides
relevant signification and an easier understanding of
the indicators, encouraging their adoption. For the
PHPI context, a limited number of flags for
classification is preferable, especially because there is
a need for consensus among different stakeholders.
We propose four categories of flags, which could
correspond to the ratings: great, good, fair, bad. The
relevance of fields is considered when assigning de
flags for the quality of the metadata. We can thus state
that a certain flag can only be assigned to an indicator
if all the fields considered to be the most relevant are
contemplated, or even if a specific percentage of the
most relevant are satisfied. Considering that the
baseline corresponds to the minimum completion of
a certain set of fields, the proposed flags are:
GOLD: assigned to the metadata of the indicators
that meet all the GI requirements.
SILVER: assigned to the metadata of the
indicators that meet a larger set of GI
requirements;
BRONZE: assigned to the metadata of indicators
that meet the minimum GI requirements (this flag
category constitutes the baseline, that is, the
minimum quality expected);
WHITE: assigned to the metadata of the
indicators that do not meet the minimum
requirements for the GI;
Although the proposal is aimed at PHPI, it focuses
on metadata governance. Hence, they are suitable to
qualify general purpose metadata. Another point to be
Framework for Public Health Policy Indicators Governance and Metadata Quality Flags to Promote Data Literacy
285

highlighted is that the flags can be used not only
aligned to the dimensions of completeness and
relevance, but also other requirements that cover
other data quality dimensions could be used.
Moreover, depending on the context, it is possible to
establish flags for each quality dimension of interest
and assess an overall flag that combines them all.
Nevertheless, in our proposal, the flags qualify the
understandability of the PHPI.
4 APPLICATION OF THE FGHI
AND ITS RESULTS
4.1 Inputs – Identifying the Target
Audience
In the context of health policies, the stakeholders are
citizens, researchers, health managers, and also the
Federal employees from the MS. Hence, the interests
in improving and monitoring the indicators vary:
some have managerial bias, concerned with economic
and political aspects, others have scientific interests
in producing information and knowledge, and those
who are interested in evolution and social impact
(Rabinowitz 2014).
4.2 Inputs – Environment
In the case study of this paper, the environment is a
unit within the MS that is responsible for monitoring
the progress and performance of the health policies
regarding its goals. The MS is a cabinet-level
executive branch department of the Brazilian federal
government, with decentralized political control,
highly hierarchical and ever-changing. Regarding
data management and governance, these peculiarities
lead to a strong protectionist tendency of the
information, besides hindering the creation,
establishment and maintenance of a process and
standards. A major challenge for data governance,
which is a common feature of public organizations, is
the incompatibility between organizational structure
and data usage that can result in data silos,
duplication, unclear responsibilities and lack of data
control over its entire life-cycle (Janssen et al. 2020).
4.3 Inputs – Staff
In the context of the PHPI, the staff are the employees
of the unit within the MS, whose attributions include
(Brasil 2012):
• Monitoring, coordinating and facilitating all the
activities related to PHPI, from its conception,
use and up to its closure;
• Obtaining and systematizing data and
information produced by the MS bodies and
related entities and by other health institutions,
for contributing to the decision-making process
and to the monitoring of public health policies;
• Making available, information and analysis of
executive and managerial nature through the
internet and any other means defined by the MS,
aiming at supporting decision-making,
management and the production of knowledge;
• Providing regular health situational analysis
reports;
• Managing portals that contribute to viewing and
publishing PHPI.
control over its entire life-cycle (Janssen et al.
2020).
4.4 Diagnostic – Interviews and
Questionnaire
The interviews conducted with several staff members,
allowed us to understand the existing process to
create PHPI and its complexity from different
perspectives. The questionnaire used was adapted
from (Vidgen, Shaw, and Grant 2017) to the project
context; the application of the questionnaire was not
restricted to staff members, but was also applied to
people from other MS units responsible for working
on the process of M&E health indicators. The 41
respondents chose the most significant and priority
pain points to implement governance and the use of
indicators linked to health policies. This allowed us
to assess and identify the main challenges in the MS
to develop analytical training to extract value from
the data on health indicators.
4.5 Diagnostic - Pain Points
The analysis of the interviews allowed us to identify
28 problems related to the governance and quality of
the PHPI and the organizational culture of the
environment. We used Quality dimensions (ISO/IEC
25012:2008 2015; Merino et al. 2016) to classify the
data quality problems (DQP). Table 1 exhibits the
pain points, related to the PHPI, associated with DQ
dimension and their respective root cause. Table 2
presents the pain points related to business problems.
DATA 2022 - 11th International Conference on Data Science, Technology and Applications
286

Table 1: Pain Points and DQ Dimensions (ISO/IEC
25012:2008 2015).
Pain Point
(DQ Dimension
Compromised)
Cause
DQP 1 -
Duplicated
indicators
(Uniqueness/
Redundancy)
The existence of data silos within MS
units facilitates the non-unified creation
of indicators, resulting in redundant and
inconsistent information between
different units. The most serious effect
is that such inconsistencies are
publicized by different units.
DQP 2 -
Unmatchable
indicators
(Consistency)
Several different indicators measuring
the same thing and with divergent
results (inconsistency), as they use
different databases for calculation. Who
has the true information or the correct
source?
DQP 3 - Lack of
standard
(Compliance)
With data silos, each area defines its
own metadata standards for the
indicators. There is no formally
established, agreed upon, and
controlled standard for creating PHPI.
DQP 4 – lack of
necessary agility
(Timeliness)
Requests to create and change
indicators tend to not be fulfilled within
productive time.
DQP 5 – Problems
related to fitness-
for-use
(Currentness)
Indicator data is not updated at the
appropriate time. Non-standard and
misunderstood metadata do not record
information for correctly performing
the necessary updates.
DQP 6 –
Completeness
problems
(Completed)
Some PHPI displayed in data
visualization interfaces do not show the
expected information when accessed by
their users because the PHPI creation
and update process does not include
responsibilities and checks to curb the
exhibition of incomplete indicators.
Much information (metadata), with
different levels of importance, are used
for describing the indicators. There are
not guarantees that the data fields are
filled with any information, even pieces
considered most important.
DQP 7 –
traceability issues
(Traceability)
It is not possible to know who proposed
or who approved the PHPI. The
granularity of the accountability level
makes it difficult to assess the indicator
life cycle.
DQP 8 – Problems
for understanding
the indicator
(Understandability)
Due to the lack of collaboration for
defining and standardizing metadata,
indicators are created without the
broad understanding of those who use
them.
DQP 9 – Reliability
issues (Reputation)
Due to the lack of collaboration and an
entity responsible for controlling the
creation of indicators, there is
resistance among the departments to
reuse indicators from others because
they do not understand how they were
established or calculated.
Table 2: Business problems.
Pain point
Cause
1 - Limited use of
indicators
Due to several problems, which
range from understanding to
reliability and timing to make the
indicators available, they are not
effectivel
y
used.
2 - Not results-
oriented
Analyzing indicators to monitor
results/performance of actions
associated with policies, programs is
not a common practice.
3 - Lack of
metadata
management
Misunderstanding, obsolescence,
inconsistencies, duplication of PHPI
lead to a lack of credibility for their
effective use. The lack of processes,
roles, and responsibilities for
controlling and orchestrating the
activities associated with creating
PHPI, as well as tools, technology,
and absence of a training path, are
also important causes.
4 - Lack of vision
of what to achieve
Lack of strategic planning.
5 - Strong data
silos structures
with several
departments
generating and
distributing
information
Lack of a well-established process,
orchestration, and standardization,
defined in compliance with
standards, rules, and laws.
Moreover, there is a need for a
tightly controlled process to create
and change PHPI.
The analysis of the responses to the questionnaire
pointed to an alignment between the most critical
challenges raised in the interviews, which were:
• Construction of a culture oriented to the use of
indicators to support decision-making and better
management of Public Health Policies results;
• Creation of a strategy with clearer processes,
roles and responsibilities involved in the use of
indicators;
• Strategic performance management with
indicators to evaluate the organization's success;
• Overcoming resistance to change;
• Data quality management;
Framework for Public Health Policy Indicators Governance and Metadata Quality Flags to Promote Data Literacy
287
• Processing for data preparation and calculation
of indicators.
4.6 Intervention
As the number of challenges identified was large and
time and cost constraints were tight, to ensure the
generation of the greatest possible value, the matrix
GUT for process prioritization was customized,
considering PHPI requirements, before being used in
the MS. The prioritization was a collaborative effort
with the staff members and enabled us to select the
problems to be solved in the short term, the main ones
being those related to the quality of the PHPI
metadata. Additionally, the results of the
questionnaire and interviews indicated opportunities
for improvement to be considered in the governance
of health indicators process.
4.7 Intervention - Improvements
In the case study previously described, the pain points
refer to the concerns of the staff and stakeholders
raised in interviews and questionnaires. Thus, the
solutions focused on improving metadata quality
dimensions and the business problems we identified.
In this context, our proposition had two directions:
one focused on the metadata of the indicators, and the
other on the process flow for PHPI creation and
modification.
A public organization with multiple management
levels was the environment where the case study took
place; the collaborative construction of the
improvement proposals had to reach a consensus to
be widely accepted. Otherwise, there was a risk of not
having enough support for the success of the
governance program. Hence, the proposal of tailored
metadata flags seemed adequate and was put into
experimentation as a working tool for the staff
members.
PHPI has a series of characterizing data attributes
that can be grouped according to what we named
utility subdimensions. These subdimensions are
classifications of attribute purposes and were used to
specify the relevance of the metadata. Thus, PHPI
metadata receives a certain flag depending on its
completeness according to their respective
subdimension. For the PHPI in the MS, we defined
the following subdimensions:
• Searchability: data fields that enable the
indicator to be retrieved;
• Calculation: data fields that define the formula
and instruct how to collect the data used in the
calculation of the indicators;
• Classification: data fields used to classify the
indicator according to criteria of the M&E
process or international standards;
• Descriptiveness: data attributes that help to
understand the indicator;
• Basic elements: data fields that must be
completed in all indicators, such as title and
objective;
• Identification: data attributes that make it
possible to unequivocally distinguish the
indicator;
• Frequency: data attributes that define the time
intervals at which the indicator must be updated,
monitored and evaluated;
• Policy: defines the policy or program to which
the indicator is linked;
• Accountability: data fields that delegate the
responsibility for creating and approving the
indicator.
• Reusability: data fields that create
dependencies between indicators;
• Vision: a plan of action that sets out a vision for
a specific public health policy;
• Visualization: supporting data fields for
creating dashboards and indicator charts;
Table 3 presents the set of subdimensions for each
quality flag. Stakeholders actively participated in this
definition, which also contemplates the relevance
analysis of each attribute.
Table 3: Subdimensions of each quality flag.
Flag Subdimensions
White Basic elements;
Identification
Bronze Calculation;
Descriptiveness; Policy;
Accountability;
Silver Searchability; Frequency;
Visualization;
Gold Classification;
Reusability; Vision.
Note that, for an indicator to be classified in a
“better” flag, it must meet all the requirements of the
next level of quality flag. For example, if an indicator
has the bronze flag and is later improved by filling in
all the attributes of the subdimension searchability, it
DATA 2022 - 11th International Conference on Data Science, Technology and Applications
288
would remain with the bronze flag. Only after
properly filling in the attributes of the frequency and
visualization subdimensions will it obtain the silver
quality level.
The flag system proposal is promising because,
instead of defining complex mathematical criteria, to
which calculation formulae could be a disincentive
for adoption, the quality flags we propose classifies
the indicators metadata in a simple, clear and
objective way. Therefore, over time, they encourage
continuous improvement actions focused on raising
the level of quality with more complete descriptions
of the indicators, fostering and facilitating their use
by all audiences.
As shown in Table 4, our proposal to create the
quality flags contributes to attenuating the business
pain points described in Table 2.
Table 4: Quality flags contribution to business problems.
Business
problem
Quality flags contribution
1 - Limited use of
indicators
Attributing quality flags motivated
the improvement of the description of
the indicators, facilitating the
understanding and promoting their
use.
2 - Not results-
oriented
The flags allow the clear definition of
short, medium, and long-term
objectives of the desired quality
levels, with goals to be pursued and
monitored.
3 - Lack of
metadata
management
Quality flags help to establish
metadata management focused on
continuous improvement.
4 - Lack of vision
of what to
achieve
With better described and more
reliable indicators, their use by health
managers is facilitated. This
contributes to more accurate
monitoring health policies and the
creation of more effective action
plans.
5 - Strong data
silos structures
with several
departments
generating and
distributing
information
The standardization of metadata
available for all indicators regardless
of the source areas is one of the ways
to change the organizational culture,
increasing the flow of communication
between all levels and units.
Consequently, the silos start to
breakdown and the use of indicators
from other areas becomes more viable
and easier than recreating another
equal or similar one.
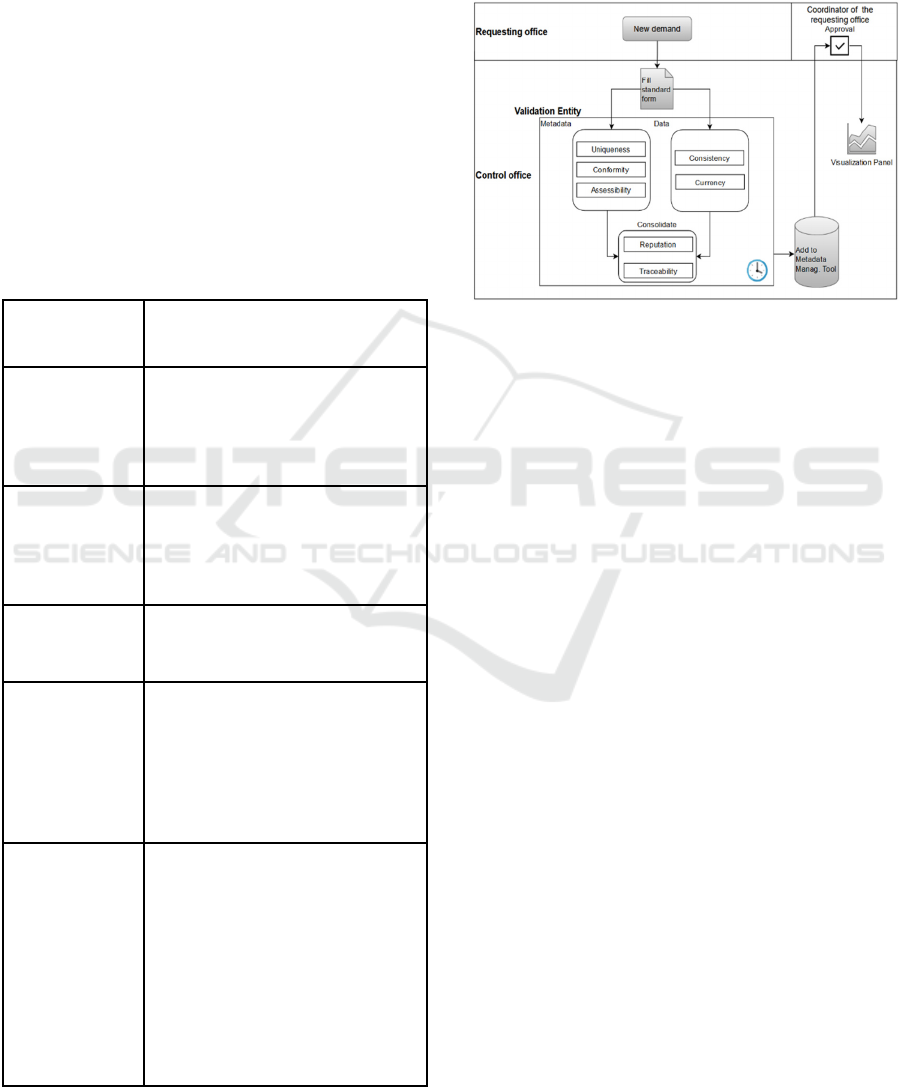
The other action we used to tackle the pain points
was aimed at revising the PHPI creation process,
shown in Figure 2. This strategy allowed us to initiate
solutions for the other data quality problems that were
not resolved only with the proposal of the data quality
flags.
Figure 2: To-be flow to request and modify PHPI.
In the new process, a single standardized form is
used to request new indicators. The flow is divided
into two branches to optimize the time required to
fulfill the request, allowing the analysis to be carried
out under two aspects, one dealing with the metadata
and the other handling the data that enable the
calculation of the indicators. The metadata branch
assesses the similarity of the new indicator with
existing ones and with the established filling pattern;
moreover, it assigns the metadata flags, to ensure that
the indicator meets criteria that guarantee its
understandability by all stakeholders. In the data
branch, the validation focuses on ensuring the
existence and documentation of formal databases
from which the information for calculating the
indicator is extracted, establishing a single source of
correct information, hence eliminating
inconsistencies, in addition to establishing the
strategy to update the indicator. Once the quality
requirements are fulfilled and guaranteed, they are
included in the data and metadata management tool.
After the approval by the requesting office or
stakeholder, it is possible to publish the indicator and
its metadata.
In this process, an assisting automation tool
allows controlling all tasks in the flow, recording all
the interactions, from the creation of the form to the
communication with the entire chain of
responsibility, improving efficiency in the creation of
new indicators. Furthermore, we proposed a new
control entity, the PHPI coach, who oversees the
entire flow of creating new indicators, being also
Framework for Public Health Policy Indicators Governance and Metadata Quality Flags to Promote Data Literacy
289

responsible for removing impediments and resolving
conflicts associated with creating/changing PHPI.
More specifically, his/her responsibilities are:
• Controlling the time required to fulfill each
request through flow automation tools.
• Coordinating indicators updating activities,
ensuring that the designated departments
provide all the necessary data to maintain the
adequacy of use of its indicators.
• Validating not only the completion but also the
quality of the information entered in the form to
facilitate the understanding of the indicators by
stakeholders who did not directly participate in
its design.
• Encourage departments to reuse indicators
previously defined by others, so that similar
indicators are not created.
• Ensure that the indicator visualization panels are
working properly so that stakeholders can
consult them directly, without the need to create
specific requests.
5 CONCLUSION
Organizations in the public sector face critical
challenges in the use of data and digital innovation
(Bergquist et al. 2016) that, in general, increase due
to the lack of resources, be they financial or human,
which would allow them to invest in technology,
knowledge, new processes and innovations.
Moreover, there is a constant pressure to urgently
respond to the demands of society. Thus, public
organizations need simplified solutions that bring
quick and valuable results that encourage and justify
investments that support their core activity.
Regarding data governance, we could not find in
the prior literature, solutions or simplified
frameworks that were appropriate or customized for
a healthcare management environment such as the
Brazilian case, which presents time and cost
restrictions. So, the proposal of this work aims to
complement this gap in the research.
We here proposed a data governance framework
for health indicators that allows starting a governance
program in a short period of time, inspired by agile
principles that advocate value delivery, simplicity,
high level of adaptation and stakeholder involvement.
Additionally, we proposed flags to qualify PHPI
metadata, which have the advantage of providing fast
and efficient visual appeal for data qualification when
compared to numerical values. In addition, it is
possible to classify the indicators metadata in a
simple, clear and objective way, encouraging
continuous improvement actions over time, seeking
to raise their level of quality. Although the proposal
was focused on the completeness and relevance
dimensions, it could easily be adapted to consider
other dimensions of DQ. Another advantage is that
the proposal can also be extended to general data to
improve their management.
As metadata quality flags represent metrics to the
internal management regarding the implementation
of the governance of indicators, instituting them
requires analytical skills from the staff to generate,
analyze and communicate their results. Data literacy
is an ongoing process, which is customized according
to the needs of each organization and aligned with
opportunities that arise towards improving the use of
data. Therefore, the proposal of the flags can be a
starting point to contribute to shed light on the data
literacy topic in health management, under a
simplified and practical perspective as regards
creating and using PHPI.
The metadata quality flag proposal was well
accepted in the target environment and began to be
applied. Preliminary results have encouraged a
broader effort to map all the active health policies,
programs and interventions, as well as their
respective indicators across the entire MS, which
meet the objectives of effective data governance with
value delivery to support decision-making. Thus, the
framework for governance of health indicators we
proposed has achieved its main objective, as it
resulted in an approach that empowers smaller
initiatives to persuade and attract sponsors to a
broader governance program.
The proposals for improvements at the
intervention stage of the framework were crucial for
the success of the case study. Nevertheless, we
emphasize the importance of the communication
process throughout the application of the FGHI. To
carry out the collaborative construction of solutions,
with the broad participation of staff and stakeholders,
it is essential that, even during the process, there is
feedback and accountability on the evolution of the
project. We should not take their input and opinions,
without making it clear what changes are being
proposed and how those changes impact their work
routines and resolve their pain points. Constant
feedback is needed, highlighting their contribution,
making them feel an integral part of the process. This
sense of belonging to the process and project
stimulates adoption and facilitates breaking
organizational inertia, helping to introduce the data-
driven culture. In our case study, the communication
process materialized through workshops for
DATA 2022 - 11th International Conference on Data Science, Technology and Applications
290

appreciation, evaluation, dissemination, and
coaching. The meetings and activities were adapted
and targeted to specific audiences within the process.
Publicizing the results and the success of the initiative
was important to attract sponsors for the continuity of
the project, broadening the scope of the governance
program, starting from PHPI and expanding to public
health interventions.
As future work, we consider the extension of the
proposed flags to qualify health policies, programs
and interventions.
ACKNOWLEDGEMENTS
This research was funded by Pan American Health
Organization – World Health Organization (PAHO -
WHO) under LOA SCON 2020-00116.
The authors would like to acknowledge the
support of the Department of Monitoring and
Evaluation of SUS of the Executive Secretariat of the
Brazilian Ministry of Health (DEMAS/SE-MS), on
behalf of its coordinating officers, Dr. Márcia Ito,
Carlos Eduardo da Silva Sousa, and Átila Szczecinski
Rodrigues.
REFERENCES
Baez-Camargo, C., and E. Jacobs. 2011. “Claudia Baez-
Camargo Eelco Jacobs A Framework to Assess
Governance of Health Systems in Low Income
Countries Basel Institute on Governance.” Basel
Institute on Governance, no. 11.
Batini, Carlo, Daniele Barone, Federico Cabitza, and
Simone Grega. 2011. “A Data Quality Methodology for
Heterogeneous Data.” International Journal of
Database Management Systems 3 (1): 60–79.
https://doi.org/10.5121/ijdms.2011.3105.
Bergquist, Magnus, Jan Ljungberg, Björn Remneland
Wikhamn, Bertil Remneland, and Bertil Rolandsson.
2016. “Digital Innovation and Public Institutions:
Challenges and Opportunities.” In .
Bonikowska, Aneta, Claudia Sanmartin, and Marc Frenette.
2019. “Analytical Studies : Methods and References
Data Literacy : What It Is and How to Measure It in the
Public Service.” Analytical Studies: Methods and
References, no. 11.
Bossen, Claus, Kathleen H Pine, Federico Cabitza, Gunnar
Ellingsen, and Enrico Maria Piras. 2019. “Data Work in
Healthcare: An Introduction.” Health Informatics
Journal 25 (3): 465–74. https://doi.org/10.1177/1460
458219864730.
Brasil. 2012. Ministério Da Saúde. Gabinete Do Ministro.
PORTARIA N° 406, DE 8 DE MARÇO DE 2012.
https://bvsms.saude.gov.br/bvs/saudelegis/gm/2012/prt
0406_08_03_2012.html.
Casa Civil da Presidência da República. 2018. “Avaliação
de Políticas Públicas: Guia Prático de Análise Ex Post.”
Casa Civil Da Presidência Da República. 2 (Brasília,
DF: Casa Civil da Presidência da República): 318.
https://www.ipea.gov.br/portal/images/stories/PDFs/li
vros/livros/181218_avaliacao_de_politicas_publicas_v
ol2_guia_expost.pdf.
CDC. 2011. “Introduction to Program Evaluation for Public
Health Programs: A Self-Study Guide.” Program
Performance and Evaluation Office (PPEO), no.
October: 103. https://www.cdc.gov/eval/guide/index.
htm.
CMMI Institute. 2014. Data Management Maturity Model
(DMM).
DAMA International. 2017. DAMA-DMBOK Data
Management Body of Knowledge. Technics
Publications Llc.
Edelstein, Michael, Lisa M. Lee, Asha Herten-Crabb,
David L. Heymann, and David R. Harper. 2018.
“Strengthening Global Public Health Surveillance
through Data and Benefit Sharing.” Emerging
Infectious Diseases 24 (7): 1324–30.
https://doi.org/10.3201/eid2407.151830.
Fraser-Arnott, Melissa. 2020. “Academic Library COVID-
19 Subject Guides.” The Reference Librarian 61 (3–4):
165–84. https://doi.org/10.1080/02763877.2020.186
2021.
Gummer, Edith S, and E Mandinach. 2015. “Building a
Conceptual Framework for Data Literacy.” Teachers
College Record 117.
Henke, Nicolaus, Jacques Bughin, Michael Chui, James
Manyika, Tamim Saleh, Bill Wiseman, and Guru
Sethupathy. 2016. “The Age of Analytics: Competing
in a Data-Driven World.” McKinsey & Company, no.
December. http://www.mckinsey.com/business-
functions/mckinsey-analytics/our-insights/the-age-of-
analytics-competing-in-a-data-driven-world.
ISO/IEC 25012:2008. 2015. “Software Engineering —
Software Product Quality Requirements and Evaluation
(SQuaRE) — Data Quality Model,” 13.
https://www.iso.org/standard/35736.html.
ISO/IEC 25012. 2006. “Software Engineering—Software
Product Quality Requirements and Evaluation
(SQuaRE)— Data Quality Model.” International
Organization for Standardization.
Jackson, Lisa, and David Pencheon. 2008. “The Good
Indicators Guide: Understanding How to Use and
Choose Indicators.” NHS, 1–40. papers3://publication/
uuid/A750194F-0E7A-4F04-975D-8D95329550BE.
Jamaluddin, Mohammad Yusri. 2019. “The Case for Data
Literacy in Public Sector Organizations.” Michigan
State University Extension, November 2019.
https://www.canr.msu.edu/news/the-case-for-data-
literacy-in-public-sector-organizations.
Janssen, Marijn, Paul Brous, Elsa Estevez, Luis S. Barbosa,
and Tomasz Janowski. 2020. “Data Governance:
Organizing Data for Trustworthy Artificial Intelligence.”
Framework for Public Health Policy Indicators Governance and Metadata Quality Flags to Promote Data Literacy
291

Government Information Quarterly 37 (3): 101493.
https://doi.org/10.1016/j.giq.2020.101493.
Jayawardene, Vimukthi, Shazia Sadiq, and Marta Indulska.
2013. “An Analysis of Data Quality Dimensions.”
ITEE Technical Report No. 2013-01 01: 1–32.
http://espace.library.uq.edu.au/view/UQ:312314/n201
3-01_TechnicalReport_Jayawardene.pdf.
Jr., José Celso Cardoso, and Alexandre dos Santos Cunha.
2015. Planejamento e Avaliação de Políticas Públicas.
Kleckner, Anna. 2020. “Healthcare Data Literacy: A Must-
Have for Becoming a Data-Driven Organization.”
Health Catalyst, February 2020. https://www.health
catalyst.com/insights/improving-healthcare-data-
literacy/.
Loshin, David. 2009. Master Data Management. Elsevier.
https://doi.org/10.1016/B978-0-12-374225-4.X0001-X.
Merino, Jorge, Ismael Caballero, Bibiano Rivas, Manuel
Serrano, and Mario Piattini. 2016. “A Data Quality in
Use Model for Big Data.” Future Generation Computer
Systems 63 (October): 123–30. https://doi.org/10.1016/
j.future.2015.11.024.
Mikkelsen-Lopez, Inez, Kaspar Wyss, and Don De
Savigny. 2011. “An Approach to Addressing
Governance from a Health System Framework
Perspective.” BMC International Health and Human
Rights 11: 13. https://doi.org/10.1186/1472-698X-11-
13.
Moralee, Simon, and Karen Sweeney. 2012. “Problem-
Based Learning in Health Care Management:
Reflecting the World out There.” Gateway Papers 2
(1938): 33–60.
Nature. 2020. “Coronavirus in Charts: The Fact-Checkers
Correcting Falsehoods.” Nature, May 29, 2020.
https://doi.org/10.1038/d41586-020-01136-8.
Ochoa, Xavier, and Erik Duval. 2006a. “Towards
Automatic Evaluation of Learning Object Metadata
Quality.” In , 372–81. https://doi.org/10.1007/1190888
3_44.
——. 2006b. “Use of Contextualized Attention Metadata
for Ranking and Recommending Learning Objects.” In
Proceedings of the 1st International Workshop on
Contextualized Attention Metadata: Collecting,
Managing and Exploiting of Rich Usage Information -
CAMA ’06, 9. New York, New York, USA: ACM
Press. https://doi.org/10.1145/1183604.1183608.
OECD. 2020. “Why Open Science Is Critical to Combatting
COVID-19.” Policy Responses to Coronavirus
(COVID-19), May 12, 2020. https://www.oecd.org/
coronavirus/policy-responses/why-open-science-is-cri
tical-to-combatting-covid-19-cd6ab2f9/#endnotea0z2.
OPGH. 2021. “Pesquisadores e Jornalistas Fazem a
Vigilância Dos Dados Da Pandemia.” Observatorio de
Politica e Gestao Hispitalar, 2021. https://observatorio
hospitalar.fiocruz.br/conteudo-interno/pesquisadores-e
-jornalistas-fazem-vigilancia-dos-dados-da-pandemia.
Pedersen, Alex Young, and Francesco Caviglia. 2019.
“Data Literacy as a Compound Competence.” In , 166–
73. https://doi.org/10.1007/978-3-030-02351-5_21.
Rabinowitz, Phil. 2014. “Identifying and Analyzing
Stakeholders and Their Interests.” In Communications
to Promote Interest and Participation.
Riley, Jenn. n.d. Understanding Metadata What Is
Metadata, And What Is It For? www.niso.org.
Sellera, Paulo Eduardo Guedes et. al. 2019. “The
Implementation of the Monitoring and Evaluation
System of the State Health Secretariat of the Brazilian
Federal District (SHS/DF).” Ciência & Saúde Coletiva
24 (6): 2085–94. https://doi.org/10.1590/1413-
81232018246.07952019.
Sidi, F., Payam Hassany Shariat Panahy, L. S. Affendey,
M. A. Jabar, H. Ibrahim, and A. Mustapha. 2012. “Data
Quality: A Survey of Data Quality Dimensions.” In
2012 International Conference on Information
Retrieval & Knowledge Management, 300–304. IEEE.
https://doi.org/10.1109/InfRKM.2012.6204995.
Vidgen, Richard, Sarah Shaw, and David B. Grant. 2017.
“Management Challenges in Creating Value from
Business Analytics.” European Journal of Operational
Research 261 (2): 626–39. https://doi.org/10.1016/
j.ejor.2017.02.023.
Winter, Laura. 2020. “Data Fog: Why Some Countries’
Coronavirus Numbers Do Not Add up.” Al Jazeera,
June 17, 2020. https://www.aljazeera.com/features/
2020/6/17/data-fog-why-some-countries-coronavirus-
numbers-do-not-add-up.
Wolff, Annika, Daniel Gooch, Jose J. Cavero Montaner,
Umar Rashid, and Gerd Kortuem. 2016. “Creating an
Understanding of Data Literacy for a Data-Driven
Society.” The Journal of Community Informatics 12
(3): 9–26. https://doi.org/10.15353/joci.v12i3.3275.
Yaakoubi, Mohammed El, Pascal Ravesteijn, Annette
Prinsen, Holger Hooimeijer, and Michiel Van Der Ven.
2020. “Data Driven Decision Support: The Role of the
Controller in Decision-Making Processes.”
Proceedings of the 16th European Conference on
Management Leadership and Governance, ECMLG
2020, no. October: 73–80. https://doi.org/10.34190/
ELG.20.026.
Zarpelam, Juliana Bertello, and Marcelo Pereira Da Silva.
2020. “Application of GUT Matrix in Prioritizing Tasks
in the Financial Sector of a Beverage Company.” Anais
APREPRO, 1–12.
Zhang, Hui, and Jianying Xiao. 2020. “Quality Assessment
Framework for Open Government Data.” The
Electronic Library 38 (2): 209–22. https://doi.org/10.11
08/EL-06-2019-0145.
DATA 2022 - 11th International Conference on Data Science, Technology and Applications
292
