
Comprehensive Risk Assessment and Spatial Pattern Analysis of
COVID-19 of China
Man Xie
1a
, Xiling Wu
1,2,* b
and Chiping Yuan
1,3 c
1
School of Economics and Trade, Guangzhou Xinhua University, Dongguan, Guangdong, China
2
School of Economics and Trade, Guangdong University of foreign studies, Guangzhou, Guangdong, China
3
Institute of Guangdong Hong Kong and Macao Development Studies, Sun Yat-sen University, Xingang West Road,
Guangzhou, Guangdong, China
Keywords: COVID-19, Risk Assessment, Spatial Agglomeration, Exploratory Spatial Data Analysis.
Abstract: The outbreak of COVID-19 has a certain impact on China, an objective assessment of COVID-19 risk is of
great significance for epidemic preparedness and public health management. In this paper, the spatial
distribution pattern and spatial aggregation pattern of comprehensive risk of COVID-19 are studied by
constructing an index system of COVID-19 with using an exploratory spatial data analysis method. The
results show that the overall Moran's I index of comprehensive risk is 0.2417, indicating that there is a
positive spatial correlation and a significant spatial clustering feature. The comprehensive risk distribution
of COVID-19 in some regions follows the characteristics of geographical proximity, and there is a risk of
transmission between regions. Tianjin, Hubei, Sichuan, Liaoning, Shanghai and Hainan are the areas with
high comprehensive risk of COVID-19, while the low risk areas are Guangdong, Yunnan, Tibet, Shanxi,
Qinghai, Ningxia and Xinjiang. There are 13 regions with low-low clustering pattern (LL), there are 5
regions with high-high clustering pattern (HH). According to the distribution of comprehensive risk, we
should formulate prevention, control and emergency response strategies, strengthen the construction of
public health facilities and training of medical professional and technical personnel, and reduce the level of
epidemic risk.
1 INTRODUCTION
1
Corona Virus Disease 2019, or COVID-19, was
named by the World Health Organization. Since
December 2019, some hospitals in Wuhan, Hubei
Province have found a number of unexplained
pneumonia cases with a history of exposure to the
seafood market in South China, which has been
confirmed to be an acute respiratory infectious
disease caused by the 2019 novel corona-virus
infection. Chinese government departments quickly
launched a first-level response to major public health
emergencies. The epidemic is highly and fast
infectious, leading to the outbreak of a massive
public health crisis across the country, posing a
certain threat to urban public health safety.
The rapid spread of COVID-19 is a global public
health challenge. As of 24:00 on June30, 2021,
a
https://orcid.org/0000-0002-0186-3436
b
https://orcid.org/0000-0001-6118-5377
c
https://orcid.org/0000-0002-4739-8090
according to 31 provinces (autonomous regions,
municipalities directly under the Central
Government) and Xinjiang Production and
Construction Corps, 421 confirmed cases (including
7 severe cases), a total of 78,479 discharged cases,
4,634 deaths and 83,534 confirmed cases were
reported. After the outbreak of the epidemic, the
government promptly launched an emergency
response and resolutely took a series of public
emergency measures. Many places in China
resolutely took measures such as nucleic acid
testing, community control, and personnel isolation
to prevent the spread of the epidemic. All 31
provinces (autonomous regions and municipalities
directly under the Central Government) have
experienced COVID-infected people, with a wide
range and strong infectivity.
Number of beds in hospitals, medical resources,
rescue teams and other resources exposed regional
gaps, which also showed the difference of the
prevalence and mortality of COVID-19 in different
regions. In addition, the improvement of the
Xie, M., Wu, X. and Yuan, C.
Comprehensive Risk Assessment and Spatial Pattern Analysis of COVID-19 of China.
DOI: 10.5220/0011233000003438
In Proceedings of the 1st International Conference on Health Big Data and Intelligent Healthcare (ICHIH 2022), pages 107-114
ISBN: 978-989-758-596-8
Copyright
c
2022 by SCITEPRESS – Science and Technology Publications, Lda. All rights reserved
107

interurban transportation system accelerated the
spread of epidemic among regions, and so did the
spatial proximity. How to evaluate and analyse the
risks of the epidemic in various places objectively
and comprehensively, classify the risk levels in
different regions, provide a theoretical basis for
epidemic prevention has become the focus of
scholars at present. In view of this, it is very
necessary to explore the regional risk index and
pattern of COVID-19 and its spatial distribution
mode deeply, so as to provide theoretical guidance
for the prevention and control of the epidemic, and
draw lessons from experience for public health risk
management.
In this paper, the spatial distribution pattern and
spatial aggregation pattern of comprehensive risk of
COVID-19 are studied by constructing an index
system with using an exploratory spatial data
analysis method, which may deepen the
understanding of the spatial nature of the epidemic
distribution, supplement the lack of ignoring spatial
autocorrelation in the modelling of the distribution
of infectious diseases in traditional studies. At the
same time, this paper may provide an assistance of
resource allocation to response to COVID-19 and
even provide an effective method or perspective for
scientifically understanding the risk of epidemic in
various regions.
2 LITERATURE REVIE
The outbreak of COVID-19 has a phased impact on
China's economy growth. Economic growth rate in
2020 was reversed from low before high in 2020 (Jia
2020). Wang Xuyang et al. (2020) focused on a
prediction analysis in Hubei Province based on the
index smoothing model, and the model fits well and
can be used for COVID-19 epidemic prediction, to
ensure the normal production and operation order of
enterprises, and reduce the negative impact on the
economy.
Pan Jiahua (2020), from the perspective of urban
spatial pattern and urban form, believes that urban
spatial aggregation, pattern differentiation and
spatial planning concept affect the spread and
diffusion of the epidemic to a certain extent, which
is the objective condition for the aggravation of
disaster impact. The spread of COVID-19 epidemic
is in line with the law of geographical proximity
(Zeng et al. 2020), especially in the intercity
communication stage, and the spatial adjacent
diffusion effect is obvious (Liu and Jin 2020). Liu
Yi et al (2020) analyzed the spatial and temporal
diffusion characteristics of COVID-19 cases in
Guangdong Province and the spatial differences in
the spread and change of the epidemic in various
prefecture-level cities, and found that the diffusion
risk of medium-tier cities is high but the
comprehensive risk is at the medium level, and the
diffusion risk of developed cities is low but the
highest of comprehensive risk. Liang Ze et al (2020)
took 282 cities in China as the basic research unit.
They explored the impact of urban population
migration and socio-economic factors on COVID-19
incidence through geographical weighted regression
method, and found that the migration rate in Wuhan
greatly increased the incidence of COVID-19 in
surrounding cities of Wuhan, and the effect presents
spatial attenuation characteristics with the increase
of geographical distance from Wuhan (except in
northeast and southwest regions).
In the literature of COVID-19, most of the
samples were conducted in Hubei Province. For
example, Lv Zhenhua and Cheng Shaowen (2020)
used Crystal Ball and GIS to analyze the space-
temporal characteristics of COVID-19 development,
and found a spatial correlation between cities in the
risk areas of Hubei Province. But Wuhan is the only
area of high-low diffusion in Hubei province. Li
Chenxi et al. (2020), Liu Xun et al. (2020) analyzed
the spatial pattern of COVID-19 epidemic in Hubei
Province and explored its spatial and temporal
aggregation by using the ESDA method and GIS,
respectively. In view of this, from the perspective of
geography, it is very necessary to explore the
regional risk index and pattern of COVID-19 and its
spatial distribution mode deeply, so as to provide
theoretical guidance for the prevention and control
and planning of the epidemic, and draw lessons from
experience for public health risk management.
3 CONSTRUCTION OF COVID-19
COMPREHENSIVE RISK
ASSESSMENT SYSTEM
Risk assessment is the premise of risk management,
and plays a very important role in the whole process
of epidemic prevention control and treatment. Based
on the triangle model of the public safety system, the
risk assessment model is constructed from the three
edges of the triangle, respectively (showed in Fig.1).
ICHIH 2022 - International Conference on Health Big Data and Intelligent Healthcare
108
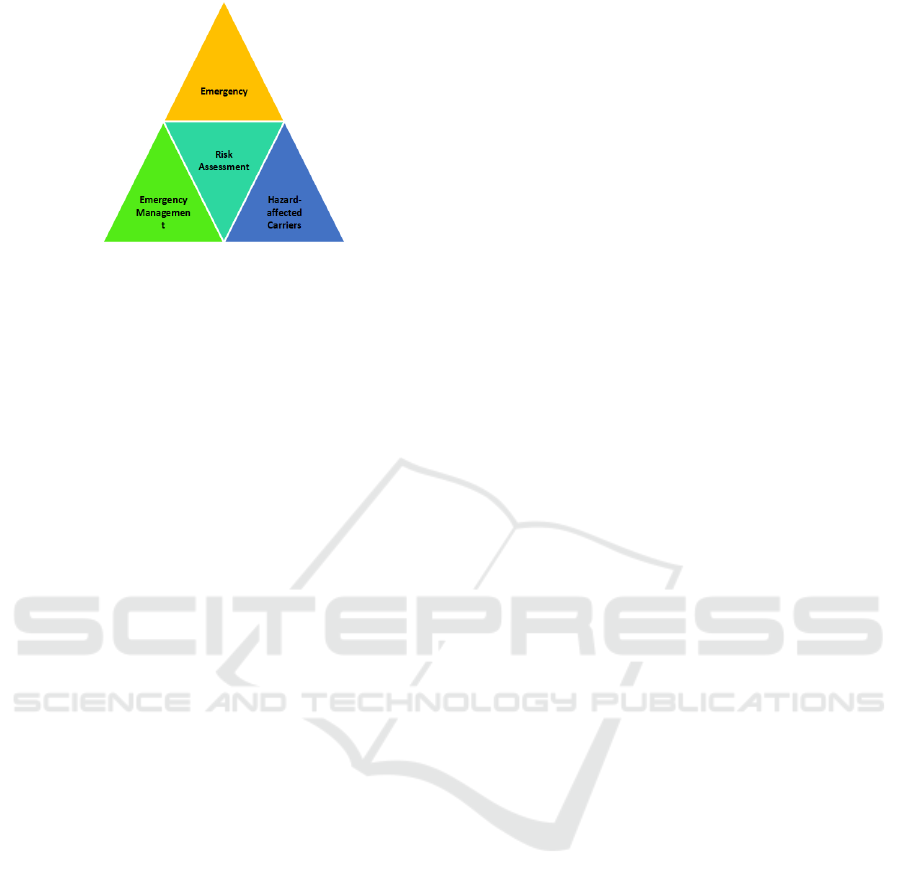
Figure 1: Public safety risk assessment "triangle" model
The first edge of the "triangle" model is
emergency, which refers to virus outbreak risk of
COVID-19. In this article, we use the prevalence
rate of 10,000 and the fatality rate to reflect the risk
of COVID-19. The prevalence rate of 10,000 people
equals the number of confirmed cases divided by the
resident population (10,000), and the fatality rate
equals to the number of deaths divided by the
number of confirmed cases.
The second edge is the Hazard-affected Carriers.
In the field of public safety, we believe that the most
vulnerable disaster carrier that needs protection is
people. According to the early summary of 44,672
cases in the China Centre for Disease Control and
Prevention Weekly, it found that age had a great
impact on mortality, and deaths mainly occurred in
older people. The report revealed that child case
symptoms are relatively mild, children aged 0 to 9
died of infection was 0, and no deaths in cases
younger than 30 basically. Patients under 50 died
below 1%, increasing only in the elderly and with a
poor prognosis. Therefore, the Vulnerability of
Hazard-affected Carriers is reflected by the
proportion of the elderly population over 60 in the
total population at the end of the year. The higher
the proportion indicates that the greater the
vulnerability of Hazard-affected carriers and the
higher comprehensive risk of COVID-19 in the
region.
Due to the characteristics of disaster carrier
mobility, the series of methods adopted after the
COVID-19 outbreak are: detection of sources of
infection, isolation of high-risk people, and traffic
control in high-risk areas. Relevant studies also
show that the spatial distribution of epidemic risk is
not random and is partly affected by spatial
transmission in adjacent areas. Therefore, to a large
extent, measures such as "lockdown cities" and
restricting travel can curb the spatial spread of the
epidemic. The impact of population mobility caused
by the property of convenient transportation
aggravates the spatial risk of the epidemic, which
specifically shows at the two aspects of population
inflow and outflow. Population inflow may increase
the risk of the local epidemic, while population
outflow, especially in the key epidemic areas, may
lead to the risk of external spread and increase the
scope of the spatial spread. The intercity
communication and family-oriented local
communication brought about by population flow
constitute a two-stage model of the spread of the
epidemic in China, shaping the spatial and temporal
pattern of the epidemic (Liu and Jin 2020).
Population migration, transportation, economy and
other factors are internally related to the
transmission of COVID-19 (Qi et al. 2020). So this
paper will uses population mobility to reflect The
vulnerability of Hazard-affected carriers. The
stronger the regional population mobility, the higher
the transmission rate will be, and the new
coronavirus comprehensive risk will be higher.
Population mobility is represented by the number of
travel per capita (passenger volume / average
population) and the per capita travel distance
(passenger turnover / average population).
The third edge is emergency management, which
is designed to ensure public health and safety. The
outbreak of COVID-19 has shown us the importance
of building a strong public health system. Li Liming
(2021) believes that public health is the guard of
national health, and the comprehensive public health
capacity is an important symbol of the government's
modern disease construction system and the fine
social management. This research reveals the
importance of reform and improvement of the public
health system. For example, in early January 2020,
the mortality rate in Wuhan was much higher than in
other rest of China. This distorted mortality rate was
due to the serious lack of hospital care among many
infected people, and the lack of disease control
resources seriously affected the control of the
epidemic.
The study adopts three secondary indicators,
including emergency medical facilities, emergency
command facilities and emergency support effect.
The differences in population base and medical
levels in different regions are the impact of the
epidemic. Emergency medical facilities adopt the
number of beds in medical institutions per 10,000
people(units), the number of medical and health
institutions (units), the number of health personnel
per 10,000(10,000 person), the number of outpatient
and inpatient medical assistance (10,000 person-
times).
Comprehensive Risk Assessment and Spatial Pattern Analysis of COVID-19 of China
109

The emergency command facilities adopt the
number of community service institutions and
facilities per 10,000 people, the total number of real-
name volunteers (10,000), and the number of
emergency equipment (units) as its indicators.
Since the outbreak of the COVID-19 epidemic,
the community has played a role as a "battle
fortress" in the epidemic prevention and control for
external import and internal proliferation. The work
of community service agencies is relatively trivial,
including door-to-door investigation, urging
gatherings, banquets and other gathering activities,
disinfection, providing materials during home
observation or isolation, errands, psychological
counselling and other services. Volunteers in
COVID-19 are a "red barrier" for epidemic
prevention and control, and have become a beautiful
scenery for epidemic prevention and control.
Technical and equipment support is also very
important, which can effectively improve the
response and deal with emergencies. Such as crawler
intelligent disinfection campaign robot, outdoor
epidemic prevention disinfection robot, family
epidemic prevention emergency package, multi-
functional intelligent protection all-in-one machine,
new energy health epidemic prevention elimination
vehicles, epidemic prevention mass fog elimination
robot, fire emergency fire prevention vehicles,
hospital centre attract system emissions inactivation
device, folding aluminium magnesium alloy
equipment box material handling box, unmanned
aerial vehicles, etc.
The effect of emergency support is reflected by
the number of cured and discharged people / the
number of confirmed patients, which reflects the
scientific response and treatment effect of the
epidemic. Considering the difficulty of obtaining
some data and the systematicness and integrity of
the whole index system, based on the principles of
comprehensiveness, typicality, operability and so on,
the selection of indicators at all levels is as shown in
Table 1. The weight of each layer index is obtained
by fuzzy analysis method. The calculation formula
of Novel Coronavirus Comprehensive Risk
Evaluation Index (short for CREI) is:
Comprehensive Risk Evaluation Index of
COVID-19= (Virus outbreak risk
×The vulnerability
of disaster victims) / effectiveness of emergency
guarantee
Table1: Comprehensive risk evaluation index system of COVID-19
First-level Indicators Second-level Indicators Third-level Indicators
Virus outbreak risk
Prevalence rate of 10,000 Number of confirmed cases/Resident Population (10,000)
The fatality rate Number of deaths/confirmed cases
The vulnerability of
Hazard-affected
carriers
Proportion of aged population Population over 60 years old/total population at year-end
Population mobility
travel per capita = passenger volume/average population
Per capita travel distance = passenger turnover / average
p
o
p
ulation
Effectiveness of
emergency support
Emergency medical facilities
Number of beds in medical institutions per 10,000 people
(sheet)
Number of Medical and health institutions
Number of health workers per 10,000 (10,000)
Number of outpatient and inpatient medical assistance
(10,000 person-times)
Emergency command facility
Number of community service agencies and facilities per
10,000 people
Total number of real-name volunteers (10,000)
Number of Emergency equipment (units)
Emergency support effect
Number of cured and discharged patients/number of
confirmed patients
ICHIH 2022 - International Conference on Health Big Data and Intelligent Healthcare
110

4 RESEARCH METHODS AND
DATA SOURCES
4.1 Research Methods
This paper uses an exploratory spatial data analysis
method. The Exploratory Spatial Data Analysis
(ESDA) includes global and local auto-correlation
analysis, which focuses on spatial correlation
measures to describe and display the spatial
distribution of the studied objects, and to reveal
spatial connections as well as spatial patterns. And
the global auto-correlation analysis is the
dependence and heterogeneity of a research object
on the regional space, and the formula is as
followed:
==
==
=
n
11
2
n
1i
n
1j
jiij
)-)(-(
IMoran
i
n
j
j
WiS
YYYYW
(1)
In equation (1), variety
==
=−=
n
i
i
n
i
i
YYYYS
11
2
n
1
)(
n
1
. n
is the total number of study regions, Yi represents
the observation of the I region, that is
Comprehensive Risk Evaluation Index of COVID-19
of the i region, W
ij
is the spatial weight matrix, and
i,j represents the region i and regional j. In this
paper, if Moran's I >0, it indicated that areas with
similar comprehensive risk levels tend to gather
together. If Moran's I <0, it indicates that areas with
high and low comprehensive risk levels exist in the
same region, with great spatial differences. If
Moran's I =0, there is no spatial dependence between
regions.
Local auto-correlation analysis often uses Moran
scatter map (or Moran plot) that can refine the local
characteristics and changes of the analysis space.
The scatter map is divided into four quadrants, the
first of which is high-high agglomeration (HH),
indicating a high comprehensive risk level in both
the region itself and the surrounding areas. The
second quadrant is low-high agglomeration (LH),
indicating that areas with lower COVID-19
comprehensive risk levels are surrounded by areas
with higher peripheral risk levels. The third quadrant
is low-low agglomeration (LL), with the low
comprehensive risk level in the region itself and the
surrounding areas. The fourth quadrant is high and
low agglomeration (HL), where areas with high risk
level of comprehensive coronavirus are surrounded
by areas with lower risk levels. The first and three
quadrants are typical regions, while the second and
four quadrants are atypical regions (spatial outlier).
4.2 Data Source
The sample is from 31 provinces (cities and
autonomous regions) of China, and the data comes
from the National Health Commission, the National
Bureau of Statistics, China Emergency Information
Network, Public Health Science Data Centre, the 7th
National Census Bulletin, and local social statistics
bulletin, China Statistical Yearbook, China
Yearbook of Civil Affairs Statistics and China City
Statistical Yearbook. And data on COVID-19 cases
were available as of June 30, 2021. The proportion
of the elderly population adopts the seventh census
data in 2021. The total number of real-name
volunteers and the number of emergency equipment
are the latest statistical data of the emergency
information network, and the other indicators are the
data of 2020.
5 RESULTS ANALYSIS
5.1 Space and Temporal Distribution
As of June 30, 2021, the region with the largest
number of confirmed cases in China was
concentrated in Hubei (68,162). As showed in Table
2, Wuhan, Hubei, is the most severe city, followed
by Guangdong (2,759), Shanghai (2,222 cases),
Heilongjiang (1,612), Zhejiang (1,386), Henan and
Hebei (all 1,317), Sichuan (1,109), Beijing (1,078),
Hunan (1,061), Anhui (1,008), and the total number
of cases in other regions were below 1,000.
The spread of novel coronavirus is increased due
to its geographical proximity to Hubei Province,
especially the closest cities to Wuhan, such as
Henan Xinyang, Zhengzhou, Nanyang, Zhumadian,
Hunan Changsha, Yueyang, Anhui Hefei, Bengbu,
Bozhou, Fuyang, Jiangxi Nanchang, Shangrao,
Xinyu, Jiujiang and Chongqing Wanzhou district. In
addition, as an economically developed trade centre,
a transportation centre, and a political and cultural
centre, they are often the centre of the spread of the
epidemic. Due to the large number of migrant
workers in Wuhan, Hubei Province, its flow with
Guangzhou, Shenzhen, Wenzhou, Hangzhou,
Ningbo is very frequent. Therefore, the number of
COVID-19 infections in Beijing, Shanghai,
Guangdong, Zhejiang and so forth are larger.
Comprehensive Risk Assessment and Spatial Pattern Analysis of COVID-19 of China
111
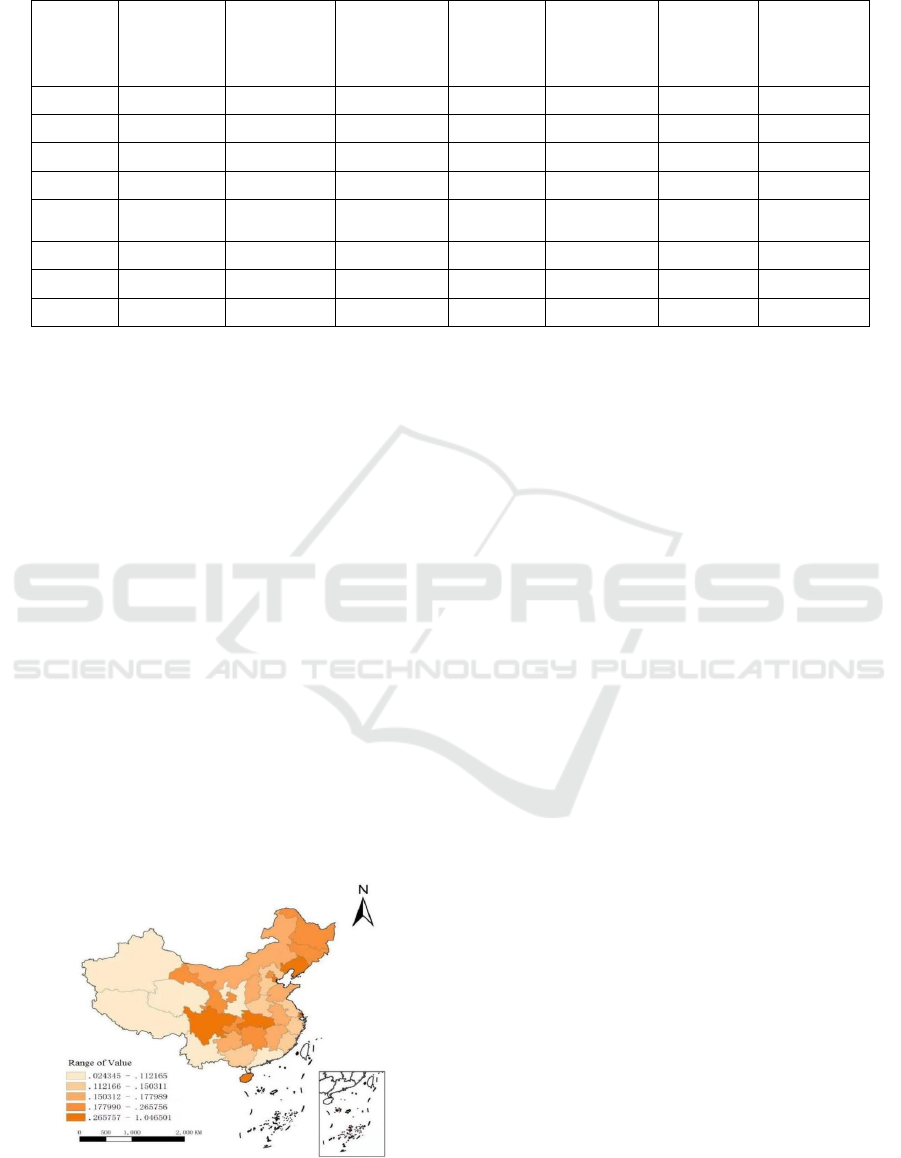
Table 2: The cumulative number of confirmed COVID-19 cases (As of June 30,2021).
Region
Number of
Confirmed
cases
(person)
Region
Number of
Confirmed
cases
(person)
Region
Number of
Confirmed
cases
(person)
Region
Number of
Confirmed
cases
(person)
Beijing 1078 Heilongjiang 1612 Shandong 883 Chongqing 601
Tianjin 402 Shanghai 2222 Henan 1317 Sichuan 1109
Hebei 1317 Jiangsu 743 Hubei 68162 Guizhou 147
Shanxi 253 Zhejiang 1386 Hunan 1061 Yunnan 446
Inner
Mon
g
olia
394 Anhui 1008 Guangdong 2759 Tibet 1
Liaoning 430 Fujian 688 Guangxi 276 Shaanxi 629
Jilin 573 Jiangxi 937 Hainan 188 Gansu 195
Qinghai 18 Ningxia 76 Xinjiang 980
Data sources: Public Health Science Data Center
According to CREI of COVID-19 calculated by
the comprehensive index system, 31 provinces and
autonomous regions in China are divided into 5
levels, with lowest-risk, lower-risk, medium-risk,
higher-risk and highest-risk. Highest-risk areas (risk
index 0.2657-1.0465) include Tianjin, Hubei,
Sichuan, Liaoning, Shanghai and Hainan; The
higher-risk areas (risk index 0.1779-0.2657) include
Gansu, Hunan, Chongqing, Heilongjiang, Jilin and
Beijing; Medium-risk areas (risk index 0.1503-
0.1779) include Shanxi, Inner Mongolia, Anhui,
Jiangxi, Guizhou and Shandong; Lower-risk areas
(risk index 0.1121-0.1503) include Hebei, Jiangsu,
Fujian, Henan, Guangxi and Zhejiang; Lowest-risk
areas (risk index 0.0243-0.1121) are Guangdong,
Yunnan, Tibet, Shaanxi, Qinghai, Ningxia, and
Xinjiang. The COVID-19 risk area at all levels has
the characteristics of spatial agglomeration. In
general, the comprehensive risk in the northwest and
southwest regions is relatively low, and the
comprehensive risk in the eastern and central regions
is high(showed in Fig.2).
Figure 2: Spatial distribution of CREI of COVID-19.
Note: Based on the standard under-drawing
GS(2016) 2892 map review system of Natural
Resources, not modified. Due to data difficulties,
this study does not include Hong Kong, Taiwan and
Macau
Combined with the index system and original
data, the difference between the regions of
comprehensive risk level is related with public
health service system construction, medical service
system organization imbalance and emergency
service supply capacity. For example, some regional
hospitals and community service institutions is less
in quantity and small in scale, and health technical
personnel reserve is backward with talent draining.
Therefore, the areas in the process of the epidemic,
measures such as diagnosis and treatment,
comprehensive isolation and cut off the transmission
channels was unable to meet the demand of
confirmed treatment and isolation.
5.2 Correlation Analysis
The Moran index of CREI is 0.2417 and the P value
is 0.01. As showed in Fig.3, it implies that the
spatial distribution is not completely random state,
but a spatial agglomeration between similar values,
that is, a positive spatial correlation, which shows
that the areas of higher and high-tech comprehensive
risk are close to each other, and the regions with low
high-tech comprehensive risk are also close to the
spatial relationship structure, and the regions are
relatively concentrated.
ICHIH 2022 - International Conference on Health Big Data and Intelligent Healthcare
112
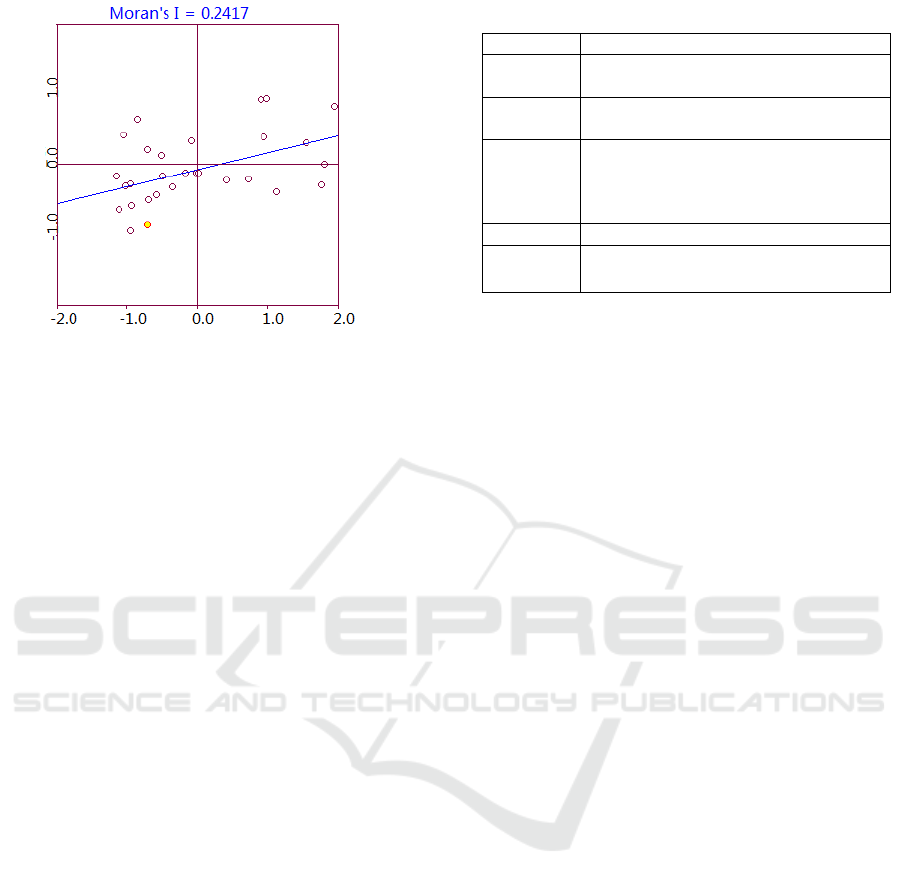
Figure 3: Moran plot of CREI of COVID-19.
About 58% of the regions are typical areas in
positive correlation (including HH and LL), among
which the high-high agglomeration mode (HH)
includes Heilongjiang, Jilin, Liaoning, Guangxi and
Yunnan, which have a relatively high comprehensive
risk and the surrounding areas. There are many areas
belonging to the low-low agglomeration mode (LL),
including Xinjiang, Tibet, Qinghai, Gansu, Hebei,
Shaanxi, Shaanxi, Shanxi, Zhejiang, Jiangsu,
Shanghai, Shandong, Henan and Tianjin. The
comprehensive risk level of these regions and
neighbouring areas is low, forming a low-risk
agglomeration belt. Belonging to the low-high
agglomeration mode (LH) are Inner Mongolia,
Fujian, Hunan, Chongqing and Jiangxi, which have
low comprehensive risk and are surrounded by the
high-risk areas. Ningxia, Guangdong, Anhui and
Hubei are the High and Low Cluster Mode (HL).
The comprehensive risk of the new regions is high
and the risk level of the surrounding areas is
relatively low. Sichuan, Beijing and Hainan are
across two quadrants, belonging to the LL and HL
modes, and Guizhou across the HH and HL
quadrants. The HL and LH regions are atypical
regions, namely spatial outlier states, showing that
the degree of spatial difference in the new
coronavirus risk is relatively large (showed in
Table.3).
Table 3: Distribution of Moran scatter plots
T
yp
e Provincial Administrative Re
g
ions
HH
Heilongjiang, Jilin, Liaoning, Guangxi,
Yunnan
LH
Inner Mongolia, Fujian, Hunan,
Chon
gq
in
g
, Jian
g
xi
LL
Xinjiang, Tibet, Qinghai, Gansu,
Hebei, Shaanxi, Shanxi, Zhejiang,
Jiangsu, Shanghai, Shandong, Henan,
Tian
j
in
HL Nin
g
xia, Guan
g
don
g
, Anhui, Hubei
Across
Quadrants
Sichuan, Beijing, Hainan(LL&HL),
Guizhou(HH&HL)
6 CONCLUSIONS
Considering the influence of spatial factors, we
established a Comprehensive Risk Evaluation Index
system of COVID-19 with using exploratory spatial
data analysis, and calculated the index of 31
provinces (cities, autonomous regions), to drew the
following conclusions: Tianjin, Hubei, Sichuan,
Liaoning, Shanghai, Hainan are areas with high
comprehensive risk, while Guangdong, Yunnan,
Tibet, Shaanxi, Qinghai, Ningxia and Xinjiang are
the low-risk areas. In general, the comprehensive
risk of COVID-19 in the northwest and southwest is
relatively low, and the risk in the east and central
regions is high. China's CREI presents a significant
positive correlation in space. The CREI in most
regions is a typical region of (HH and LL), forming
high-high agglomeration and low-low
agglomeration modes. The CREI of Shanghai,
Zhejiang, Jiangsu, Anhui, Henan, Hunan and other
places follows the geographical proximity law with
the outbreak centre in terms of geographical and
spatial distribution. The comprehensive risks of
Shanghai, Zhejiang, Jiangsu, Anhui, Henan, Hunan
and other places follow the geographical proximity
to in terms of geospatial distribution.
For high-risk areas, relevant departments should
pay more attention at the epidemic prevention and
emergency response, and implement strict control
strategies such as non-proliferation internally, and
export-prevention externally, especially in the areas
with a developed economy, large personnel mobility
and density, where should also pay attention to the
risk control of the epidemic. In addition, after the
outbreak of COVID-19, it also exposed the
problems in the medical and health service facilities
and public health emergency management system.
We need to learn from it and improve the major
epidemic prevention and control system and
Comprehensive Risk Assessment and Spatial Pattern Analysis of COVID-19 of China
113

mechanism, regular the national public health
emergency management system, and perfect the
incentive mechanism, cultivate more health
technicians, and to the end to improve the response
ability and management level of major public health
emergencies.
The deficiency in this paper is that we just
mainly analyse the spatial distribution pattern and
aggregation pattern of Comprehensive risks of
COVID-19, and some other factors that may affect
COVID-19does not take account into the research
system, such as urbanization process, regional
economic development level, fiscal expenditure,
population migration and migration and adjacent to
other countries and so on. In future research, we will
further consider and incorporate the above relevant
factors to simulate and predict the outbreak risks and
trends of COVID-19.
ACKNOWLEDGEMENTS
This study was supported by the "public
management" construction project of Characteristic
Key Discipline from Guangdong Province, China in
2016(F2017STSD01), Scientific research fund
projects of Guangzhou Xinhua University
(2018ZDXKZZ03), "The COVID-19" epidemic
prevention and control research
project(2020YQYJ06), Guangdong Higher
Education Teaching Reform project (F2018J051).
REFERENCES
Jia Kang. Analysis of the impact of COVID-19 on China's
economy [J]. Economic Research Reference, 2020 (6):
80-85.
Li Chenxi, Wu Qunhong, Shao Yingqi, et al (2020).
COVID-19 Epidemic Analysis in Hubei Province
based on ESDA [J]. Modern Preventive Medicine, 47
(20): 28-33.
Li Liming (2021). Post-Public Health Outlook for
COVID-19 [J]. Chinese Journal of Epidemiology,
42(7): 1-5.
Liang Ze, Wang Yueyao, Sun Fuyue, Liang Chenyu, et al.
Geographic distribution pattern of urban COVID-19
incidence in China: population migration and socio-
economic factors [J]. Environmental Science
Research, 33 (7), 1571-1578.
Liu Tao, Jin Yongai (2020). The spatial-temporal dynamic
of COVID-19 diffusion in China from the perspective
of Population mobility: Comparative Study of
Traditional and Big Data [J]. Population Study, 44(5),
44-59.
Liu Xun, Meng Qiuyu, Zhang Hong, et al. (2020).
Preliminary Analysis of the spatial and temporal
distribution characteristics of the COVID-19 epidemic
in Hubei Province [J]. Practical Preventive Medicine,
27 (8): 902-905.
Liu Yi, Li Yuan, Li Chaoling, et al. (2020). Diffusion
characteristics of the COVID-19 epidemic in
Guangdong Province [J]. Tropical Geography, 40(3):
367-374.
Lv Zhenhua, Cheng Shaowen (2020). Research on Space-
temporal Characteristics of COVID-19 in Hubei
Province based on Crystal Ball and GIS [J]. Journal of
Central China Normal University (Natural Science
Edition), 54(6): 153-165.
Pan Jiahua. Security Risk and Control of Urban Space
Gathering —— takes COVID-19 prevention and
response as an example [J]. People's Forum Academic
Frontier, 2020 (4): 12-18.
Qi Cuifang, Yang Zixuan, Yang Wenfang (2020). Factors
affecting the inter-provincial transmission and
development of COVID-19: Data analysis based on
the data of 30 provinces and cities [J]. Journal of Xi'an
Jiaotong University (Medical Edition), 41(5): 757-
763.
Wang Xuyan, Yu Yong, Hu Ying, et al. An Analysis of
COVID-19 epidemic prediction in Hubei Province
based on the exponential smoothing model [J]. Public
Health and Preventive Medicine, 2020 (1): 1-4.
Zeng Yongming, Luo Zeping, Yang Min, et al. Study on
Spatial Spread and Distribution of Urban Early
COVID-19 Epidemic [J]. Population and Society,
2020,36 (5): 69-84.
ICHIH 2022 - International Conference on Health Big Data and Intelligent Healthcare
114
